Shahar Azulay
•
July 26, 2023
July 26, 2023

*We will get back to you quicker than you can say Extended Berkeley Packet Filter
Dive into the world of Prometheus Alertmanager to understand its purpose, why it's essential for alert management, and explore its major features


Prometheus – the open source monitoring and alerting tool, not the progenitor of fire – is great at collecting metrics data from workloads and generating alerts when something looks fishy. What it's not so great at doing though, at least on its own, is making sure that it's easy for your engineers to figure out which alerts actually matter. Nor does Prometheus do anything to ensure that alerts arrive at the right locations. Prometheus itself is just a monitoring tool, not a data processing and routing tool.
Fortunately, the good people who develop Prometheus recognize that many teams need to do various things with their data once Prometheus collects it. To help with that task, Prometheus developers offer Alertmanager, an optional tool that you can use alongside Prometheus itself to streamline management of the alerts.
This article breaks down everything you need to know about Alertmanager, including why it's important, how it's designed and how to configure it. We'll also touch on why we at groundcover love Prometheus Alertmanager so much, and how it has made our lives easier.
Prometheus Alertmanager is an open source tool developed by the Prometheus project to help teams manage the alerting data that Prometheus produces.
To use Alertmanager, you configure clients, which are data sources for Alertmanager. In most cases, clients are Prometheus server instances. Then, you tell Alertmanager what you want it to do with alerts when the clients generate them.
Alertmanager can do lots of things, such as:
• Grouping similar alerts together so that your team sees fewer total numbers of alerts.
• Muting alerts for a set period of time.
• Forwarding alerts to various analytics and incident management tools, where the alerts serve as the foundation for other workflows.
Alertmanager runs as a standalone binary. You can launch an instance inside a Docker container with a command like:
Or, you can download a binary from the Prometheus website and run it directly on your favorite operating system. You can even build it from source by pulling the code from GitHub if you are truly ambitious (or want bleeding-edge features that you won't get from precompiled binaries). But we recommend using Docker. It's the simplest and least messy approach.
You certainly don't have to use Alertmanager to use Prometheus. There's nothing to stop you from deploying Prometheus on its own and either not managing its alerts in any systematic way, or sending the alerts directly to another platform (like PagerDuty) and trying to work with them efficiently there.
However, the main benefit of Alertmanager is that it provides a simple and effective way to optimize alerting data as soon as it's generated. By grouping and deduplicating alerts, Alertmanager can help you reduce the "noise" that your team needs to sort through as it figures out which alerts actually matter and which ones to prioritize. Alertmanager can also reduce the frequency of false-positive alerts in some cases.
And, because Alertmanager can route alerts to various third-party tools, it's a handy way to get your alerting data where it needs to go. There are other methods in many cases for getting alerts from Prometheus into another tool (such as deploying an agent for the other tool and having it collect data directly from Prometheus), but the ability to push alerts from Prometheus with Alertmanager, rather than having to set up another tool to pull them in, simplifies the overall architecture of most monitoring and alerting stacks.
Now that we know basically what Alertmanager does and why it's so useful, let's dive into the technical details of how it works, starting with the Alertmanager architecture.
As we said, Alertmanager itself runs as a single binary. However, to use it, you typically need to configure a few components:
When you put these components together, you get a functioning alert management and notification system. The clients generate alerts, integration rules tell Alertmanager how to process alerts and the integrations allow Alertmanager to send alerts to wherever you want them to go.
You manage most aspects of Alertmanager configuration via a configuration file. (You can also pass some command-line flags to the binary, but those are used mostly for managing the binary rather than configuring Alertmanager operations.)
You write the configuration file in YAML. You can configure a variety of parameters that tell Alertmanager how to group and route alerts. You can also configure some basic global parameters for managing things like the SMPT configuration that your Alertmanager instance uses to send emails.
For example, what the global config parameters might look like:
This is based on the example configuration that the Prometheus developers provide on GitHub.
Alerting rules are also defined in the configuration file. For example, if you want to tell Alertmanager to wait 30 seconds before sending a notification about a new batch of alerts, you could configure the group_wait parameters as follows:
Telling Alertmanager to wait 30 seconds before sending a notification about a new batch of alerts comes in handy in situations where your alerts are arriving in multiple sets and you want to make sure you receive a separate notification for each set.
For full details on the available alert rule configuration parameters, see the Prometheus documentation.
In addition to configuring different alerting intervals or delays, Alertmanager lets you set grouping and routing rules. These are useful if you want to take multiple interrelated alerts and turn them into a single notification – which is a great way to make your engineers less frustrated by reducing the number of individual alerts they have to contend with.
For instance, you can set a route configuration as followings:
This configuration means that alerts that have the same alertname (which you'd configure elsewhere in the file) and that are associated with the same cluster and service should be compiled into a single notification. So, if you have recurring alerts of the same type from the same part of your infrastructure, you wouldn't end up with a bunch of redundant alerts.
To tell Alertmanager where to send alerts, you must first determine which notification methods are supported by the destination. For example, you can send notifications to Slack via Webhooks, but you'd typically use the SMTP protocol if you wanted to send out notifications via email.
Once you know which notification method you'll use and what the location of your destination is, configure them appropriately in the Alertmanager config file. For example, here's a sample configuration for Slack:
Above, we outlined just the basic alert management and routing features that Alertmanager provides. Alertmanager can do many other cool things, too, and we’d like to touch on a few advanced features of the tool.
Sometimes, you want to ignore certain alerts for a given period of time. You can do this by silencing them.
Silencing is a little tricky because there is no parameter that you can enter in the Alertmanager config file to silence alerts explicitly. But what you can do is select the alerts you want to silence, then route them to a "null" destination as follows:
(Props to our friends on Stack Overflow for that idea, as well as other approaches to alert silencing that you'll find discussed in that thread.)
Like many other things in the world of cloud native computing (Kubernetes, we're thinking of you), Prometheus Alertmanager can optionally be configured to run in high availability mode.
The full details for configuring high availability are explained on GitHub, but basically, you use command-line flags starting with --cluster when you launch Alertmanager instances to set up a cluster of instances. Then, you configure Prometheus itself such that it connects to multiple instances:
And voilà. Assuming you have Alertmanager instances up and listening on the appropriate ports, Prometheus will push its alerts to each instance, and the instances will work together as a cluster to manage them. A single instance failure will not bring your alert management workflow crashing to the ground.
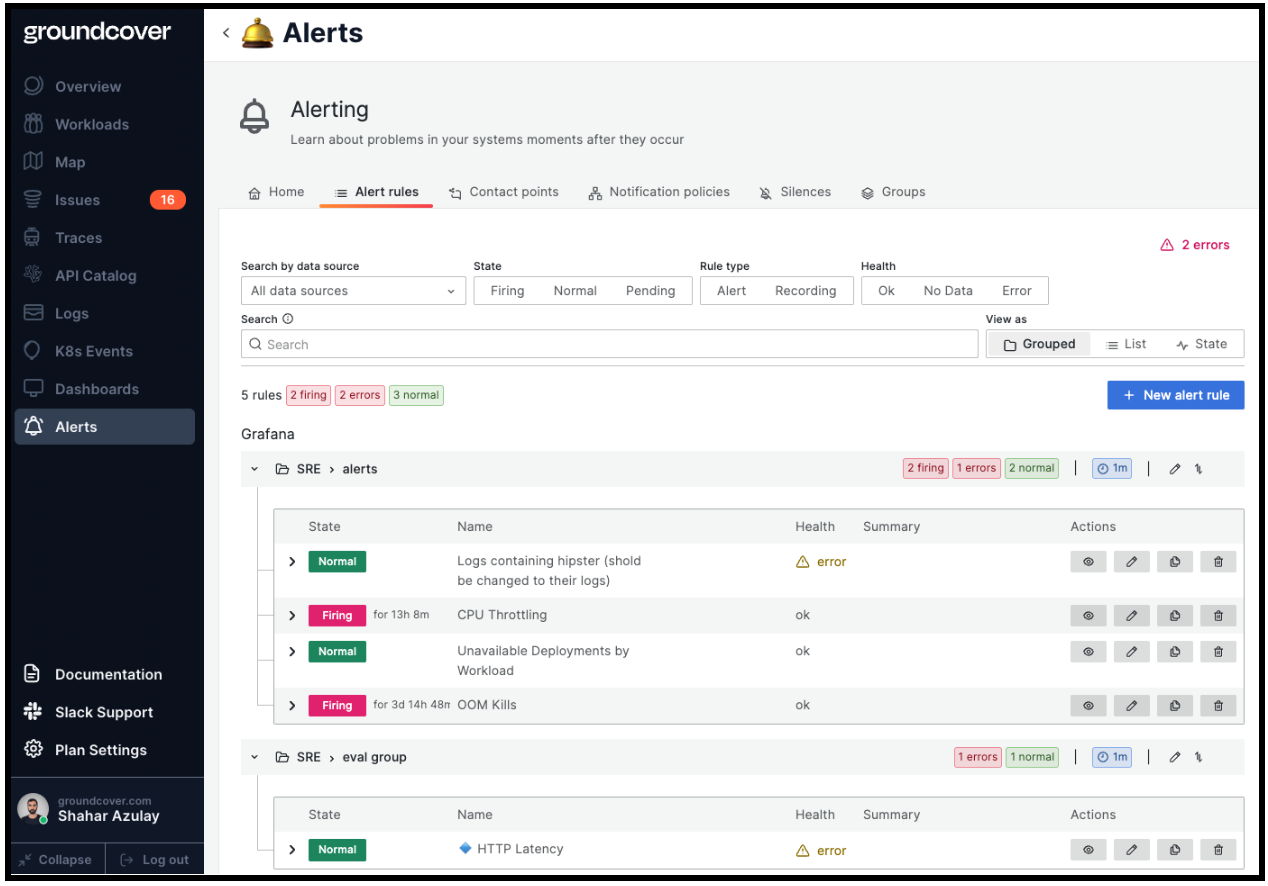
Prometheus Alertmanager is so awesome that the people behind Grafana, the open source observability tool, decided to integrate their tool with Alertmanager. The integration makes it possible to set alerts using the Prometheus Query Language (PromQL) for any Prometheus data source from directly within Grafana dashboards.
Grafana’s Alertmanager is an internal Alertmanager that is pre-configured and available for selection by default if you run Grafana on-premise or open-source. Grafana has its own alerting system, too, that can replace alert rules set directly inside Prometheus. It helps consolidate alert rules across multiple data sources in one place., and also make it very comfortable to have the visualization (graphs) and the alerts in the same place.Grafana Alerting together with its embedded Alertmanager is a powerful combination that allows setting alerts and managing them easily all inside Grafana.
If you want to use a single alertmanager to receive all your Grafana, Prometheus and perhaps other alerts, you can also set up Grafana to use an external Alertmanager. This external Alertmanager can be configured and administered from within Grafana itself.

groundcover is a cloud-native observability platform. We monitor data all across the stack from logs to detailed traces. One of the most critical pieces of information groundcover creates and collects are metrics. Metrics detailing resource consumptions like CPU and memory, metrics that capture span-based metrics like throughput, error rate and latency of any active endpoint, and even custom metrics capturing intricate business logics defined by our customers.
In some high scale environments groundcover collects hundreds of millions of different metrics.
Metrics are powerful since unlike logs and traces they capture a single number, over time. And as engineers - we get numbers. Numbers can be turned into time series graphs to spot drifts and anomalies, they can be used to quickly project hundreds of different parts of a complex system into simple patterns one can track, and most importantly they can intuitively be turned into alerts. It’s easy to understand the meaning of setting a threshold and making sure a metric doesn’t cross it, and in most cases it’s pretty straightforward to find these thresholds for various aspects of your production.
With all that data we had to find the simplest way to let our customers visualize their metrics easily and use them to set alerts they can trust - from a node crossing the 85% CPU utilization mark to a customer-facing API breaking a latency SLO.
Grafana is one of the most diverse and robust dashboarding systems out there. Put together with its internal alerting and Alertmanager integration - we found just what we were looking for.
Today, groundcover keeps all the metrics it collects in a Prometheus-compatible data source that it wired out-of-the-box to our managed Grafana.
Users can immediately start visualizing their metrics and use them to set and manage their alert pipelines.
We're not saying you have to use Alertmanager if you use Prometheus, Grafana or any other tool that helps you monitor what's going on in your cloud native workloads.
But we are saying that life is considerably easier when you take advantage of Alertmanager. It's a surprisingly simple tool – it runs as a single binary, after all, and it's pretty flexible about where and how it's hosted – that lets you do a lot of powerful things. You can significantly reduce the noise that you impose upon your engineers as they monitor workloads, and you can move processed alerts into various locations of your choosing.
So, if you want to do alerting the simple way, consider Alertmanager. There is a very high chance that will make your engineers happier, while also reducing the time it takes to recognize and react to high-priority alerts.
.webp)
*We will get back to you quicker than you can say Extended Berkeley Packet Filter
![Kubernetes Monitoring (APM): Guide, Tools & Techniques [2023]](https://assets-global.website-files.com/626a25d633b1b99aa0e1afa7/64aa6a83e4f2ae05bedc16b5_A2.png)