
OpenTelemetry and eBPF: Everything You Need to Know
Get to know how two disruptive technologies - OpenTelemetry and eBPF - are reshaping the observability and application performance monitoring world. Discover why and how each of them are critical to a making your cloud-native environment fast, scalable, and simple.

If you’re into observability, efficiency, and consistency, you'll love OpenTelemetry and eBPF, two innovative technologies that have spent the past several years disrupting the world of observability and application performance management. Each solution contributes in unique ways to faster, more scalable, and more effective visibility into complex, cloud-native environments.
That, at least, is a high-level overview of what OpenTelemetry and eBPF do, and how they fit together. For the full details, keep reading as we unpack everything you need to know about these solutions.
What is OpenTelemetry?
OpenTelemetry – or OTel, as people in the know like to call it – is an observability framework based on open standards. OpenTelemetry includes a collection of APIs, Software Development Kits (SDKs), and other tools that help collect observability data from applications.
OpenTelemetry's name reflects the fact that it's an open approach to telemetry, which (in the context of observability, at least) refers to the collection of data from remote systems.
How does OpenTelemetry work?

To use OpenTelemetry, developers typically add an OTel instrumentation library to apps that they are building. The library provides the functionality for exporting observability data from the app. Then, the team responsible for observing the app once it's deployed into production can use an OpenTelemetry-compliant observability tool (like groundcover, which features full-fledged OTel support) to collect data from the app.
Benefits of OpenTelemetry
Why should you care about this? Because with OpenTelemetry, teams gain a consistent, standardized way to work with observability data. The core idea behind the OpenTelemetry project is to make it possible to observe any application using a standardized approach.
Without a solution like OpenTelemetry, developers would have to implement custom logic for exporting observability data from applications. In addition, they would have to make sure that the functionality they build is compatible with whichever observability tools their organization uses – and they would have to update the functionality if the organization were to switch to different tools.
But when you use OpenTelemetry, your developers can easily implement logic into virtually any app for exporting observability data by using prebuilt OTel libraries, and your IT operations and DevOps teams can use any observability tool to collect and analyze that data.
What is eBPF?
The extended Berkeley Packet Filter, or eBPF, is a Linux kernel feature that makes it possible to run sandboxed programs in kernel space.
To explain that in slightly less geeky terms, this means that eBPF lets you tell a Linux-based operating system to execute custom code. Because the code runs directly within the operating system (i.e., "kernel space") instead of as a conventional application (which runs in "user space"), it's very efficient. In addition, the ability to run programs inside sandboxed environments using eBPF mitigates many of the security risks associated with loading custom code into an operating system.
On top of all of this, eBPF lets you run custom code within the kernel without having to load kernel modules, which is a benefit because kernel modules typically have higher resource overhead than eBPF programs and could contain bugs that crash your system. Changing kernel source code, too, is unnecessary. You just have to write code for the eBPF programs and load them into an existing, precompiled kernel, without modifying kernel code itself.
How does eBPF work?
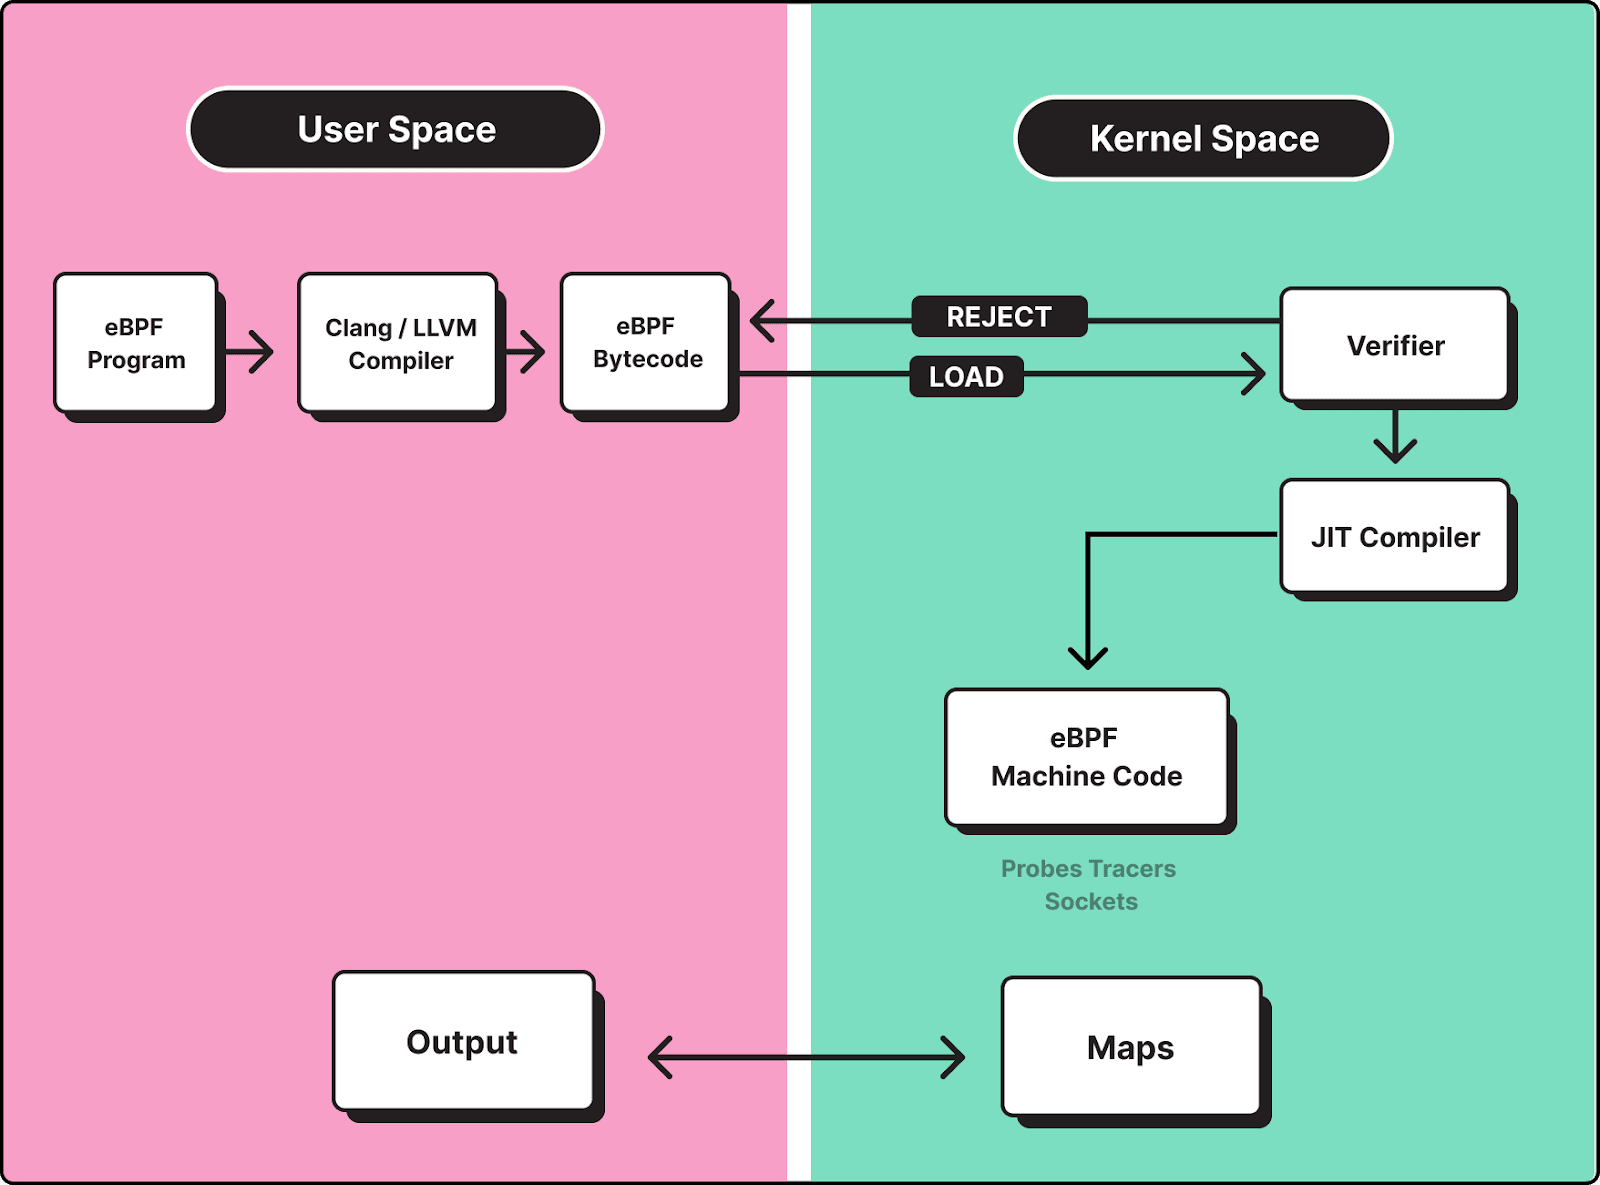
We have an entire blog that walks through the nitty-gritty details of how eBPF observability and eBPF tracing work. But suffice it to say that, essentially, using eBPF entails loading custom programs into the Linux kernel. The programs contain code that tells eBPF which data to collect and where to send it.
As long as the programs pass some basic validity checks, eBPF executes them, providing access to whichever data they were designed to provide.
You can write and deploy eBPF programs yourself, if you like pain and suffering (or you just really like to program). But the faster, easier way to take advantage of eBPF is to use an observability tool like groundcover, which leverages eBPF under the hood for collecting data – meaning you get the efficiency of eBPF-based observability without having to do the hard work of writing and deploying your own eBPF code.
Benefits of eBPF
The main benefit of eBPF is that it offers a hyper-efficient way to collect virtually any type of observability data from any application or service hosted on a Linux server.
The conventional alternative to eBPF is to collect observability data from servers using software agents that run in user space. The big drawback of that approach is that user space applications consume a lot more CPU and memory, so there is a higher "cost" (in terms of resource utilization) to implementing observability in this way.
In addition, the ability of software agents to access observability data is often limited because they can only collect data that the operating system exposes to them. eBPF programs provide deeper visibility because they run directly within the operating system.
So, by using eBPF, you get an observability solution that is way more efficient and effective than conventional tools.
Key differences between OpenTelemetry and eBPF
OpenTelemetry and eBPF both simplify observability. But they do so in different ways, and it's important to understand the distinctions between each type of solution.
The main differences between OpenTelemetry and eBPF include:
- OpenTelemetry libraries run within applications to export observability data, whereas eBPF leverages the operating system to collect that data. This means that each solution operates within a different layer of your hosting stack.
- OpenTelemetry relies on code that runs in user space (at least in most cases – the exception is if you use an OTel data collector that runs in kernel space, as we explain below), whereas eBPF code runs in kernel space. This makes eBPF more efficient from a resource utilization standpoint.
- OpenTelemetry is a set of different tools (including APIs, SDKs, and more), whereas eBPF is a single framework that is built into the Linux kernel.
- OpenTelemetry works across all major operating system platforms, whereas eBPF is currently only for Linux. (Microsoft is working on a version of eBPF for Windows but it's not clear if or when it may be production-ready.)
How to combine OpenTelemetry and eBPF for Observability
If you read this far, you know that OpenTelemetry and eBPF work in different ways and have different strengths. And you may be wondering which solution you should choose. The answer, in many cases, is "both." By combining OpenTelemetry and eBPF, you get the best of both worlds: The consistent, standardized approach to observability that OpenTelemetry delivers, combined with the efficiency and stability of eBPF.
But how, exactly, do you combine OpenTelemetry with eBPF? There are two basic approaches. Let's discuss each one.
Approach 1: Using OpenTelemetry for some data and eBPF for other data
One approach is to use OpenTelemetry to collect some observability data, while collecting other data with eBPF.
For instance, you could use OTel libraries within an application to expose metrics from the application, while using eBPF to observe other types of data, such as network performance. This would allow you to collect multiple types of data, which you could then correlate within an observability platform to help interpret application performance.
This approach doesn't integrate eBPF into OpenTelemetry. It simply involves using each solution alongside the other. That said, this approach is easy to implement because it doesn't require finding and deploying tools that integrate eBPF into OpenTelemetry.
Approach 2: Using eBPF-based OpenTelemetry collectors
You can also combine eBPF with OpenTelemetry by taking advantage of OpenTelemetry data collectors that use eBPF for collecting data. To understand what this means, let's step back a bit. We said above that OpenTelemetry typically relies on code that runs within applications – meaning it runs in user space – to export observability data.
That's true for most OpenTelemetry data collectors, but there are exceptions. Thanks to the OpenTelemetry eBPF project, a handful of OpenTelemetry data collectors (which we describe in the following section) are available that rely on eBPF for collecting data directly from the operating system kernel, rather than collecting it at the application level.
Using these data collectors effectively allows you to leverage eBPF as your data collection engine – meaning you get the efficiency of eBPF – while at the same time being able to export the data into any OpenTelemetry-compliant observability tool. So it is a best-of-both-worlds type of scenario.
The major drawback of this approach is that eBPF-based data collectors for OpenTelemetry remain relatively new (you can read about their goals and development plans by following the project's roadmap). In addition, the data collectors available currently support only certain types of data collection – which means you can't collect virtually any type of observability data, as you could if you wrote your own eBPF programs from scratch.
But as long as the existing eBPF-based data collectors meet your needs, using them as part of OpenTelemetry is currently the most effective way to use the two solutions together.
OpenTelemetry-eBPF package components
Currently, there are four main tools available from the OpenTelemetry eBPF project.
#1. kernel-collector
The main purpose of the kernel-collector is to monitor kernel events, and then send the resulting data to a remote host whose IP address is specified using the EBPF_NET_INTAKE_HOST variable.
#2. k8s-collector
The purpose of the k8s-collector is (you guessed it) to observe Kubernetes. Specifically, it listens for certain types of key events, like Pod creation, and then sends the resulting data to a remote data collector.
#3. cloud-collector
The cloud-collector collects observability data from supported cloud providers. (Currently, AWS and Google Cloud Platform are supported.)
#4. reducer
The reducer isn't a data collector. Instead, it takes data generated by the eBPF data collectors described above and translates it into metrics.
This is important because in its native form, eBPF data looks different from the data generated by conventional OpenTelemetry libraries. The reducer bridges this gap, helping to ensure that eBPF-based insights "look and feel" like the types of data that admins are used to collecting via OpenTelemetry.
How do OpenTelemetry and eBPF work together? An example
As an example of using OpenTelemetry and eBPF in tandem, imagine you want to collect network observability data via the kernel using eBPF, and then export it to tools that accept data based on the OpenTelemetry standard.
You can use the OpenTelemetry kernel-collector tool to do this. The steps are as follows:
1. Compile kernel-collector
You need to compile kernel-collector for the system where you plan to run it.
We won't walk through the steps for building kernel-collector because they're amply documented by the OpenTelemetry-eBPF project. But suffice it to say that they boil down to:
- Deploying a container that hosts a build environment. You can build this container from scratch, or use a preexisting image.
- Entering the container and building kernel-collector using a build script provided by the container.
2. Compile the reducer
You'll also need to compile the reducer, which (as we mentioned) translates eBPF output into an OpenTelemetry-friendly format. You can build the reducer using the same process and build script outlined above.
3. Deploy reducer and kernel-collector
After compiling the relevant tools, deploy them on the system you want to observe.
Run reducer first, using arguments that specify where you want it to export output and how to format the output. For instance, to export data in the Prometheus format, you would run:
Once the reducer is running, you can start kernel-collector. Before running the binary, you need to specify the IP address or hostname where your reducer instance is hosted by configuring the EBPF_NET_INTAKE_HOST environment variable. For instance, if reducer is running on the same host where you'll be starting the kernel-collector, you'd set the variable as follows:
You may also need to define the port number where the reducer is listening using the EBPF_NET_INTAKE_PORT environment variable.
With the environment variables properly configured, you're ready to start kernel-collector with:
Once up and running, kernel-collector will collect observability data using eBPF, and then stream it to the reducer. From there, the data will be available in whichever OpenTelemetry-compatible format you configured when starting the reducer. You can scrape the data from the reducer using an OpenTelemetry-compatible tool.
You could also send the metrics from the reducer to an OTel data collector using a protocol like gRPC, if you configure the reducer to run this way. (Check the documentation for all of the details and options.)
Are there OpenTelemetry and eBPF alternatives?
The only real alternatives to both OpenTelemetry and eBPF is to take the hard, time-consuming approach of instrumenting observability directly within your applications. If you do that, you're depriving yourself of the convenience of being able to collect observability data in a standardized, consistent way – and one that doesn't require custom coding – using OpenTelemetry. You're also losing out on the efficiency benefits of eBPF.
That said, custom observability instrumentation might be necessary for supporting edge cases where neither OpenTelemetry nor eBPF work. For example, you might need to collect unusual types of data that OpenTelemetry doesn't support, and you also may not be able to use eBPF because your app doesn't run on Linux.
However, situations where there's a good reason to look for an alternative to OpenTelemetry or eBPF are rare. In most cases, you should use at least one of these solutions – if not both – to simplify observability.
Using eBPF and OpenTelemetry with groundcover
If you choose groundcover as an observability solution, you can benefit from both OpenTelmetry and eBPF without the hard work of setting up the solutions from scratch.
That's because groundcover can ingest any data formatted using the OpenTelemetry standard – so no matter which types of app you want to observe or which data you want to collect, groundcover will accept and analyze it, so long as you instrumented observability within your apps using OTel.
At the same time, because groundcover uses eBPF under the hood when it collects data itself, users benefit from the hyper-efficiency of eBPF-based observability, without having to write custom eBPF programs.
In short, whether you want to observe application data in a standardized way using OpenTelemetry, leverage eBPF to create data sources, or both, groundcover has you covered.
OTel, eBPF and the future of observability
No one's saying you have to use OpenTelemetry or eBPF if you want to observe modern apps. But if you want observability that is efficient, scalable, and effective, you'll probably want to take advantage of at least one of these solutions – or better yet, use them together to supercharge your observability strategy.
.webp)