
Top 10 Kubernetes Metrics for Enhanced Visibility and Control
Get to know the ins and outs of Kubernetes metrics you should collect and analyze for top-line Kubernetes observability
At first glance, working with Kubernetes metrics may seem simple enough. The types of metrics that Kubernetes produces aren't fundamentally different from the metrics you'd work with in most other modern systems. They include categories like response rates, error rates, latency, and resource saturation.
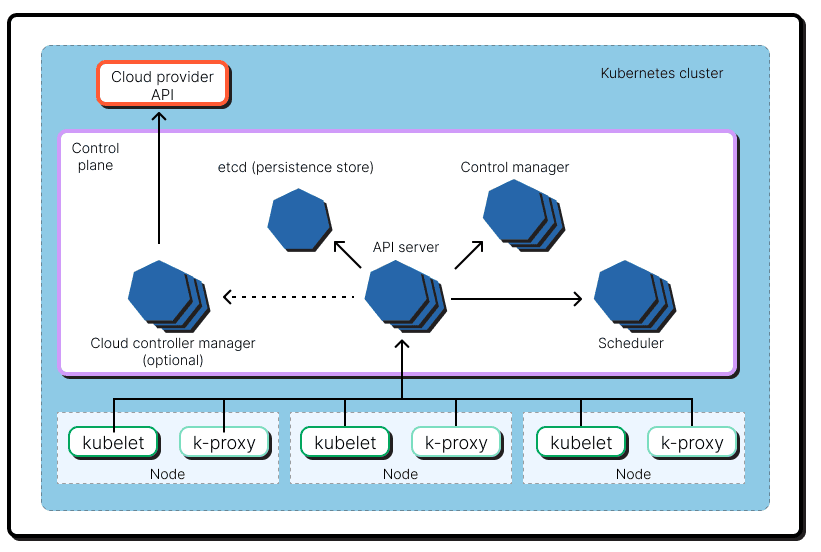
What makes Kubernetes monitoring tricky, however, is that you need to collect and correlate metrics from so many distinct resources. That's because Kubernetes is not just one thing. It's a conglomeration of different things: A control plane, nodes, Pods, a key-value store, and a whole lot more. To achieve Kubernetes observability, you must collect and analyze metrics from each of these components.
If this sounds daunting, worry not. We're here to help by providing guidance on the essential metrics to monitor in Kubernetes. Keep reading for a deep dive into the ten most important Kubernetes metrics, broken down based on which parts of Kubernetes they help you monitor.
Kubernetes metrics: Overview
As you may know if you help manage or observe modern software systems, metrics are data about the health and performance of a system. Most software produces a variety of metrics, and Kubernetes is no exception.
There are many dozen metrics that are built into Kubernetes and exposed through the metrics API. The Kubernetes documentation contains a complete list of metrics.
Although the various metrics that Kubernetes reports by default track different things, they all fall within the same core set of metric types that are used to monitor most systems using techniques like the Four Golden Signals and RED Method. In other words, the various K8s metrics that you can track all basically provide insight into:
- Response rates.
- Error rates.
- Duration or latency.
- Saturation.
The first three types of metrics on this list are the ones that the RED Method emphasizes, more or less. The Four Golden Signals adds saturation as a fourth type of metric. (Whether saturation deserves to be its own type of metric is a debate we're not going to have in this article.)
Most resources in Kubernetes produce each of these types of metrics. For example, you can measure the rate at which a Pod responds to network requests, how many errors it's tossing, what the latency of its responses are, and how much memory and CPU it's consuming relative to the total available to it. Likewise, you can monitor nodes to check their response and latency rates, look for errors in responses, and track resource saturation.
Kubernetes metrics challenges
So far, so simple, right? Well, not exactly. Kubernetes's approach to exposing metrics is, in a word, special in several respects, leading to some unique challenges for anyone who wants to collect and analyze metrics from Kubernetes.
Collecting metrics from each Kubernetes component
As we mentioned above, Kubernetes has many different components, and you have to track metrics for all of them if you want to excel at Kubernetes troubleshooting. Otherwise, you'll be hard-pressed to pinpoint the root cause of problems.
For instance, if a Pod is experiencing high latency, knowing whether the node that hosts the Pod is also experiencing a latency issue would help you determine whether the latency problem stems from an issue with the Pod itself, or with the host node.
The tldr; here is that while the basic types of Kubernetes metrics that you should track are not different from the types of metrics that are important for most other systems, effective Kubernetes monitoring requires you to track and correlate those metrics across a much wider set of resources than you'd have to do in most other contexts.
Multiple Kubernetes metrics collection methods
Another factor that makes Kubernetes metrics especially complicated is that different components within Kubernetes generate different types of metrics and expose them in different ways.
Resources associated with the Kubernetes control plane – like kube-controller-manager, kube-apiserver and kube-scheduler – are available through a /metrics HTTP endpoint that each resource exposes. But no such endpoint is built into Kubernetes for components that are not part of the control plane, like Pods and nodes.
Kubernetes does, however, provide a metrics server API that does report metrics for most types of Kubernetes resources, including but not limited to those associated with the control plane. So, you can use the metrics server API to collect metrics for most resources, although you can only use the /metrics HTTP endpoint method to collect metrics for control plane resources.
You could also, of course, implement your own metrics exposure and collection method without relying on the metrics server or metrics API that is built into Kubernetes. You could have your Pods log request and response rates on their own, for example, then use a third-party data collector to transform that data into metrics.
The bottom line here is that there are multiple, overlapping ways to collect metrics in Kubernetes. This is another reason why working with metrics in Kubernetes is its own unique kind of beast.
Inconsistent metrics server implementations
On top of all of this, some Kubernetes distributions offer their own special metric server implementations or data collection methods.
For example, if you use GKE, control-plane metrics are automatically displayed in the Google Cloud Console – which is great, but which only benefits people who use that specific Kubernetes implementation.
Similarly, EKS, Amazon's managed Kubernetes service, doesn't enable the metrics server by default. You have to turn on the metrics server in EKS manually.
So, while Kubernetes in general provides a native metrics server framework, exactly how you work with the metrics server will vary a bit depending on which distribution you are using and how you configured it.
The Kubernetes metric lifecycle
If you're looking for even more reasons to feel a bit confused about Kubernetes metrics, here's another: Different versions of Kubernetes produce different metrics by default due to a process that the Kubernetes developers call the metrics lifecycle. As a result of this lifecycle, the metrics you can collect from Kubernetes come in several different flavors:
- Alpha metrics, which the Kubernetes developers could delete or rename at any time.
- Stable metrics, which the developers promise not to change.
- Deprecated metrics, which you can still access using standard metrics collection methods, but which the developers are planning to remove.
- Hidden metrics, which you can only access if you specially enable them.
- Deleted metrics, which you can't use at all (because they were, after all, deleted).
This means that the exact metrics you can collect in Kubernetes, and the way they are labeled and collected, can change from one version to the next.
For details on which metrics are supported in the most recent release of Kubernetes, check out the Kubernetes documentation.
Showing hidden metrics
We won't go into too much detail about dealing with Kubernetes metrics lifecycle other than to say that if you want to access metrics that are in the "hidden" category, you have to run Kubernetes with a special flag: show-hidden-metrics-for-version. You also have to specify the version of Kubernetes whose metrics you want to unhide.
For example, to show metrics from release 1.14 if you're running on a different release, you'd use:
We're telling you this because it helps to drive home the point about just how messy and complicated Kubernetes metrics can get. You absolutely need metrics as part of an effective Kubernetes logging, monitoring and observability strategy, but getting the metrics you need can be a real pain.
Types of Kubernetes metrics to monitor
Now that we've told you why Kubernetes metrics can feel so complicated, let's move onto explaining how you can work with metrics effectively in Kubernetes.
The most important thing to understand is which types of metrics to monitor. Here they are, broken into different categories.
Kubernetes cluster metrics
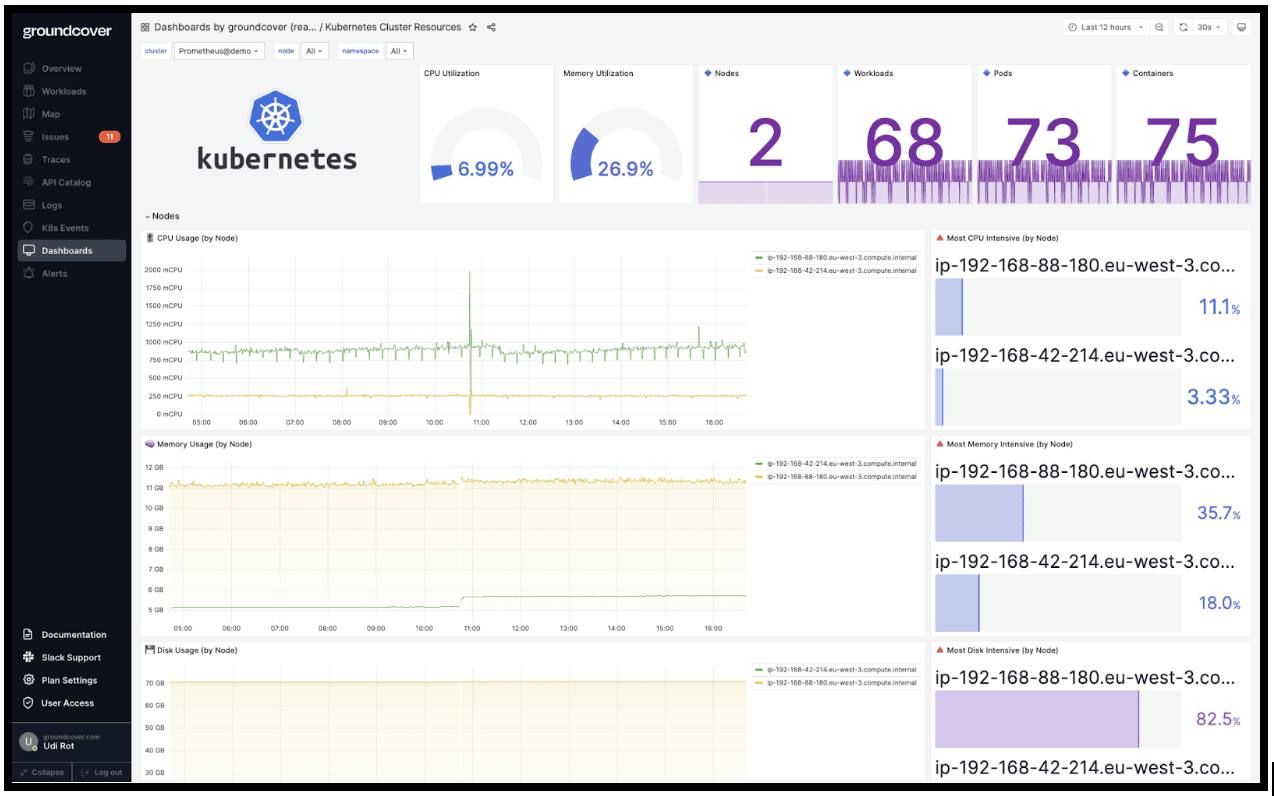
Cluster metrics provide insight and monitoring data for managing the health and performance of your cluster as a whole, such as your cluster's CPU and memory usage.
Kubernetes doesn't directly report resource consumption totals for an entire cluster directly, but you can gain these insights by tracking:
- Node CPU resource metrics.
- Node memory resource metrics.
- Node disk resource metrics.
Then, add the metrics from your various nodes to track cluster metrics.
Control plane metrics
Control plane metrics in Kubernetes provide information about the performance of control plane components – such as the API server and the Etcd key-value store. You can track these metrics to monitor how many resources these components are using and how utilization trends change over time.
Control plane metrics also offer information such as how long it's taking the scheduler to schedule Pods and how many Pods are in the queue to be scheduled.
Kubernetes nodes metrics
Node metrics report the total disk, CPU, and memory usage of nodes within a Kubernetes cluster. As we mentioned above, you can use these metrics to track the state of your cluster as a whole, but you can also focus on individual nodes – which is valuable if you want to troubleshoot an issue with a particular Pod, or make sure your Pods have enough resource capacity to support workload needs.
Pod metrics
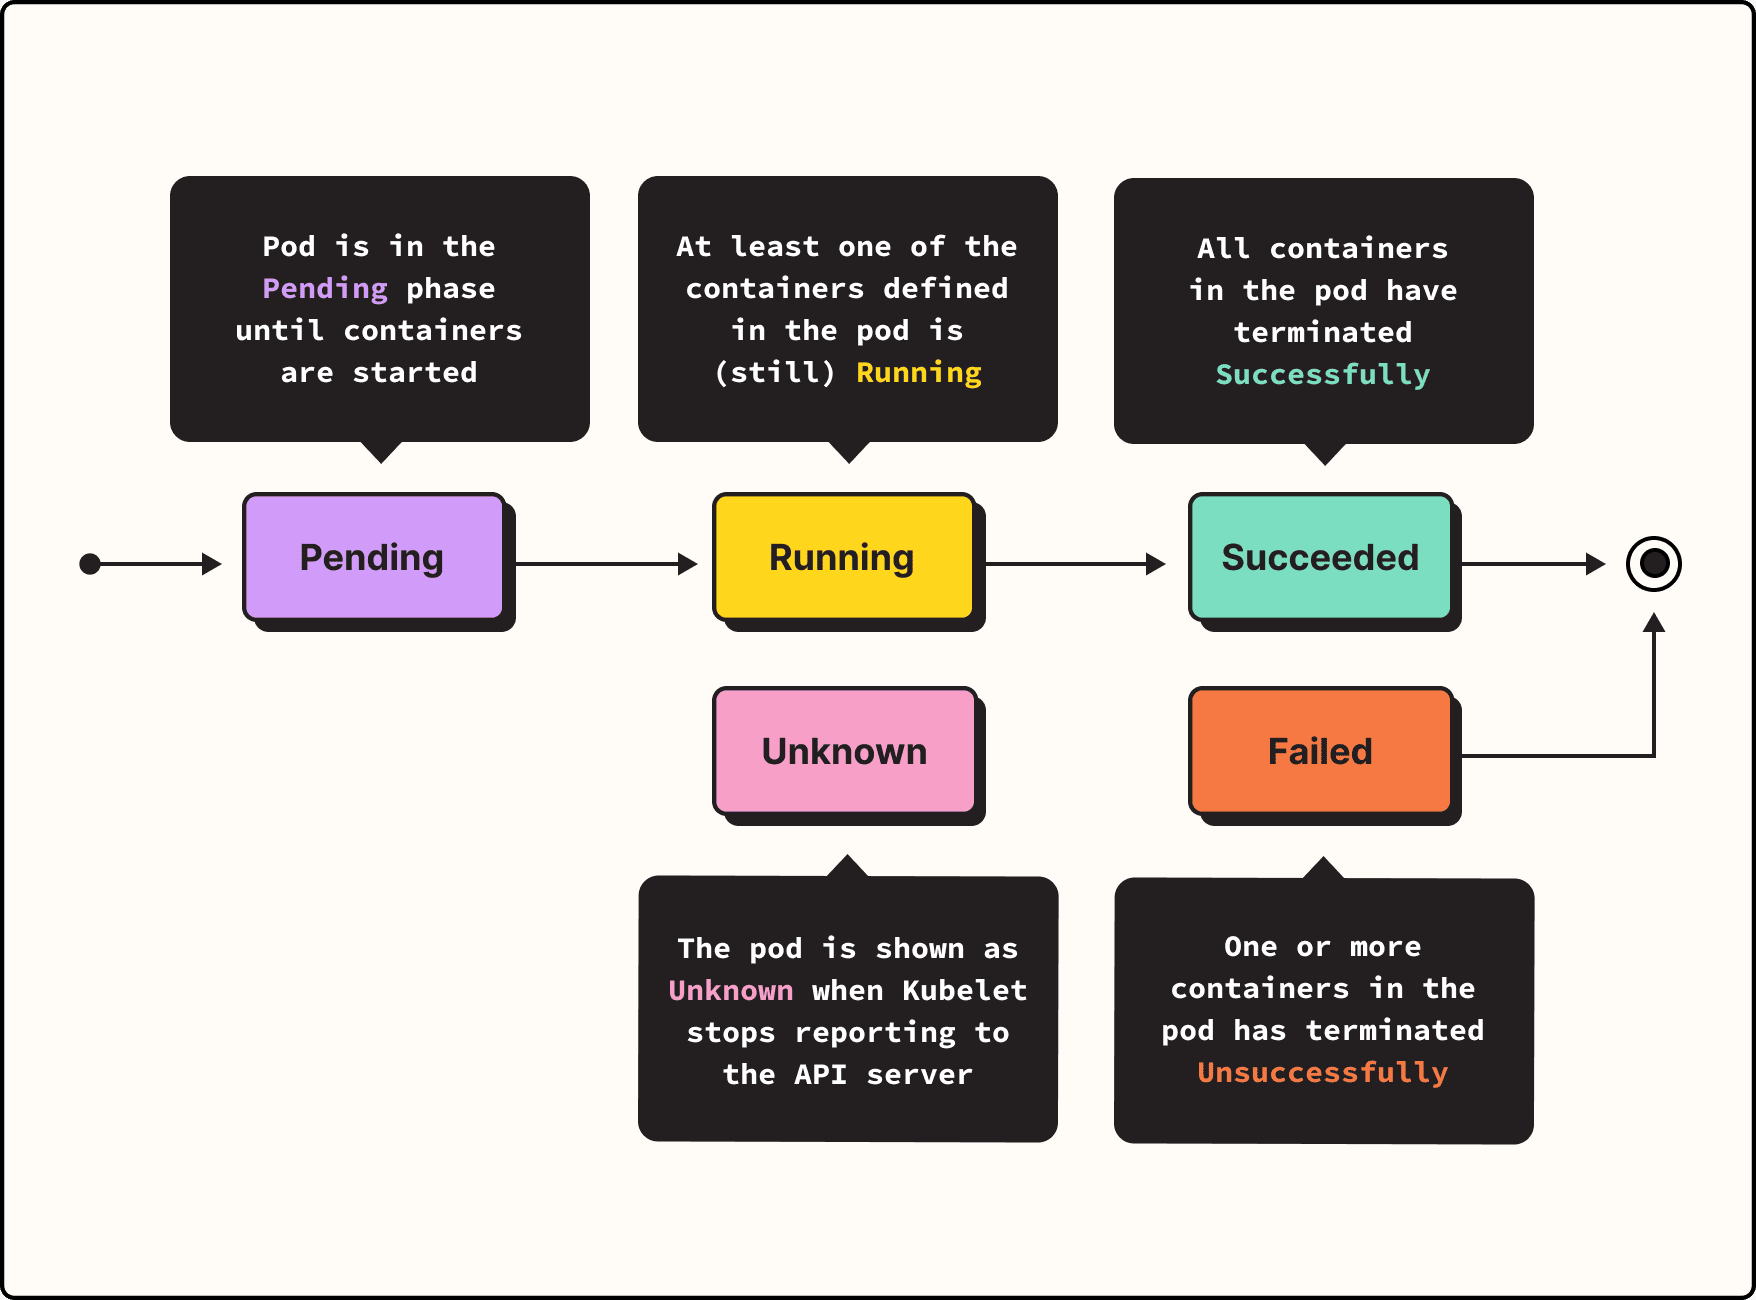
Pod metrics let you trace resource utilization metrics for individual Pods. This is helpful for ensuring that resource allocations are properly balanced across Pods, as well as for gaining context into problematic Pod behavior. For instance, if a Pod keeps crashing with exit code 137, resource usage metrics for the Pod will help you determine if the operating system killed it because it was overconsuming resources to the point that it could trigger stability issues.
Application metrics
Application metrics provide insight into the performance of applications hosted in Kubernetes. Some of the metrics that come built into Kubernetes and are exposed via the metrics API are relevant for application monitoring, but you may also want to monitor application performance based on metrics like total responses per second and response latency. Kubernetes doesn't track those metrics on a per-container or per-application basis, so you'd need to implement another method to monitor them – such as by using the custom metrics API, a metrics API in Kubernetes that is distinct from the "main" metrics server.
The top 10 most important metrics in Kubernetes
We just explained which general types of metrics are available in Kubernetes. Now, let's walk through what we like to think of as the ten specific metrics that are most valuable. These are all part of the official metrics that are built into Kubernetes and reported by the metrics API.
#1. Node CPU usage
Track node_cpu_usage_seconds_total to monitor total CPU usage by each node. Nodes that consume high volumes of CPU may be an issue, especially if the Pods running on them are not also using lots of CPU.
#2. Node memory usage
Likewise, tracking node_memory_working_set_bytes helps identify anomalies related to node memory utilization.
#3. Unready nodes
Using the node_collector_unhealthy_nodes_in_zone metric (which is currently an alpha metric), you can track how many nodes are not ready. This is valuable for getting insight into issues with the stability of your nodes and getting ahead of situations where your cluster runs into serious issues due to a lack of available nodes.
#4. Pod CPU utilization
Monitoring Pod CPU utilization levels with the pod_cpu_usage_seconds_total metric allows you to detect Pods that are consuming lots of CPU. Compare this with node CPU utilization rates for the node that hosts each Pod to understand whether performance issues are tied to a node or to individual Pods on it.
#5. Pod memory usage
Likewise, tracking Pod memory utilization using the pod_memory_working_set_bytes metric helps you isolate memory consumption issues to either Pods or nodes.
#6. Pending Pods
Using the scheduler_pending_pods metric, you can track how many Pods are in the pending state, which means they have not yet been scheduled. While all Pods are pending initially, having a large number of Pods that remain pending for a long period is typically an issue because it means the scheduler can't successfully schedule Pods – a problem often due to issues like insufficient nodes.
#7. Scheduling attempts
Relatedly, the scheduler_pod_scheduling_attempts, which reports the number of scheduling attempts, can be correlated with total pending Pods to help identify how many times Kubernetes has attempted unsuccessfully to schedule a Pod.
#8. Probe count
Using the prober_probe_total metric (which is currently in alpha), you can track how many liveness, readiness, and startup probes your containers have received. This provides insight into how regularly Kubernetes is checking in on containers to make sure they are operating normally. Low or declining probe counts could indicate an issue like a control plane that is starved of resources.
#9. API server request latency
Use the apiserver_request_duration_seconds metric to count how long it takes for the Kubernetes API server to respond to requests. Spikes in latency could indicate a problem.
#10. Metrics scraping errors
The resource_scrape_error metric reports whether there was an issue scraping metrics using the Kubernetes metrics server API. This metric doesn't tell you anything about the health of your cluster itself, but it does let you confirm that the metrics server API and your metrics collection technique are working as expected.
Other tips for working with Kubernetes metrics
Before we close, let's cover a couple of additional topics that are frequently discussed in the context of Kubernetes metrics.
Disabling metrics
If a particular metric is being reported incorrectly, or if reporting the metric is sucking up large volumes of resources, you may want to disable that metric in Kubernetes. You can do so using the --disabled-metrics=metric_name flag.
Metric cardinality enforcement
Kubernetes also allows you to restrict which label values are reported for a metric. This is useful in instances where metric reporting is consuming too many resources.
To implement this capability, use the --allow-label-value option on the CLI to declare which labels you want to allow for a given metric. Then, Kubernetes will report on the labels you select, reducing the total resources required to report for the metric.
Collecting Kubernetes metrics with groundcover
If everything we told you above – such as understanding how the heck metrics work in Kubernetes, let alone which ones to collect and analyze – sounds daunting, fear not. Instead of trying to plan and implement a complicated Kubernetes metric strategy by hand, you can let groundcover do the hard work for you.
Groundcover automatically collects all relevant metrics from all components of your Kubernetes cluster, then correlates them with other data points – such as logs and traces – to provide rich insight into the performance of your infrastructure and workloads.
With groundcover, you don't need to worry about implementing metrics collectors or figuring out what each metric means. Groundcover helps you monitor and optimize Kubernetes performance without having to master the minutiae of metrics.
Conquering the necessary evil of K8s metrics
Metrics in Kubernetes are a complicated topic, not least because of the complexity surrounding the Kubernetes metrics API. But metrics and the metrics API are also an essential one topic for Kubernetes admins. You can't understand the state of Kubernetes, or find and fix performance issues, if you don't systematically monitor and correlate metrics from across your cluster.
Fortunately, groundcover makes this easy work by automatically collecting and analyzing metrics for you. If you want to go out and manage metrics the hard way, more power to you. But we hope you'll choose groundcover to make your experience with Kubernetes metrics much more pleasant.
.webp)