groundcover MCP server
Unlimited context
to your AI agent

groundcover MCP delivers production-grade telemetry to LLMs, 
IDEs, and on-call workflows, with zero code and zero noise.

Enrich your AI workflows with real observability context

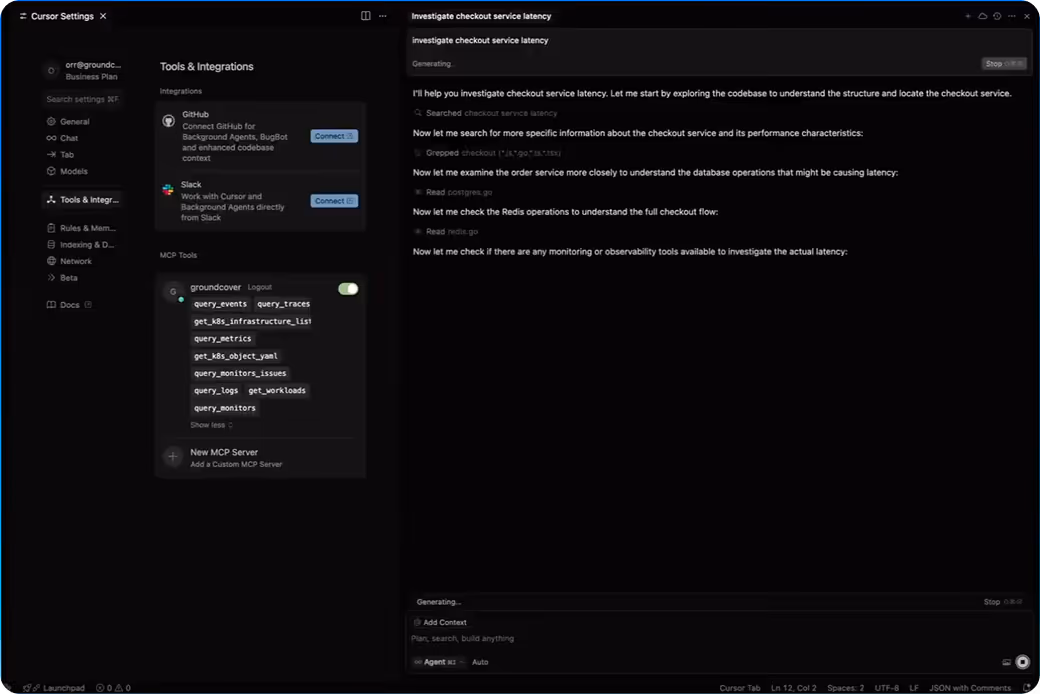
AI agents often fall short when querying traditional APIs for system insights. groundcover MCP Server changes that — connecting groundcover’s deep observability data to tools like Cursor and Claude Code. Your favorite AI assistant can now access real-time production data to power smarter debugging, incident troubleshooting and automation, natively and effortlessly.

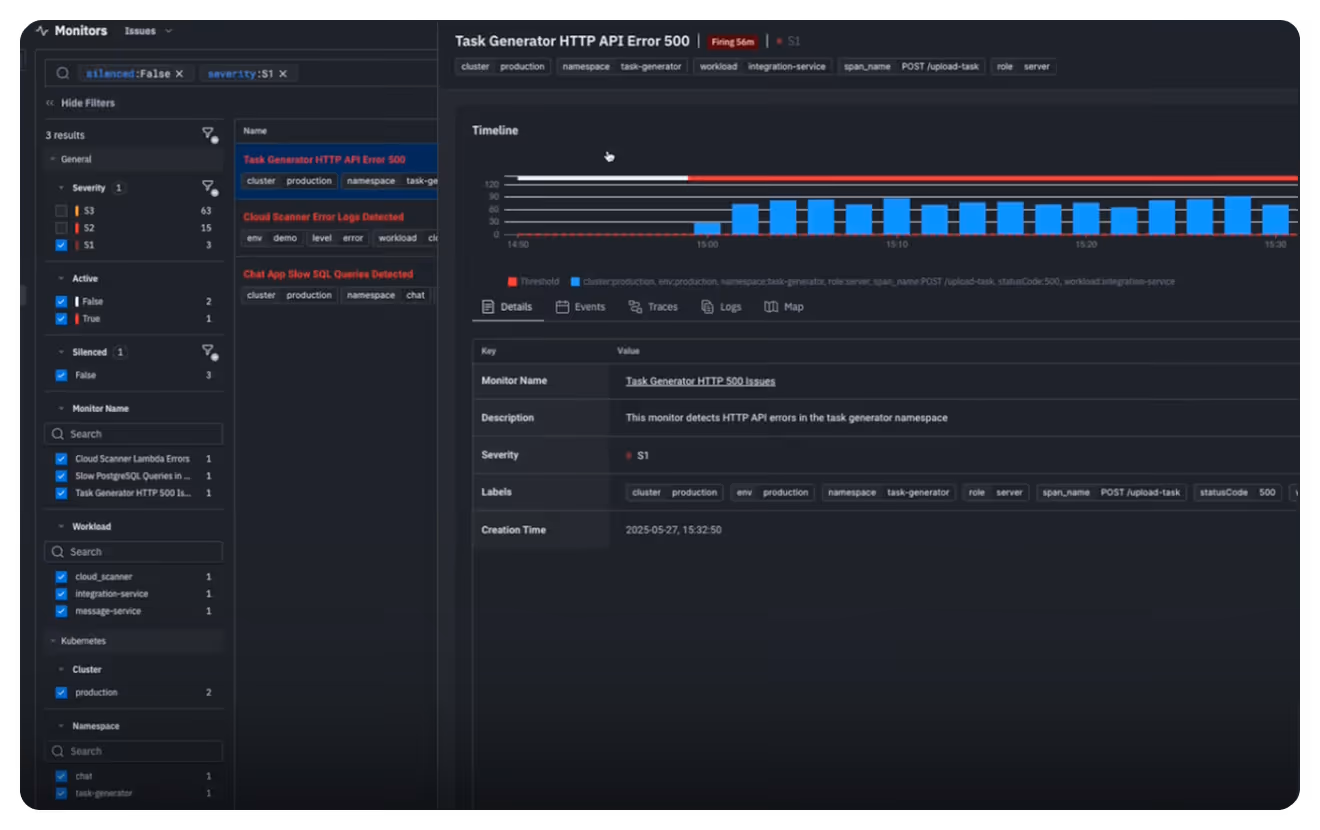
Accelerate incident response with AI

groundcover MCP Server enables your AI assistants to connect the dots across logs, metrics, traces, and infrastructure metadata to spot anomalies, detect subtle trends, and explain the “why” behind incidents. It’s not just an assistant—it’s an always-on observability expert embedded in your workflow. Turn your AI agent into a senior SRE on your team 24/7 — only faster, scalable, and embedded directly into your workflow.

Natural language meets deep telemetry

Observability data isn’t a single stream - it’s a dense mesh of logs, traces, metrics, and infrastructure metadata. Traditionally, making sense of it meant mastering query languages, juggling dashboards, and stitching context across different visualizations and timelines. With groundcover MCP Server, your AI agents surface rich, correlated answers from the full observability stack — using a natural language query prompt. No query syntax. No tab fatigue. Just instant, unified insight.

Real-life use cases

Explore how engineering teams are using groundcover MCP to accelerate their work, troubleshoot faster, and build with confidence, powered by AI-driven observability.
  • Support agent

    Instantly answer customer inquiries with context-aware insights pulled from real-time logs, metrics, and traces. groundcover MCP helps support teams quickly identify root causes and respond with clarity.

  • On-call agent

    When every second counts, MCP acts as your co-pilot. Reduce mean time to resolution (MTTR) with instant anomaly detection, AI-generated summaries of system behavior, and guided investigation paths across your environment.

  • Dev IDE agent

    Get observability baked into your development workflow. MCP provides live feedback on service health, performance regressions, and error traces, right when and where developers need it most, even before code hits staging.

Tooling access to observability

Expose core observability features through reliable, fast APIs:

query_logs
Query logs from groundcover.
Usage
Based on the use case, use patterns (for an aggregated view) or records (for raw lines).
For patterns, use a broad time window and limit the logs number.
For records, use a tight time window and limit the logs number.
Filter fields
envs, clusters, namespaces, workloads, pods, containers, levels, and any Attributes key=value (* wildcards).
Important Notes:
Returned timestamps are in the timezone of the request (the user)
Parameters:
attributes (object): Attributes to filter logs by. Format: key=value. Supports wildcards using ‘’, e.g. key=vaue
clusters (array): The clusters to filter the logs by
containers (array): The containers to filter the logs by
end (string): The end time in RFC3339 format, default is now
envs (array): The environments to filter the logs by
levels (array): The levels to filter the logs by, possible values: critical, fatal, error, warning, info, debug, trace, unknown
limit (integer): The limit of the number of items to return
mode (string): The mode to use for the query (enum: records, patterns)
namespaces (array): The namespaces to filter the logs by
patternId (string): The pattern id to filter the logs by
period (string): The period to filter by in ISO 8601 duration format, default is PT1H
pods (array): The pods to filter the logs by
skip (integer): The number of items to skip for pagination
sortOrder (string): The order to sort by, default is desc (enum: asc, desc)
start (string): The start time in RFC3339 format, default is 1 hour ago
workloads (array): The workloads to filter the logs by
query_traces
Query traces from groundcover. Filter by time, environment, cluster, namespace, workload, pod, container, protocol, status, and source. Sort results and paginate.
Important Notes:
Returned timestamps are in the timezone of the request (the user)
Parameters:
attributes (object): Attributes to filter traces by. Format: key=value. Supports wildcards using ‘’, e.g. key=value
clusters (array): The clusters to filter the traces by
containers (array): The container names to filter the traces by
end (string): The end time in RFC3339 format, default is now
envs (array): The environments to filter the traces by
limit (integer): The limit of the number of items to return
namespaces (array): The namespaces to filter the traces by
order (string): The order to sort by, default is desc (enum: asc, desc)
period (string): The period to filter by in ISO 8601 duration format, default is PT1H
pods (array): The pod names to filter the traces by
protocols (array): The protocols (event types) to filter traces by (e.g. http, redis, mysql, postgres, kafka, grpc, kafka, amqp, graphql, s3, sqs etc.)
roles (array): The roles to filter traces by (e.g. client, server, producer, consumer)
skip (integer): The number of items to skip for pagination
sortBy (string): The field to sort traces by (enum: time, latency, workload, statusCode), default is time
sources (array): The sources to filter traces by (e.g. eBPF, opentelemetry, datadog etc.)
spanIds (array): The span IDs to filter the traces by
spanNames (array): The span names to filter the traces by
start (string): The start time in RFC3339 format, default is 1 hour ago
statusCodes (array): The trace status codes to filter by (e.g. 200, 400, 500)
statuses (array): The trace statuses to filter by (e.g. OK, Error, Unknown, Unset)
subTypes (array): The subtypes to filter traces by (e.g. GET, POST, PUT, DELETE, hget, hset etc.)
traceIds (array): The trace IDs to filter the traces by
workloads (array): The workloads to filter the traces by
query_events
Query events from groundcover, filter by environment, cluster, namespace, instance, workload, object kind, type, category and attributes.
Important Notes:
Returned timestamps are in the timezone of the request (the user)
Parameters:
attributes (object): Attributes to filter events by. Format: key=value. Supports wildcards using ‘’, e.g. key=value
category (string, required): The category to filter the events by (enum: k8s_events, infra, rum)
clusters (array): The clusters to filter the events by
end (string): The end time in RFC3339 format, default is now
envs (array): The environments to filter the events by
instances (array): The instances names to filter the events by, can be the name of object
limit (integer): The limit of the number of items to return
namespaces (array): The namespaces to filter the events by
objectKinds (array): The object kinds to filter the events by
period (string): The period to filter by in ISO 8601 duration format, default is PT1H
skip (integer): The number of items to skip for pagination
sortOrder (string): The order to sort by, default is desc (enum: asc, desc)
start (string): The start time in RFC3339 format, default is 1 hour ago
types (array, required): The type to filter the events by. Values for k8s_events: Normal, Warning.
Values for infra: spec_changed, container_crash, image_update, scale_down, scale_up. Values for rum: dom.event, exception, navigation, pageload, performance, custom workloads (array): The workloads to filter the events by
query_metrics
Query metrics from groundcover with multiple modes:
Modes:
get_names: Get metric names with optional filtering
get_labels: Get label keys for a specific metric
query_range: Execute PromQL range query over time
query_instant: Execute PromQL instant query at a point in time
Usage:
For get_names: Specify time range, optional filter, limit, and required names
For get_labels: Specify time range, metricName, optional filter and limit
For query_range: Specify time range, step, and promql query string, use verified metric names
For query_instant: Specify time range and promql query string, use verified metric names
Important Notes:
Metric descriptions are returned and can be used to understand the meaning of each metric
Native groundcover metrics start with the “groundcover_” prefix. This includes all kube-state-metrics (KSM) metrics
Native groundcover metrics include both a description and a unit
Always use the metric name from the response unless you’re absolutely certain the name you’re using is correct (e.g., if it was received in a previous response)
It’s recommended to retrieve the metric names first to get relevant metrics
Returned timestamps are in UTC
Parameters:
clusters (array): Cluster names to filter by
end (string): The end time in RFC3339 format, default is now
envs (array): Environment names to filter by
filter (string): Filter string for names/labels search
limit (integer): The limit of the number of items to return
metricName (string): The metric name (required for get_labels mode)
mode (string, required): The mode to use for the query (enum: get_names, get_labels, query_range, query_instant)
period (string): The period to filter by in ISO 8601 duration format, default is PT1H
promql (string): PromQL query string (required for query modes)
required (array): Required metric names (for get_names mode)
skip (integer): The number of items to skip for pagination
start (string): The start time in RFC3339 format, default is 1 hour ago
step (string): Step interval for range queries (e.g., ‘1m’, ‘5m’)
query_monitors
Query monitors from groundcover, filter by environment, cluster, namespace, workload, monitor id, status, labels. This tool provides live data.
Parameters:
clusters (array): The clusters to filter the monitors by
envs (array): The environments to filter the monitors by
labels (object): Labels to filter monitors by. Format: key=value. Supports wildcards using ‘’, e.g. key=value
limit (integer): The limit of the number of items to return
monitorIds (array): The monitor ids to filter the monitors by
namespaces (array): The namespaces to filter the monitors by
skip (integer): The number of items to skip for pagination
sortOrder (string): The order to sort by, default is desc (enum: asc, desc)
statuses (array): The statuses to filter the monitors by, possible values: Alerting, Pending, Normal
workloads (array): The workloads to filter the monitors by
get_k8s_infrastructure_list
Get a list of k8s infrastructure items from groundcover, such as nodes, namespaces
Parameters:
clusters (array): The clusters to filter the infrastructure by
nodesNameFilter (string): The name (partial or full) or label value of the nodes to filter the nodes list by
type (string, required): The type of the infrastructure to list (enum: nodes, namespaces)
get_k8s_object_yaml
Get the YAML representation of a Kubernetes object
Parameters:
resourceVersion (string): The resource version of the Kubernetes object, if not provided, the latest will be fetched
uid (string, required): The UID of the Kubernetes object, can be obtained from the infrastructure list tool when needed
query_monitors_issues
Query issues from groundcover, filter by environment, cluster, namespace, workload, monitor id, silenced, labels.
Parameters:
clusters (array): The clusters to filter the issues by
end (string): The end time in RFC3339 format, default is now
envs (array): The environments to filter the issues by
issueId (string): The issue id to filter the issues by, useful for getting the issue details, this is a 16 char string
labels (object): Labels to filter issues by. Format: key=value. Supports wildcards using ‘’, e.g. key=value
limit (integer): The limit of the number of items to return
monitorIds (array): The monitor ids to filter the issues by, this is a UUID of the monitor
namespaces (array): The namespaces to filter the issues by
period (string): The period to filter by in ISO 8601 duration format, default is PT1H
silenced (boolean): Whether to filter the issues by silenced, default is false
skip (integer): The number of items to skip for pagination
sortOrder (string): The order to sort by, default is desc (enum: asc, desc)
start (string): The start time in RFC3339 format, default is 1 hour ago
workloads (array): The workloads to filter the issues by

Ready to rethink 
observability?

Deploy groundcover on your environment in minutes,
or explore it on our data before lighting up your own cluster.