

May 4, 2025
Max Levin • May 04, 2025
Overview of the groundcover eBPF-based APM platform & plans
Q&A about product and any organizational customization needs
30-minute live technical product demo
By submitting this form you agree to our friendly privacy policy.

Monitor everything, deploy in minutes.
Cover your entire Kubernetes stack instantly
with no code changes.
Auto-detect issues across your entire cluster.
See it all. Store what matters. Pay Accordingly.

Discover pprof's capabilities in tackling bugs and memory leaks, with a real-life case study examining its impact on performance.

Reading the term “memory leak” in the title might have brought up some unpleasant memories for some of you. Indeed, this type of bug can cause immense confusion and frustration for even the most experienced developers. This was exactly the case for us at groundcover - but luckily, we ended up not only solving the issue, but also coming up with some new tricks for the future. Did anyone say “pprof”?
Some time ago, we noticed that one of our core services started getting consistent OOM errors during normal operation. Looking at the service’s memory profile showed a textbook memory leak pattern:
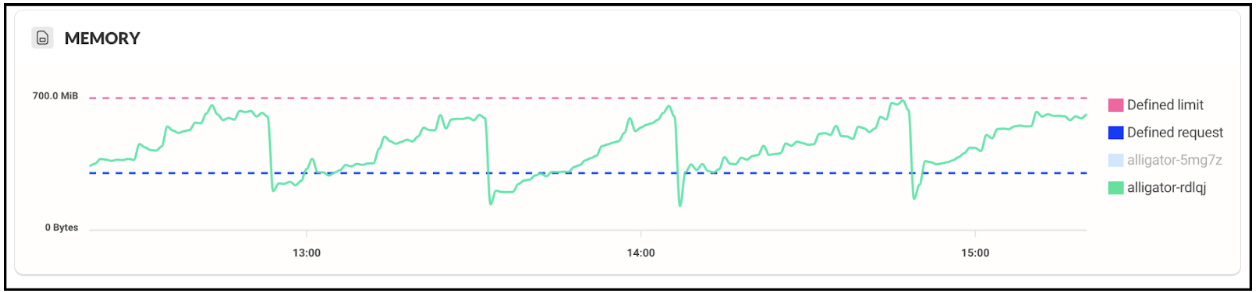
The service starts accumulating memory right from the get-go, growing steadily until reaching the defined memory limits, afterwards it is killed with an OOM error. Bummer.
This is a good time to note that the leaking service is written in pure golang, which uses garbage collection as part of the language runtime. This mechanism takes care of freeing unused memory for us, so in theory it should prevent memory leaks from happening. What’s going on?
From past readings we suspected the issue might have to deal with the runtime not releasing memory back to the OS fast enough - but this was fixed in go 1.16.
With no other leads, it was time to get right into the thick of it - using pprof.
pprof is one of those tools which make you smile, then cry over time wasted not using them, and then smile again. It’s just that good. Available with the golang installation by default, it lets developers easily get extensive profiling data for their applications. This includes CPU and memory usage alongside more complex runtime information. To top everything off, it’s incredibly easy to use, requiring one import in your module and a running web server. That’s it.
Since our problem is a memory one, we figured we should use pprof to check out our service’s memory profile, running the following command:
go tool pprof –-inuse_space http://localhost:6060/debug/pprof/heap
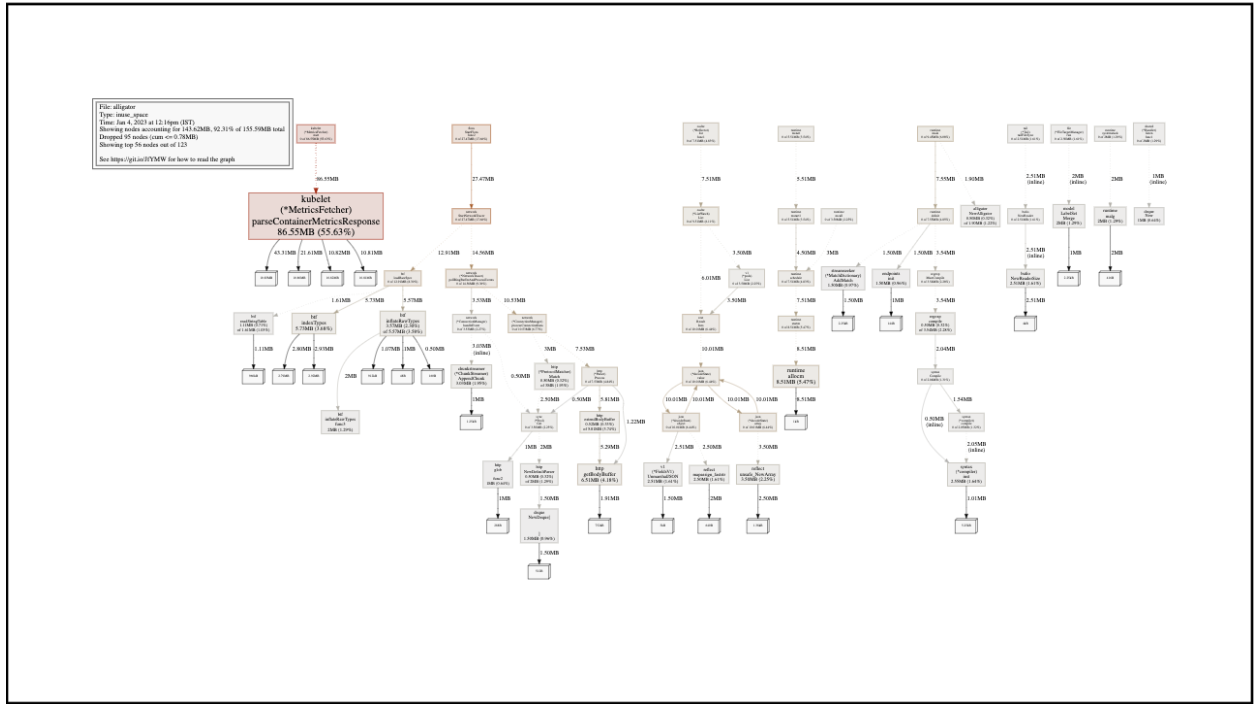
The resulting diagram shows the heap memory which is currently in use by our service. Red, larger blocks mean more memory; gray, smaller ones mean less memory. The name on the block is the function which is responsible for the initial allocation of the memory. Note that this doesn’t mean that function is still using that memory, or that the function is even still running - the allocated object might have been passed around to other functions and goroutines.
Our case looks rather simple, with one block popping out immediately:
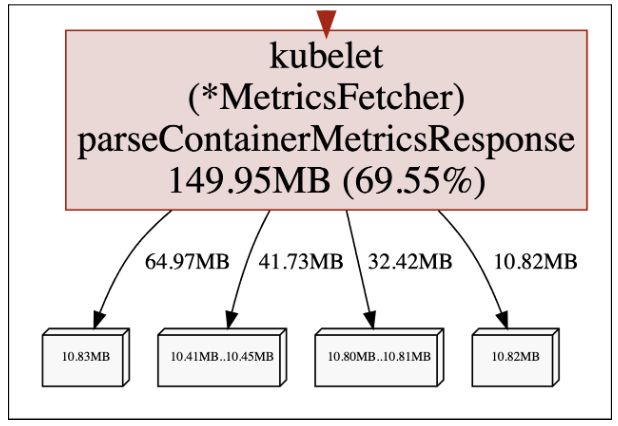
It seems that the MetricsFetcher.parseContainerMetricsResponse function is responsible for the allocation of 55.63% of our current live heap. Knowing our service, this is definitely not intended behavior.
To make sure this isn’t a momentarily memory spike, we checked again after a while:
The in-use memory is growing over time! This is consistent with our memory leak pattern, so it seems we might have found the root cause of our issue. Now what?
The function above is simply a parsing function - it shouldn’t keep so much data alive. While pprof points it out as being responsible for the allocation of the leaky memory, the real question is why is that memory not freed afterwards, by the caller of the function.
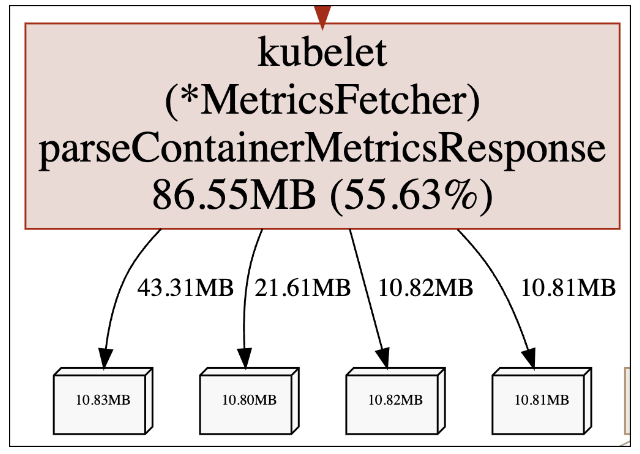
It’s time to use another amazing pprof feature. Looking at the memory profile above, it doesn’t only track where memory was allocated, but also the entire call flow leading to the allocation! In the next part of the series we will delve into how this mind-blowing feature is implemented. For now, let’s take a look at who called the function:
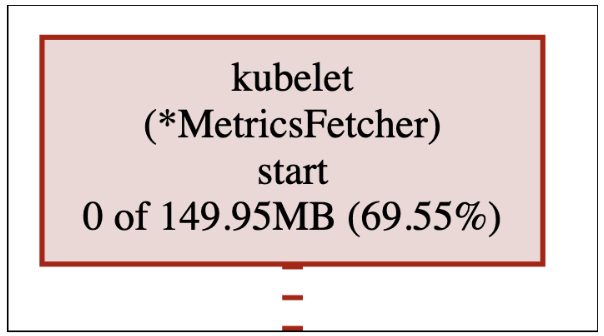
The MetricsFetcher.start starts the call flow which eventually leads to leaking the memory. We can see it generates 0 MB of data itself, but is indirectly accountable for 69.55% of the current live heap - which as we already know, is allocated inside MetricsFetcher.parseContainerMetricsResponse.
To make things even easier for us, let’s use another cool pprof feature that lets us change the graph granularity from functions to lines:
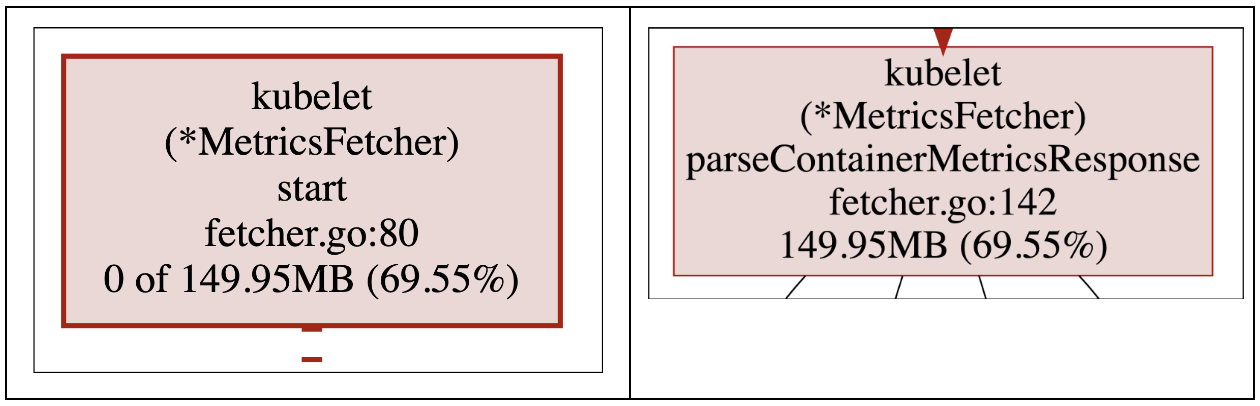
We can now pinpoint the exact lines which eventually lead to allocating the leaky memory - fetcher.go, lines 80 and 142.
Let’s break down the above functions to try and understand what goes wrong. We already know that leaking flow begins here, in line 80:
This function periodically queries our k8s cluster’s kubelets for monitoring data. It makes sense that it generates a lot of memory, since the responses can get very large. But most of that data is of no interest to us - why are we keeping it?
The response bytes are converted to strings at line 142 (2) and then unmarshalled into rows (3). Note that as seen in our memory profile, (2) is the line which causes the leak - the strings generated here are occupying growing memory over time.
For each unmarshalled row we extract the containerId tag, and then try resolving it into container info:
The cgroupResolver.Resolve() fetches container information and also stores the containerId in a local cache for fast lookups:
Some further trial and error made us realize the issue has to do with the resolver caching mechanism - remove it from the flow and the problem disappears. The final proof we needed was achieved by changing (5) to add a fresh copy of the container id instead of the unmarshalled one:
Lo and behold, this change fixed the problem. But why?
Thinking again on our findings, this is actually what pprof was telling us this whole time. We know that the memory being leaked are the replies from kubelet - we’ve seen it on the memory profile. Inspecting our business logic also tells us that the only component storing long-term memory is the cached resolver object. The only explanation is the resolver caching the full replies, and not just the short unmarshalled container ids.
But how is this possible? Step (3) involves unmarshalling the response into lines, a process which usually involves creating copies of the data. Perhaps that is not the case?
The response is unmarshalled into rows using the parser.Rows function. But what library is that exactly? Kubelet reports metrics in Prometheus format, and since all groundcover services are built with performance in mind, we used VictoriaMetrics prometheus parser. One can always count on that talented group of engineers when it comes to efficiency :)
So, the parser takes in the raw prometheus format and converts it into readable tags and values. But how does it actually work?
Prometheus responses can get very large - a classic unmarshalling, which generates copies of the parsed data, can be very expensive. For this reason, the library opts for a much simpler solution - “peeking” into the original data using string slicing, without copying anything.
While this method is very processing efficient, it is somewhat unintuitive. We are used to passing strings around without thinking too much - that’s the power of garbage collection watching our back alongside string immutability. However, it is always important to keep a close eye on what’s going on. In our case, the seemingly small unmarshalled container ID is actually a slice of the large response string. Caching the sliced container ID means caching the entire response - which is an extremely bad idea. As time passes and more responses are read and parsed, we cache more and more of these monstrous strings - ending in OOM demise.
The following diagram demonstrates the bug, with the full responses “locked” in memory as long as the cache is holding the “id” subsets:

Finding bugs in production environments is always difficult, which is why pprof stands out as such an incredible tool. The above example demonstrates some of its powerful functionalities - getting a stack trace of the memory allocation site, or seeing the culprit in line granularity. However, for me, the most amazing part is the fact that profiling is turned on by default in all go runtime environments, so there’s absolutely zero reason not to use it. How is this not impacting performance, you ask? That and more in part 2 of the series. For now - happy profiling!
Keep up with all things cloud-native observability.
We care about data. Check out our privacy policy.

.png)