Node.js Performance Monitoring | Your APM is Bluffing
Learn how to measure event loop lag in Node.js with APM tools. Gain insights on utilizing these tools effectively for enhanced Node.js monitoring strategies.

If you ask a developer for application performance management tips for Node.js apps, there's a nearly 100 percent chance that you'll be told to avoid synchronous work within your app. The reason why is simple enough: Node.js applications have only a single thread, and if you keep that thread busy with synchronous work, your app won't have capacity to handle incoming requests efficiently.
In a perfect world, all Node.js apps would be written to avoid synchronous work from the get-go. In the real world, though, that's obviously not the case. There are plenty of Node.js apps that are not optimized for performance because they have threads that take longer than they ideally would to execute. This results in what's called "blocked" threads, which occur when one client ties up a thread, depriving other clients from accessing it.
The problem from a Node.js application monitoring perspective is that – unless you have access to the source code of your Node.js app and are willing to spend hours poring over it to figure out how the app handles synchronous requests – it's very hard using traditional monitoring tools to know when your Node app is experiencing blocked thread issues.
Fortunately, there's a way to square this circle. It involves monitoring what's known as the event loop, which provides a level of visibility that you don't get from monitoring Node apps in a generic way. By focusing on the event loop, it becomes possible to identify situations where thread blocking issues are the weakest link in a Node app's performance – something that you can't do using APM tools that monitor request latency in a generic way.
To explain why event loop monitoring is the key to effective Node monitoring, let’s walk through the nitty-gritty details of how event loops work in Node apps, why conventional APM tools overlook the event loop and how to gain insight into the event loop in order to supercharge Node performance and application availability.
What is an event loop?
In an application, an event loop is essentially an orchestrator that is responsible for executing code in response to events.
The event loop is central to Node apps because Node.js uses an event-driven architecture. The event loop keeps track of events (like requests from clients), then uses a worker pool to respond to them. It handles both synchronous and asynchronous events – meaning that it's responsible for figuring out how to divvy up resources between events that are occurring in real time and those that initiated in the past but have not yet been fulfilled.
To help perform non-blocking I/O operations, the Node.js event loop can offload operations to the system kernel in many cases. That makes it possible to handle events in the background using a process that looks like this:
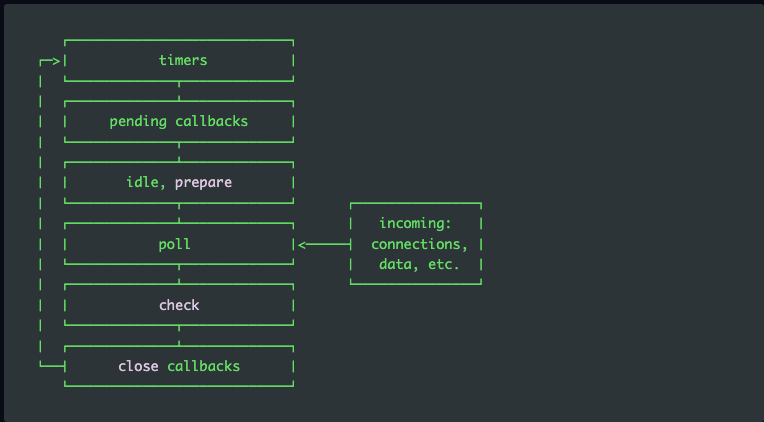
As you can see, there are several discrete steps in this process:
- Timers: Timers execute callbacks scheduled by setTimeout() and setInterval().
- Pending callbacks: Responsible for executing deferred callbacks.
- Idle, prepare: These are used internally.
- Poll: Responsible for identifying new I/O events and executing I/O-related callbacks.
- SetImmediate(): Defines functions to execute right away at the termination of the current event loop.
- Check: Handles the setImmediate() callbacks.
- Close callbacks: Executes callbacks of close events.
We're detailing the components of Node event loops not just so you understand how the event loop works in Node apps, but also because these components are all linked to app metrics that we can monitor – if we're able to monitor the event loop.
The scourge of event loop lag
We'll get into how to monitor event loops in a few moments. First, though, allow us to elaborate a bit more on why monitoring Node event loops is so important.
The reason – as we alluded to in the introduction – is that Node's single-threaded architecture means that synchronous code can dramatically degrade Node application performance metrics. And in most cases, you have no way of knowing whether synchronous code exists within a Node app that you're tasked with monitoring. Conventional Node monitoring tools might tell you that one of the API endpoints of you app is not responding to requests quickly enough in some cases, but they have no idea whether the issue's root cause has to do with synchronous work and an inefficient event loop usage on another API implementation, or a simply an inefficient or buggy implementation of the endpoint in question.
But if you can measure how long it takes the event loop to execute a callback once the callback has been scheduled, then it becomes possible to know whether event loop issues are the root cause of poor Node performance.
That measurement provides insight into what's known as event loop lag. Event loop lags tells you exactly how long it takes to execute a function after it has been scheduled. If synchronous code is slowing down execution, you'll be able to identify it by tracking event loop lag.
By monitoring Node event loop lag on a continuous basis, and configuring alerts to fire when the lag passes a certain threshold (say, 100 milliseconds), you can quickly identify Node performance issues that are linked to synchronous code. In turn, you can update your application or API code to improve Node performance metrics.
That sure beats wasting time trying to get to the root cause of Node performance problems through trial and error or guessing, which is what you'd be left doing if your application performance metrics tools aren't capable of catching event loop lag.
Monitoring Node.js event loop lag
How can you actually monitor event loop lag in Node.js apps? Here's sample code that lets you do it:
That code works by first identifying the current time during the execution phase. Then, it places a timer callback into the callback queue. By tracking when that timer callback executes, we can determine the latency within the event loop based on the difference between when the timer callback was scheduled and when it actually executed. This metric is event loop lag.
In a well-designed app without synchronous code, event loop lag measurement might look like this:
As you can see, this app has very low latency – just single-digit milliseconds. That's great.
But now, let's inject some synchronous code using the readFileSync function (a synchronous function) to block the event loop and see how it impacts the app:
Tracking event loop latency for this app produces results like the following:
Uh oh. As you can see, we have synchronous work that is gunking up our event loop and preventing it from iterating. The result is massive latency spikes in the time our small application took to run. You would probably be wasting lots of time at this point trying to debug a perfectly efficient piece of code that has nothing to do with what’s happening.
Your customers hate synchronous code
Now, if inserting a single function triggers high event loop lag, you can imagine how easily this type of performance issue could be introduced to customer-facing apps or APIs. Just a small amount of bad synchronous code in one place within an app can cause significant performance degradations and undercut the customer experience in many other places by causing your API exposing microservice written in Node.js to delay its response time.
Why your APM (probably) doesn't measure event loops
It would be wonderful if application performance metrics tools could catch these types of issues and alert you to them so you could update your app and save your customer experience.
But sadly, most Node.js monitoring tools don't do this because they run inside the context of the application itself. They are consequently not "aware" of the event loop. As a result, when you see spikes in latency for certain requests, your gut reaction is probably to assume that the issue involves a specific API involving those requests, rather than being a problem that is systematic to the app. As we've seen, though, that's not necessarily the case. There could be synchronous code holding up your event loop.
But your APM tools won't know this, so they mislead you into believing that performance degradation is caused by your API, not synchronous code.
What about profiling?
If you're an experienced Node developer, you might be thinking: "OK, my APM can't measure the event loop, but I can always use profiling to figure out what's happening inside my app." That's a fair-enough point. Profiling does allow you to sample the stack and generate flamegraphs in order to pinpoint the causes of performance issues related to synchronous code.
The problem with profiling, though, is that it's not something you'd typically do on a proactive and continuous basis. Instead, you usually turn to profiling when you've already noticed a performance degradation in your app. The damage is already done at that point.
If you want to get ahead of performance issues that will negatively impact your users, you need to know about event loop problems as soon as they start occurring, which means you need a way of baking event loop monitoring into your Node.js APM strategy. After-the-fact profiling just doesn't cut it.
Thinking beyond CPU utilization
The key takeaway from all of the above is that app metrics like CPU utilization aren't enough for managing the performance of Node.js apps and ensuring that they can scale. If you look at surface-level CPU usage alone, it's impossible to detect issues, like inefficient garbage collection, that jam up the thread pool and can increase CPU usage in ways you probably wouldn't expect.
That's why it's critical to monitor not just CPU, but also ELU – meaning event loop utilization. When you know what's happening in your event loop, you know what's happening in your app.
That's not to say that monitoring CPU isn't important. It is, of course, because there are plenty of performance-related issues – such as maxing out available hardware resources – that aren't linked to ELU, but that become apparent from tracking CPU. But the only way to tell the difference between those types of CPU problems and issues that are specific to the event loop is to gather latency metrics on a per-thread basis and compare them with CPU metrics.
Node.js monitoring tools for ELU tracking
Above, we showed a primitive way of monitoring the event loop inside Node using printouts from inside the code. But you can also take advantage of tools like Nodejs-dashboard, which provides continuous ELU measurement and visualizations:

A smarter approach to Node.js APM
The bottom line: Your APM tools might tell you that they're tracking Node.js latency, but they're probably not – at least not in a specific, actionable way. They're probably only measuring raw response rates and CPU utilization metrics, which are not enough on their own to pinpoint the source of performance problems that originate within the event loop.
The good news is that it's totally possible to measure event loop lag and utilization. As we've shown above, the tools are there; it's just a matter of making sure you're putting them to use as part of your Node.js monitoring strategy.
Explore related posts
.jpg)
.jpg)
Sign up for Updates
Keep up with all things cloud-native observability.
We care about data. Check out our privacy policy.
Get started
with groundcover
Monitor everything, deploy in minutes.
See the platform in action
Book an on-demand demo with a customer engineer
100% visibility all the time.
Cover your entire Kubernetes stack instantly
with no code changes.
Troubleshoot like a pro.
Auto-detect issues across your entire cluster.
Reduce data & growth costs, dramatically.
See it all. Store what matters. Pay Accordingly.

Done!
Book a demo
Meet the groundcover team for a 30 minute live session
Explore how groundcover provides instant, out of the box insights across logs, traces, metrics, and more.
Get a walkthrough of the platform, pricing model, and real world use cases tailored to modern observability challenges.
Ask anything- our team will address your specific stack, scale, and deployment needs.


By submitting this form you agree to our friendly privacy policy.

.svg)