Fluent Bit vs Fluentd: Key Differences & How They Work Together


Managing logs across distributed infrastructure means dealing with multiple data sources, growing volume, and pipeline tools that need to stay reliable under that pressure. Fluent Bit and Fluentd are built for this job, but each one handles a different part of the logging pipeline.
In this article, you'll learn the key differences between them, when each one is best suited to your deployment, and how they work together in production pipelines.
What Is Fluentd?
Fluentd is an open-source log collector built to unify the logging layer across distributed infrastructure. It collects events from multiple data sources, normalizes them into structured records, and routes them to one or more destinations. Each event moves through a structured pipeline in which it is parsed, filtered, buffered, and sent to the output. Each stage is independently configurable, which makes it useful for pipelines that need parsing, enrichment, and routing in a single layer.
Fluentd works best as a central aggregation tier. When logs arrive from Kubernetes workloads, virtual machines (VMs), syslog appliances, and custom app files, it can normalize and route them all without requiring changes to how each source emits data. It has 500+ community plugins covering dozens of sources and destinations, so most integration requirements already have an existing plugin.
What Is Fluent Bit?
Fluent Bit is a lightweight, open-source telemetry agent built for log collection in resource-constrained environments. It collects log data from multiple sources, parses and filters it, and forwards it to a configured destination. Unlike Fluentd, its built-in plugins ship as a single binary with no external runtime dependencies, making it easy to deploy on almost any host.
Fluent Bit is commonly deployed as a node-level collector. In Kubernetes, it runs as a DaemonSet on every node, collecting container logs as they're written, enriching them with metadata such as namespace, pod name, and container name, and then forwarding them to a backend or aggregation tier.
Fluent Bit vs Fluentd: Key Differences at a Glance
Fluent Bit and Fluentd belong to the same ecosystem, but they target different parts of the pipeline. The comparison below shows where they differ.
The tradeoff comes down to resource use, pipeline complexity, and where processing needs to happen.
When to Choose Fluent Bit vs Fluentd in Real-World Deployments
The choice between Fluent Bit and Fluentd depends less on features in isolation and more on where each one sits in your pipeline. In most deployments, the real decision is whether you need lightweight collection, centralized processing, or both.
In Kubernetes and Cloud-Native Environments
Kubernetes generates logs from every container on every node. You need something to collect those logs without adding pressure to the nodes themselves. Deploy Fluent Bit as a DaemonSet for node-level collection, then deploy Fluentd as the aggregation layer to handle routing after collection. If logs need to go to long-term storage, an alerting pipeline, and an archive simultaneously, Fluentd handles that routing while Fluent Bit stays on collection duty across every node.
For High-Volume Log Aggregation Pipelines
If your pipeline is ingesting logs at high volume from multiple sources, use Fluentd at the aggregation layer. It supports both memory and file-backed buffering. Configure file buffering explicitly for production deployments, as it queues logs to disk so a backend outage doesn't cause data loss, and Fluentd retries failed deliveries up to the configured retry limit.
It also supports an active and backup aggregator setup, so if the primary goes down, forwarders switch to the backup automatically. Keep Fluent Bit at the collection layer and let Fluentd handle the aggregation, buffering, and routing work where delivery guarantees matter.
For Lightweight and Edge Deployments
Embedded Linux systems, IoT gateways, branch hardware, and similar setups often have limited CPU and memory, so running a Ruby runtime adds more overhead than the environment can support. Use Fluent Bit in these cases. It ships as a single static binary with no external dependencies, which makes it easy to deploy on almost any resource-constrained host.
Based on Resource Efficiency and Cost
Resource overhead adds up at scale. A heavier runtime on two or three central aggregator nodes is manageable. Running it on hundreds of nodes adds up in memory and infrastructure costs. Deploy Fluent Bit at the node or edge level to keep collection overhead low, and run Fluentd centrally where the processing and routing complexity justifies the resource cost.
That keeps your per-node memory low and your central aggregation tier capable of handling the routing work without resource pressure.
Fluent Bit and Fluentd: How They Work Together in Hybrid Architectures
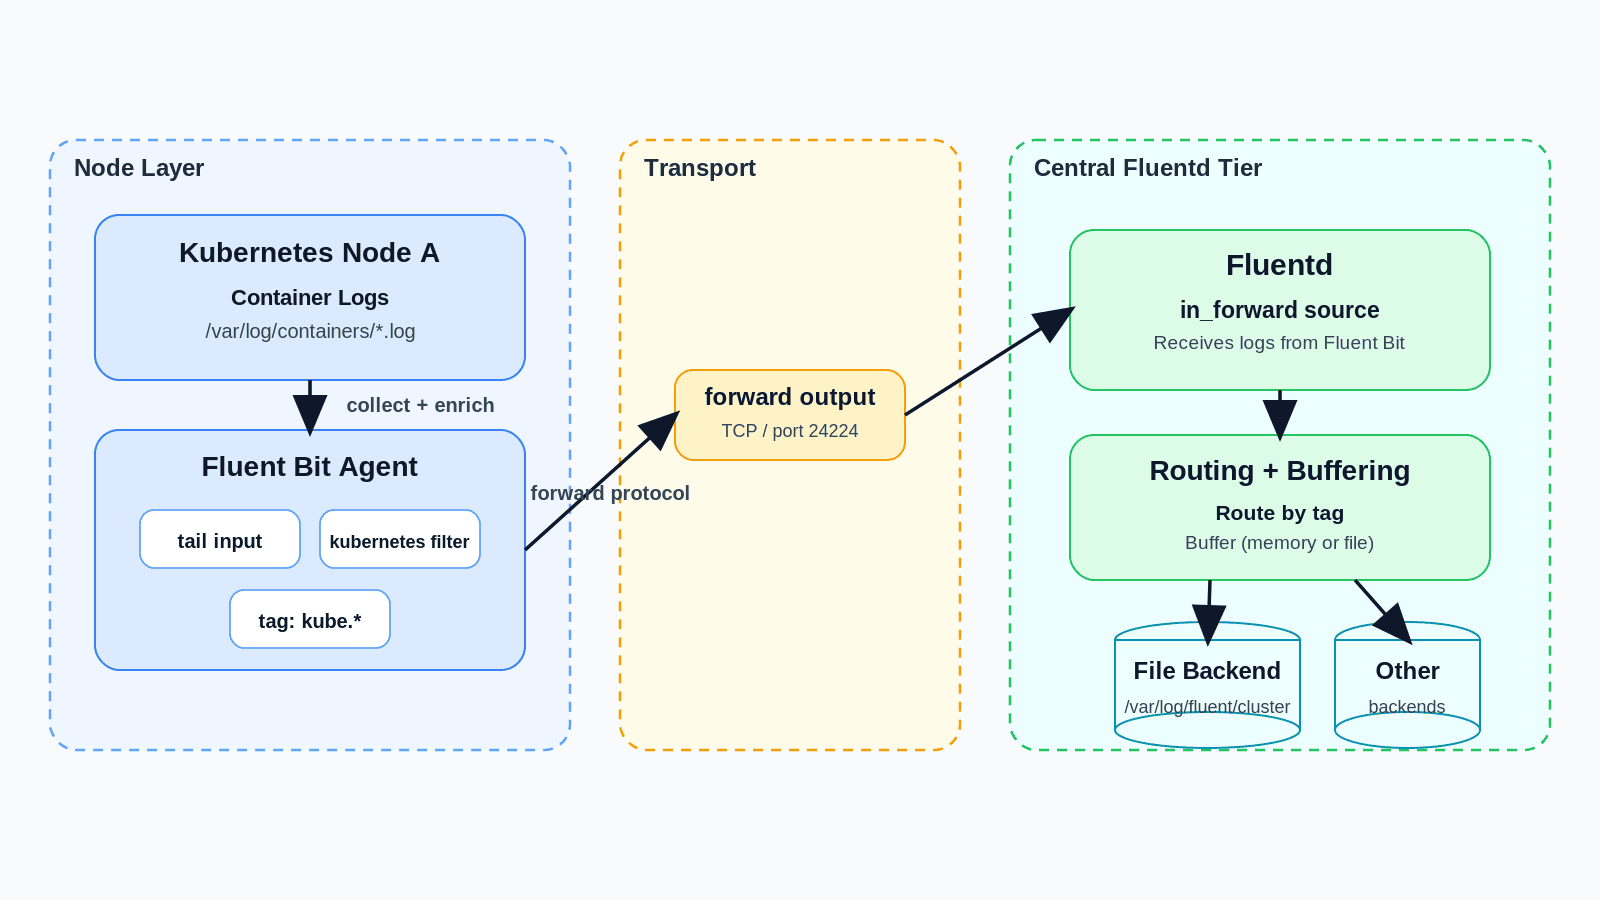
The typical setup runs Fluent Bit on every node to collect and enrich logs, then forwards them to a central Fluentd tier using the `forward` protocol. Fluentd receives those logs, applies routing rules, buffers them, and sends them to one or more backends. Both tools are built to work this way.
Fluent Bit has a `forward` output plugin specifically for sending to Fluentd, and Fluentd has a `forward` input plugin for receiving from Fluent Bit.
Here's what that chain looks like in config:
Fluent Bit:
Fluentd:
Fluent Bit collects container logs and enriches them with Kubernetes metadata, then sends them over TCP to Fluentd running in the same cluster. Fluentd receives the logs through `in_forward` and writes them to a file backend with disk-backed buffering. In production, the `<match>` block routes by tag to multiple backends depending on log type and destination.
When a Hybrid Setup Is Worth It
Use both tools when your pipeline has complexity that a single agent can't handle. If you have many nodes each needing lightweight collection, multiple log types going to different destinations, or routing rules that vary by environment, running Fluent Bit at the collection layer and Fluentd at the aggregation layer gives you that separation.
For example, a SaaS company running dev, staging, and production clusters can run Fluent Bit on every node across all three, with logs flowing into a central Fluentd tier that applies per-environment routing and buffers to disk during backend issues. If your setup is a small cluster sending logs to a single destination with no routing requirements, Fluent Bit alone forwarding directly to that backend is enough.
Unified Observability Beyond Fluent Bit vs Fluentd with groundcover
Fluent Bit and Fluentd handle log collection and routing well. But when an incident hits, correlating those logs with traces, metrics, and Kubernetes events across separate systems is hard and time-consuming. At that point, the question is no longer which log collector to run. It’s how you correlate what those tools collect with the rest of your telemetry, and that’s what groundcover handles.
Automatic Log Collection for Kubernetes Workloads
groundcover's eBPF sensor deploys as a DaemonSet and captures logs, metrics, and traces from every workload running on your nodes at the kernel level. For Kubernetes workloads writing to stdout, that means logs are collected automatically with no extra setup, no code changes, and no additional agents to manage.
Ingesting Logs From Fluent Bit and Fluentd
If your logs are stored in files, either inside or outside Kubernetes, use Fluent Bit to ship them into groundcover. If logs are already flowing through a Fluentd aggregation tier, keep Fluentd in place and route logs into groundcover using its HTTP output plugin. Your existing collection infrastructure stays intact.
Correlated Logs, Traces, Metrics, and Kubernetes Events
Because the same eBPF sensor collects logs, traces, metrics, and Kubernetes events, everything is correlated automatically. When you see a latency spike in a service's traces, the relevant logs and infrastructure metrics are already in the same view. You're not joining data across separate tools or matching timestamps manually. That means when an incident happens, the investigation starts with full context already in place rather than piecing it together across multiple tools.
Your Observability Data Stays in Your Environment
groundcover's BYOC (Bring Your Own Cloud) architecture runs the observability backend inside your cloud. Your logs, traces, metrics, and Kubernetes events stay in your VPC, in regions you control. You own the storage and the data without owning the complexity of running the collection and query layer yourself. For teams with data residency or compliance requirements, groundcover also supports on-premises and air-gapped deployment models.
Conclusion
Fluent Bit and Fluentd are not competing tools. Fluent Bit keeps collection lightweight at the node and edge level while Fluentd handles routing, buffering, and more complex processing at the aggregation layer.
Beyond collection and routing, you still need to correlate logs with traces, metrics, and Kubernetes events during incident investigation. groundcover adds that observability layer by bringing those signals together in one place, correlating them automatically, and keeping the data inside your own environment.


.svg)