From a Trace Straight into Session Replay: What's New in groundcover RUM
Navigate from a client-side trace straight into the matching RUM session, replay the user's experience alongside the telemetry, and triage sessions faster in groundcover.
RUM has been one of the areas we've invested in heavily, and for good reason. It's a capability that's been requested by a ton of customers and prospects alike. The big rollout was session replay: the ability to recreate a user's actual experience in the browser, right inside the application. That's been a big hit. But since it landed, we haven't let our foot off the gas. The team has shipped a round of improvements that make the whole feature set more intuitive and the experience a lot friendlier.
Let me shed a little more color on what's new, starting with the piece I think changes how you actually debug front-end issues.
Go from a trace directly into the matching user session
This is the one I keep coming back to. You can now navigate seamlessly from Traces straight into the matching RUM session.
Here's how it plays out. You're on the traces page and you come to a trace that starts on the client side. You'll see all of your embedded, propagated traces exactly as you typically would. Because client-side traces from the browser are automatically correlated with the server-side traces from your OTel instrumentation, you're looking at one distributed trace that spans the browser all the way to the backend. What's unique now is that if you've got a RUM span in there, you can open it directly into the matching user session. No jumping between tools, no hunting for the right session by hand.
.png)
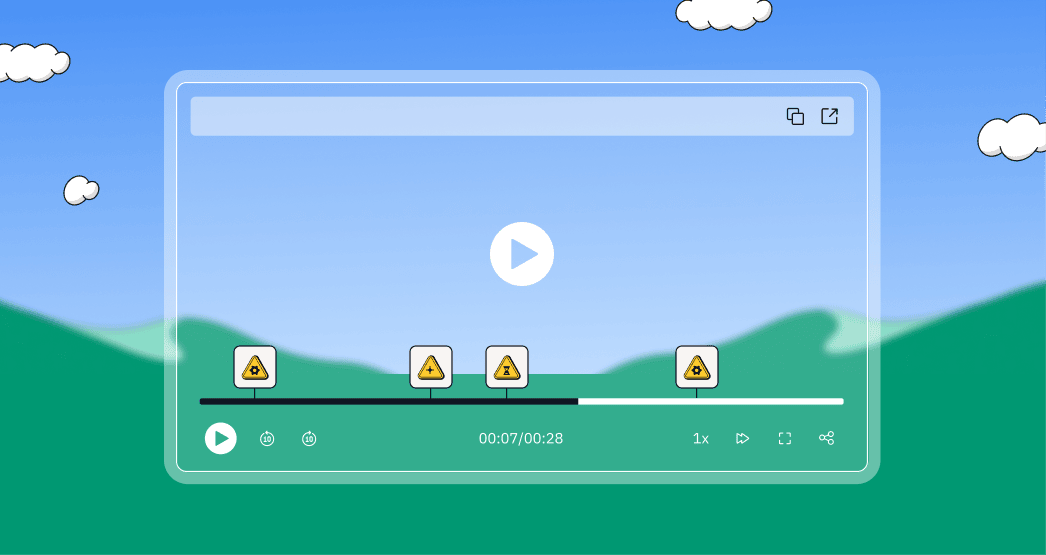
A couple of things worth pointing out. First, you don't lose your place on your trace window. Opening the session creates a duplicate window, so your investigation stays intact. Second, the session kicks off immediately. Session replay is what you're visualizing on the right: the recreation of the actual user experience in the browser. So in a couple of clicks you've gone from "this trace looks off" to literally watching what the user did. The path from a symptom to the exact moment it broke is faster than it's ever been.
A replay that's tied to the telemetry
Once you're in the session, the replay isn't just a video off to the side. It's interleaved with the underlying telemetry. You get the UI playback alongside everything the system recorded: page loads, network requests with their status codes, clicks down to the individual element, custom events, and logs. That's what makes it possible to line up "what the user saw" with "what actually happened" at each step.
We've also made the timeline a lot easier to read. You can now collapse the individual events, like user page interactions, page loads, and clicks, which makes it much easier to follow the hierarchy of what happened and the overall user journey instead of scrolling through a flat wall of events.
.png)
Each of those events is represented directly on the session timeline. So if you want to natively jump into, say, an exception or an error, you can do so and it'll kick off right at the relevant timestamp in the replay. You're taken straight to the moment it happened and you can watch it play out. And when you land on an error or a custom event, you can now expand the metadata about that particular occurrence directly within the timeline: timestamps, URLs, stack traces, all of it right where you need it, which is really nice. Taking these events and surfacing them on the individual session is what makes the whole navigation process feel intuitive rather than like detective work.
.png)
Triage sessions faster
Before you even open a session, the redesigned session summary tables now surface more of the signals you actually care about up front: who the user is, their device and browser, when the session happened, and how long it lasted. Pair that with richer sorting and you can scan and prioritize the sessions worth investigating instead of opening them one at a time. We also improved session search with better default search keys, including user properties and session metadata, so getting to the right session is quicker.
And because the grids are dynamic and user-specific, a popular ask from a number of customers that brings RUM in line with the rest of the application, you can add the columns that matter to you and shape the view around how your team actually works.
What's coming next
This area is moving quickly, and there's a lot more on the truck soon:
- PII configuration. The ability to obfuscate personal and sensitive data from the client side. And remember, because groundcover runs in your own cloud (BYOC), RUM data never leaves your environment to begin with. This just gives you finer control on top of that.
- Mobile native RUM. This is going to be massive for teams running mobile applications. It's a dedicated focus and we're targeting Q3.
- Custom attributes on logs. A new logging API that lets you output logs with custom attributes and obscure them from the console window, a big ask that's already landed for some teams.
Alongside all of that, we're continuing to push on legibility and general aesthetic: how you interact with the feature and how the data is presented back to you. And now that agent mode is in place, a lot of really interesting doors open up around what we can do with this RUM data. More to come, and I'm genuinely excited about where it's heading.
If you haven't navigated from a client-side trace into a RUM session yet, give it a try. I think it's the fastest path we've ever offered from a symptom to the actual user experience behind it.
.png)

.jpg)


.svg)