Kubernetes Health Checks & Probes: What you Need to Know
Explore Kubernetes health checks with our comprehensive guide. Understand the challenges and how to enhance health checks with advanced observability solutions.


Last Updated: May 22, 2026
You may know that "Kubernetes" is derived from a Greek word meaning "helmsman." The implication there is that Kubernetes is like the person responsible for steering a ship – and the ship, we suppose, is analogous in this context to a cluster of nodes and Pods.
But here's another metaphor for Kubernetes that is arguably more apt: Kubernetes is like a doctor. Why, you ask? Because performing health check probes – like readiness probes, liveness probes, and startup probes – is one of Kubernetes's main jobs.
Indeed, probing containers to figure out whether they're "live," "ready" or "started" is something that Kubernetes does constantly. Without these health check probes, Kubernetes would have no way of knowing whether all of the applications in a cluster are operating properly.
Now, we're not saying that we should rename Kubernetes "iatros," which is the ancient Greek term for doctor. But we are saying that understanding how health check probes work in Kubernetes is critical for anyone who wants to administer a cluster effectively. Keep reading for guidance on this topic as we unpack everything you need to know about Kubernetes health checks.
What are Kubernetes Health Checks?
In Kubernetes, health checks are actions that the Kubernetes control plane carries out to check on the status of applications. The checks are known as "probes" because they're akin to probing an application to determine whether it's performing as expected.
To be clear, a health check is not a full-scale performance evaluation. Health checks don't measure metrics like application latency or load. Instead, they function as quick verifications to determine if an application is experiencing certain types of problems, like failure to start up successfully.
So, think of Kubernetes health checks as akin to a doctor tapping a patient's knee to make sure it bounces back as expected, or (to use a slightly morose example) checking that someone in a coma is in fact still alive. They don't provide the detailed health information that a doctor would get by performing a complete physical, but they do provide a fast and simple means of checking for major problems.
How Does Kubernetes Perform Health Checks?
Kubernetes completes health checks in a straightforward way: It performs a simple action and checks how a container responds to the action.
The actions that Kubernetes performs can vary to check health (and we'll dive into details and specific examples below). But typically, they are operations like checking whether a specified file exists within a container or whether a container responds to requests on a specific port.
It's worth noting that Kubernetes has no special built-in logic for performing health checks. You can define parameters for performing probes when you configure a container, but you have to specify how to perform the actual probe. In other words, you have to tell Kubernetes which command to run or which port to check to verify that an application is live, ready, or started. It doesn't automatically configure those settings itself.
The point we're getting at here is that health checks in Kubernetes are more complicated than simply telling Kubernetes "please check my app's health." Kubernetes will perform checks that you configure, but it's on you to tell Kubernetes exactly how to perform the checks. (Maybe that makes it a bad doctor because doctors don't usually ask their patients for guidance on how to check their health, but we digress.)
Why are Probes Important?
Probes are important in Kubernetes because they are an efficient way of monitoring application health and verifying that an application is operational and stable.
There are many other ways that you could collect this information. You could deploy observability software to monitor your application continuously and report if it stops responding. You could also monitor processes at the node level to check for issues like containers that keep restarting, although probes help with restarting failed containers and recovering from failed containers. And you could assess logs (if your app produces them) to look for application issues.
However, these Kubernetes monitoring methods are more complicated, and require more effort to manage, than Kubernetes probes. Observability tools are useful if you want detailed information about an application. But if you just want quick feedback about an application's status, a probe is the easiest and most efficient way to get it.
Types of Kubernetes Probes
Kubernetes supports liveness, readiness, and startup probes. Kubernetes uses multiple probes because liveness and readiness probes solve different problems at different stages, including application startup.
The table below summarizes readiness and liveness probes along with the startup probe, and shows how liveness and readiness checks differ in practice.
Liveness Probes
A liveness probe checks whether the target container is running – or “live,” in other words. If the app is unhealthy, Kubernetes can detect it and help with restarting failed containers.
Liveness probes are useful because they can detect instances where an application is constantly restarting, in which case it would not always be running. This typically happens due to buggy code or misconfigured containers that cause an application to crash repeatedly.
Careful tuning can help avoid false positives, including choosing sensible probe intervals and appropriate timeouts to reduce false positives.
Importantly, liveness probes don’t verify whether the app is actually fully up and running and able to handle requests. (That’s the purpose of startup and readiness probes, which we’ll discuss in a moment.) Liveness probes simply check that an app is “live” in any state.
Readiness Probes
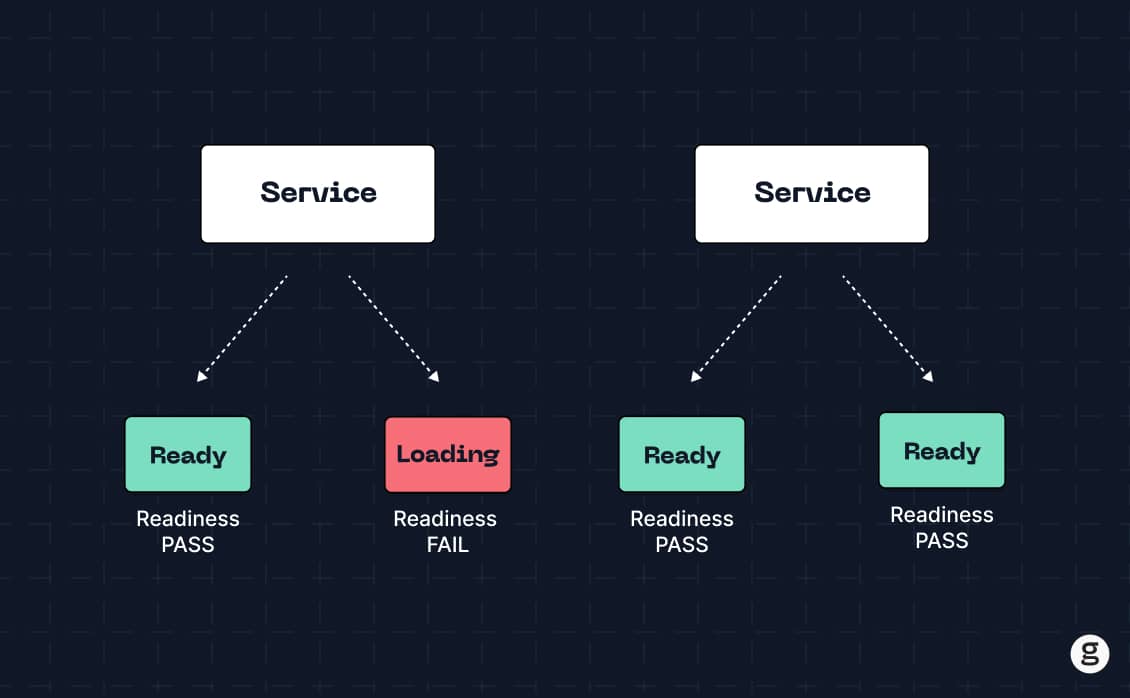
A readiness probe checks whether an application is ready by verifying that its containers can receive traffic.
Readiness probes are useful for detecting apps that have started and are not crashing, but are not actually operating normally. In other words, the application’s processes might be up, but the app itself can’t respond to requests due to issues like a buggy network configuration. When readiness checks fail, kubernetes stops sending traffic to that Pod. This failing readiness state also affects load balancing and can leave a Pod running but unable to serve traffic. They’re especially important during application startup.
Startup Probes
Startup probes check whether slow starting containers have successfully initialized. This is also a means of verifying that an application is fully up and running.
Thus, startup checks serve a similar purpose to readiness probes – ensuring that an app is fully functional. However, startup probes and readiness probes check different information to make this determination. Such a probe gives a container extra time to finish initialization before liveness checks take over. Once the startup probe succeeds, normal liveness and readiness behavior can begin. A startup check evaluates the internal status of a Pod’s containers, whereas a readiness probe checks whether containers can receive traffic.
This means that startup probes are useful in situations where a container is able to receive traffic because it is successfully connected to the network, but is still not fully initialized for some reason (such as internal code bugs).
How to Perform Kubernetes Health Checks
There are three main ways to go about performing health checks: HTTP requests, direct commands, and TCP connections. There are also two ways to perform each type of health check: The "informal" method, which involves running some commands on the CLI, and the "formal" method, which means configuring a complete health check in Kubernetes.
HTTP Requests
To perform a quick, “informal” health check via HTTP, use a tool like curl to connect to the service that you want to assess, much like http probes do. For example:
You then evaluate the response. If the service is running as expected, you’ll receive an HTTP status code like 200, and healthy checks usually fall in the 200–399 range.
To set up a formal HTTP health check, you’d define the parameters when configuring the container you want to check. For example:
This tells Kubernetes to perform a liveness check at the specified URL on port 8080.
HTTP requests are handy because you can run them from any location that has connectivity to your service; you don’t necessarily have to be inside the Kubernetes cluster. However, you do need to make sure that the application you’re checking is available as a service in Kubernetes and is properly exposed to the network.
Commands
You can also perform a health check probe in Kubernetes using exec probes, which run commands directly inside a container.
The simple, informal way to do this is to log into the container once it’s running, and then run a command that generates feedback about the container's state. The command can be quite simple; anything that generates output will suffice for a simple health check. For example, you could run the following command:
If the container is running normally, you'll receive the following output:
hey
If you don't see this, it's a sign that something is wrong with your container.
To run a formal health check probe using a command probe, specify the command you want to run within your container’s spec when configuring the container. For example:
In this example (which we borrowed from the Kubernetes documentation), we’re telling Kubernetes to check whether the file /tmp/healthy exists on the container. Kubernetes initially waits five seconds after the container starts to perform the check, then repeats the check every five seconds thereafter. Kubernetes treats an exit status code of 0 as healthy, and this approach can also verify internal conditions such as memory usage when no endpoint is available.
For this command to generate useful feedback, we need the file /tmp/healthy to exist inside the container – so we'd want to be sure that that file is created when the container starts, which we can do using a simple command line touch /tmp/healthy. That way, if the liveness probe tells us the file doesn't exist, we know something went wrong when the container started.
You could also simply include the file in the container's file system, but that would make the check less useful because you wouldn't be checking that the container successfully executed startup commands. You'd only be checking that a file built into the container by default exists. In that case, the liveness probe might report that the container is live even if it has not successfully run all startup commands.
TCP Connections
tcp probes verify container health by attempting a tcp connection to a specified port. This is useful if you want to make sure that containers are able to receive network traffic.
If the container you want to check is available as a service in Kubernetes, you can perform a simple TCP check using a telnet command like the following:
This checks whether a service is reachable at the IP address 1.2.3.4 on port 8080.
If your containers aren’t available as a service that is reachable from the network, you can configure probes using TCP connections within the container spec section of a container you want to monitor. The configuration would look similar to:
This tells Kubernetes to perform a readiness probe on the container using port 8080, and you can configure a tcp liveness probe as a variation for the same kind of port check.
These checks are useful when no HTTP endpoint is available, and grpc probes extend the same basic connectivity idea with application-level checks, including a grpc liveness probe for gRPC services.
Health Check Parameters
When performing a formal health check in Kubernetes, you typically specify four key parameters:
- Action: The action parameter tells Kubernetes what to do to carry out a check – such as running a specific command or issuing an HTTP request to a designated path and port.
- Delay: The initial delay controls how long Kubernetes waits before the first probe runs, which is useful when a container needs time to become fully operational before checking its health.
- Interval: Probe intervals determine how frequently Kubernetes performs additional checks after the first one. You can’t check health continuously, but you can check every few seconds.
- Timeout: This sets how long Kubernetes should wait for a response to a probe, so configuring appropriate timeouts helps avoid reporting failures too quickly or waiting unnecessarily long.
There are no hard-and-fast rules about how to configure these parameters, and different applications will require different settings. You'll want to weigh factors like:
- How long it takes your containers to start: A container that starts in just a few seconds needs a startup delay of just a few seconds, whereas some containers may take much longer to start.
- How often you want to check on health: Applications that are prone to failure may need to be checked every few seconds, but your check interval for other apps could be several minutes.
- How much load the check places on your app: Most health checks don’t consume many resources. But if you run a large volume of checks frequently, their resource consumption can add up to place a burdensome load on your cluster. Choosing these settings carefully helps the first probe happen at the right time and keeps unnecessary resource usage from depriving your apps of the CPU, memory, or networking resources they need for normal operations.
Common Kubernetes Health Check Challenges
Although health checks are a valuable way of getting quick feedback about application status, they are subject to several distinct challenges and drawbacks:
- Limited scope: As we emphasized above, health checks provide only very basic information about an application's status. They are not a substitute for the more detailed performance data you'd get from observability tools.
- Lack of diagnostic data: Along similar lines, health checks can tell you that something is wrong, but not why it's wrong. You'll need other data sources (like logs and traces) for Kubernetes troubleshooting. For example, if a readiness probe fails, you'll probably want to look at networking configuration data to determine why the container won't respond to traffic.
- Misleading results: Depending on how you configure a health check, it could generate information that is misleading. For example, as we mentioned above, if you check to see whether a file exists but the file is built into a container's image by default, a successful check doesn't tell you much. Your container might have problems but still pass the check.
- Resource overhead: Again, running checks consumes resources. They are typically minimal, but can add up and impact application performance if you run many checks frequently.
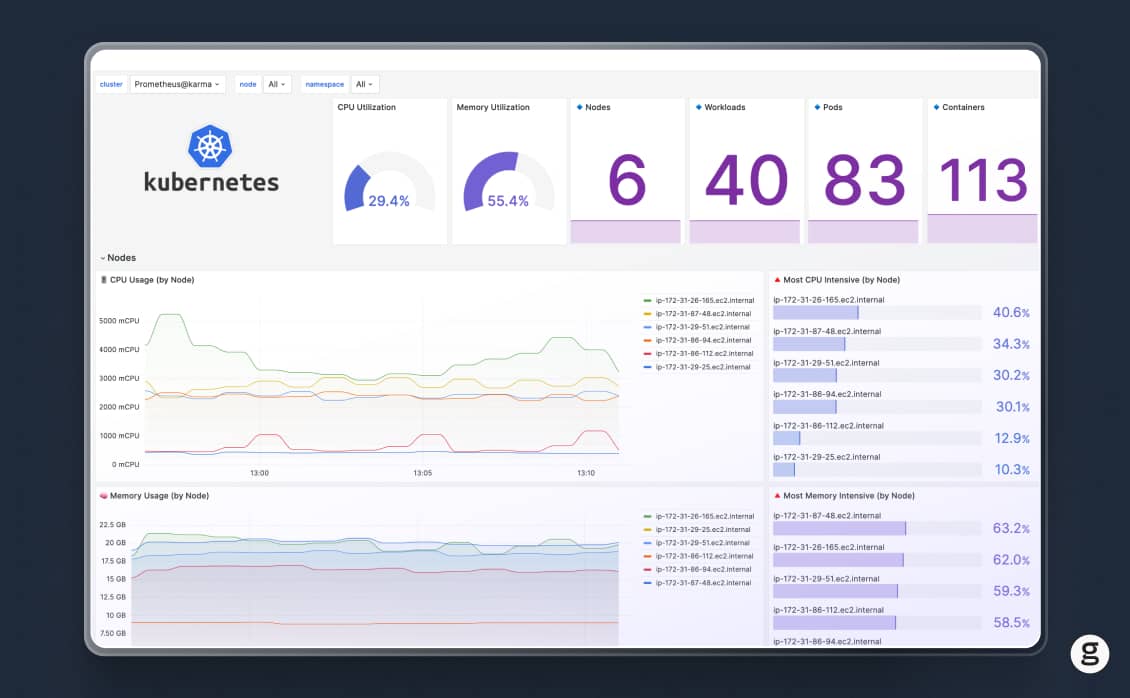
Monitoring Kubernetes Health with groundcover
At groundcover, we think Kubernetes health checks are great when used for their intended purpose: Gaining a quick and simple look at the status of an application.
But we also know that health checks are hardly sufficient for managing all Kubernetes performance and availability challenges – which is why we think it’s worth complementing health checks with a full-fledged Kubernetes observability solution, like groundcover. It provides the deep visibility into containers, Pods, nodes, and clusters that you need to ensure your applications are running healthfully at all times.
So, by all means, go and set up Kubernetes health check probes as a first line of defense against performance issues. But remember also to deploy a comprehensive observability solution.


.svg)