eBPF: How Kernel Programming Escaped the Kernel

OTel has become the observability standard for good reason. OTel gives you a vendor-neutral way to describe your telemetry, and it lets you attach the context only your code knows about like the user ID, the cart total, the feature flag. However, the coverage OTel provides is limited to what an SRE intentionally instructs. If it isn't instrumented, it isn't in your traces. You don't know what you don't know, and that's a rough way to start an incident.
eBPF comes at the problem from the other side. It lets you run small, verified programs inside the Linux kernel — the one place every packet, syscall and file write has to pass through. Once you deploy an eBPF sensor and telemetry starts flowing from workloads you never touched without SDK implementation or code changes. It honestly feels like magic. It's not a replacement for OTel (the two are genuinely complementary, and the best picture comes from running both), but it covers the blind spots OTel leaves by design.
In this post we'll start with what eBPF actually is and where it came from, including why a technology born around 2014 took the better part of a decade to become this useful. Then we'll walk through the most common use cases across networking, security and observability. After that comes the fun part: a high-level look at how a probe goes from a few lines of C to running safely inside the kernel. We'll finish with three hands-on bpftrace demos you can run on your own Linux box.
This post is based on a talk written by Ori Shushman, a founding engineer at groundcover, who also built every demo you'll see below. If you want the full story with live demos, watch Ori's original talk. Anais Dotis Georgiou also gave an English-language version of the same talk, which you can watch here. Either one makes a great companion to this post.
By the end, hopefully eBPF still feels magical and also a technology you understand better. Let's start with background and history of eBPF.
Background of eBPF
Before we get into history and internals, we need a shared picture of what eBPF is and where it runs. We'll start with a quick refresher on the kernel, then use an analogy you probably already know from frontend work to explain eBPF better.
eBPF stands for extended Berkeley Packet Filter. It lets you write code that runs inside the kernel, dynamically, from outside the kernel. So what's the kernel? It's the core program in an operating system, the bridge between your software and the physical hardware underneath it. Broadly speaking, it provides the infrastructure that every application runs on top of.
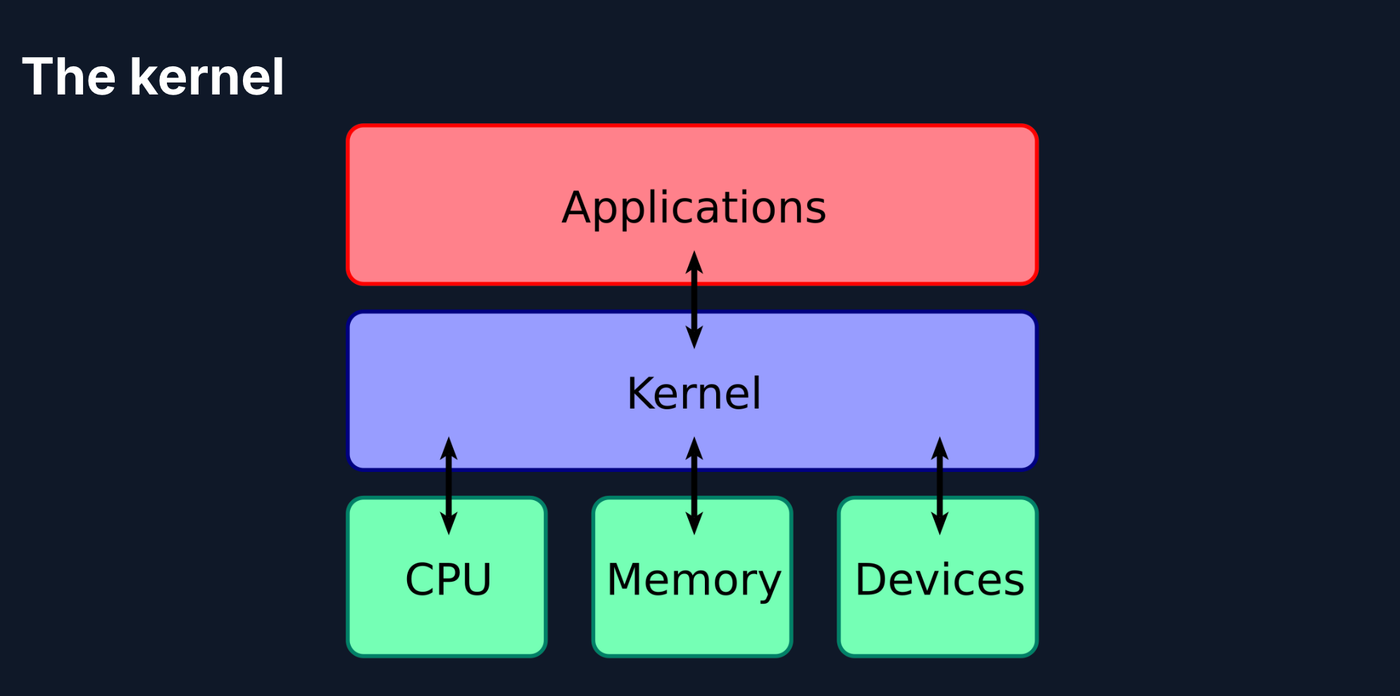
Most of us write code that lives entirely in user mode: web apps, mobile apps, APIs, batch jobs. Only a small group of specialists, like operating system and device driver developers, work in kernel mode. But your user-mode code leans on the kernel constantly. Every time it uses CPU time, allocates memory, reads from the network or writes to disk, the kernel is doing the actual work. The real difference between the two modes is authority. Kernel mode has unrestricted access to the hardware and all of memory, while user mode runs with restricted privileges so a crash in your app doesn't take the whole OS down with it.
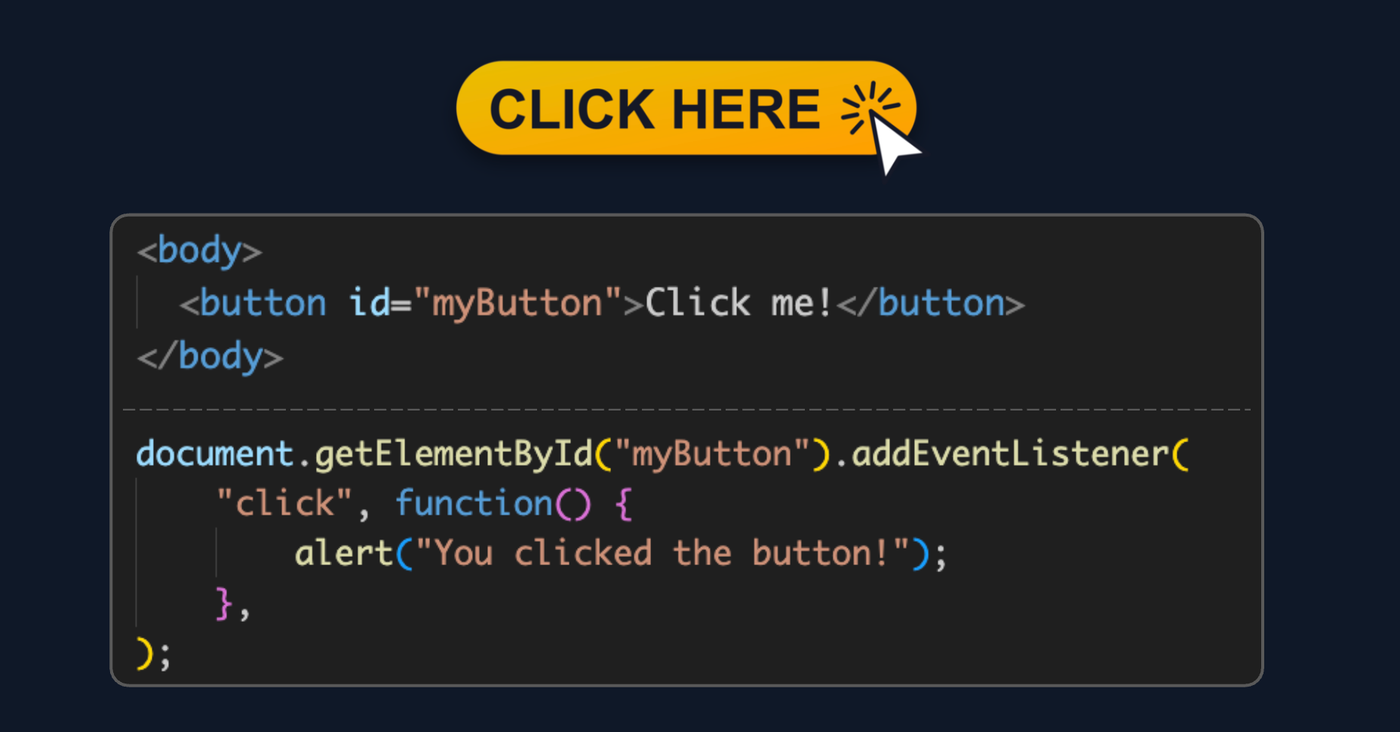
So why talk about JavaScript in a post about the kernel? Because comparison is a good teacher. Here's a button defined in HTML, with a JavaScript event listener that decides what happens when someone clicks it. Static markup, plus a bit of code that reacts to an event.
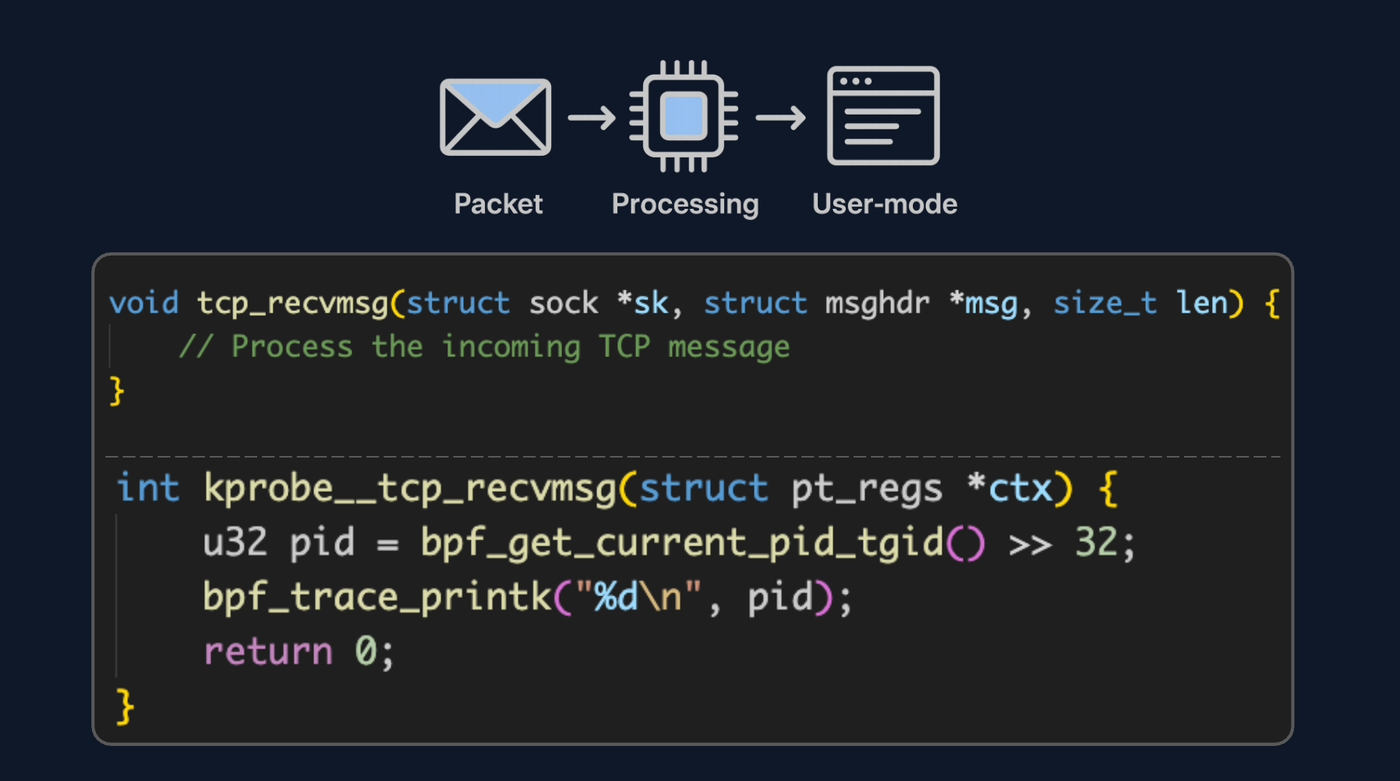
Now look at the eBPF equivalent. At the top is a real kernel function, tcp_recvmsg, which runs every time a packet arrives, before the data ever reaches your process in user mode. Below it is an eBPF program that acts as an event listener on that function. Every time a packet arrives, it prints the ID of the process that received it. Same shape as the JavaScript example. The difference is that the thing being listened to is the kernel itself.
This comparison is so common it has become a catchphrase, usually credited to Brendan Gregg, "eBPF does to the kernel what JavaScript does to HTML". Imagine HTML without JavaScript. You'd get a page that just sits there, no matter what you click. That was the kernel before eBPF was also powerful, but static. eBPF makes it programmable and dynamic, and much like the early web, people keep finding new things to do with that programmability.
You might be wondering why we’re talking about a technology that was born in 2014. The core of this technology has been in the kernel for over a decade. It took a long time, and a lot of engineering, before it got to where it can be used as effectively as it is today. To understand why, we need to go back to the moment the kernel itself became the bottleneck. Let’s next take a look at the history of eBPF.
History of eBPF
eBPF didn't appear because someone thought kernel programming should be more fun. It showed up because the cloud broke an assumption the kernel had been built on. In this section we'll look at the pressure that made eBPF necessary, the people who built it, and the road from where it started to the experience it offers today.
The kernel was frozen
In user space, changing behavior is cheap. You edit, build, deploy, and it's live. If your process crashes, something restarts it. The kernel worked nothing like that. If you needed new kernel behavior, you had two options, and neither was great. You could either:
- Get a patch merged upstream. This meant review cycles, a kernel release, a distro picking it up, and then users actually upgrading. You’re looking at two to four years before your change runs on real machines.
- Ship an out-of-tree kernel module. Modules ran immediately, but with no isolation at all. They were given full privileges with no process boundary. A bad pointer didn't crash your service. It panicked the whole machine.
From the perspective of anyone building on Linux, the kernel was effectively frozen when it came to development. Until the cloud prompted technological and cultural changes.
The cloud made it a bottleneck
Around 2011, that stopped being tolerable. The number of cloud programs was growing fast and virtualization was becoming standard. Large data centers emerged, packed with servers each running dozens of applications at once. Suddenly the application code we wrote wasn't the bottleneck anymore. The bottleneck was the traffic going into and out of each server, and into and out of the data center as a whole.
A physical host stopped just running apps and started routing packets between fleets of VMs. Packet filtering and load balancing became the hot path, and the kernel's networking stack turned into load-bearing infrastructure that needed new capabilities constantly. Meanwhile, everyone else running Linux in production wanted it to stop changing. Stability versus velocity became the main conflict and the kernel had no way to offer both.
Alexei's idea: a new instruction set
This is where Alexei Starovoitov, today known as the father of eBPF, comes in. His argument was simple. Load balancing, packet filtering and all the other logic that runs on incoming and outgoing packets should run inside the kernel. Why did he make that argument? At the time, that logic ran in user mode. A packet would arrive in the kernel, get copied up to a user-mode program that decided what to do with it, travel back down into the kernel, and only then reach the process it was meant for. Every one of those trips costs time. His argument rested on the basis that if you were to move that decision to the kernel, you’d reduce a lot of that redundancy and inefficiency.
Next Alexei wrote a new instruction set that the kernel could execute. An instruction set is the language you use to talk to a processor, like Intel's x86 or ARM. Alexei didn't want to build a new processor. He wanted a new instruction set that the kernel itself would run virtually. The reasoning came from a networking incident that led him to an uncomfortable conclusion. You can't fully trust a compiler to emit what you meant. Rather than trusting the code, why not check it instead? Before the kernel loads a program written in this instruction set, it walks every possible path through it and proves that the program terminates and only touches memory it was given. Fail the proof and the program doesn't load. Pass it and untrusted code can safely run in kernel space.
Daniel joins, and eBPF gets its name
Daniel Borkmann, a developer with deep experience writing kernel code, got hyped about the idea and joined the effort. Together they built eBPF. The name came from a resemblance the team noticed along the way. The kernel already had BPF, the Berkeley Packet Filter (now called cBPF, or classic BPF), used by tools like tcpdump. The original need hadn't come from BPF at all, and cBPF was far too limited for what they needed (it only has two registers, for starters). But the similarity was strong enough that "extended BPF" stuck.
Once it shipped, the economics flipped. Compile a program, load it into a running machine, and it's live. What used to take years now took days. The first proof at scale was L4 load balancing at Facebook, Katran with roughly 50 nanoseconds per packet which was about 10x faster than IPVS. However, writing eBPF at that point meant writing bytecode by hand and then arguing with a verifier that rejected you for reasons you wouldn't understand for a while. Realistically, you needed a kernel team.
Brendan Gregg and the tooling wave
A year later in 2015, Brendan Gregg and others realized eBPF was useful far beyond networking. Brendan is a performance person, and at the time he was working on observability at Netflix. He saw that programmability in the kernel opened the door to all kinds of tracing and analysis. He led the development of platforms like bcc and bpftrace, which made it much easier to write eBPF programs and shipped with a big collection of ready-made tools. bcc and bpftrace are separate projects built on eBPF. They are not eBPF itself. They let you write tracing logic in something closer to a scripting language, which then compiles down to eBPF programs. The same thing happened on the networking side with Cilium, which implements pod networking, load balancing and network policy for Kubernetes using eBPF, without anyone ever having to look at bytecode.
Before and after, in comic form
This comic by Philipp Meier and Thomas Graf sums up the shift better than any diagram.
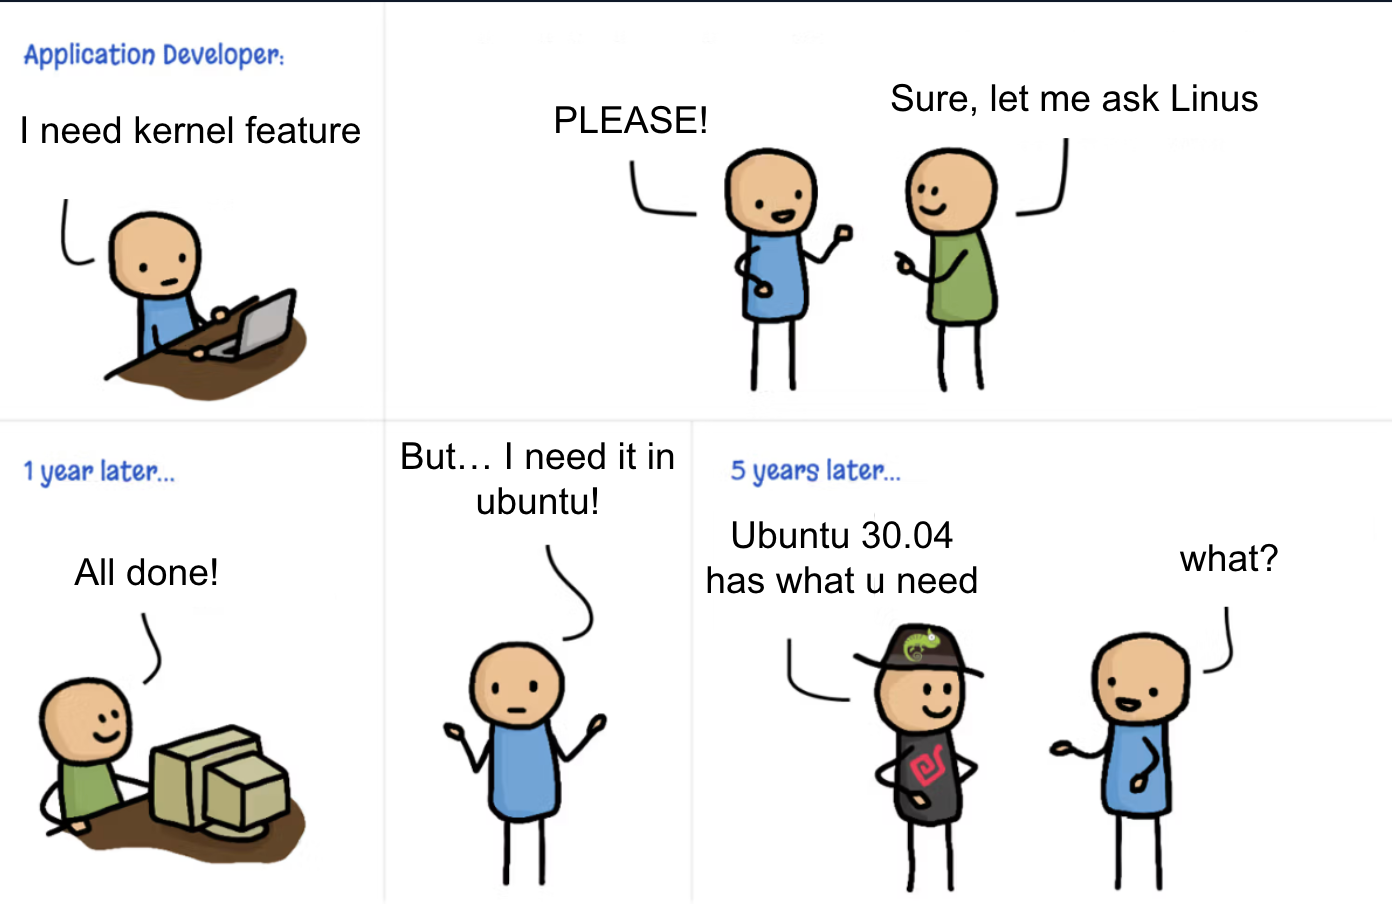
Before eBPF, if you were a user-mode programmer who needed something from the kernel, you went to a kernel developer. They had to convince the community the feature was worth it, which could take a long time. And even once it landed, it wasn't in the Ubuntu release you happened to be running. You'd wait a few more years, upgrade your distro, and only then use it. Practically speaking, that's not a realistic way to ship anything.
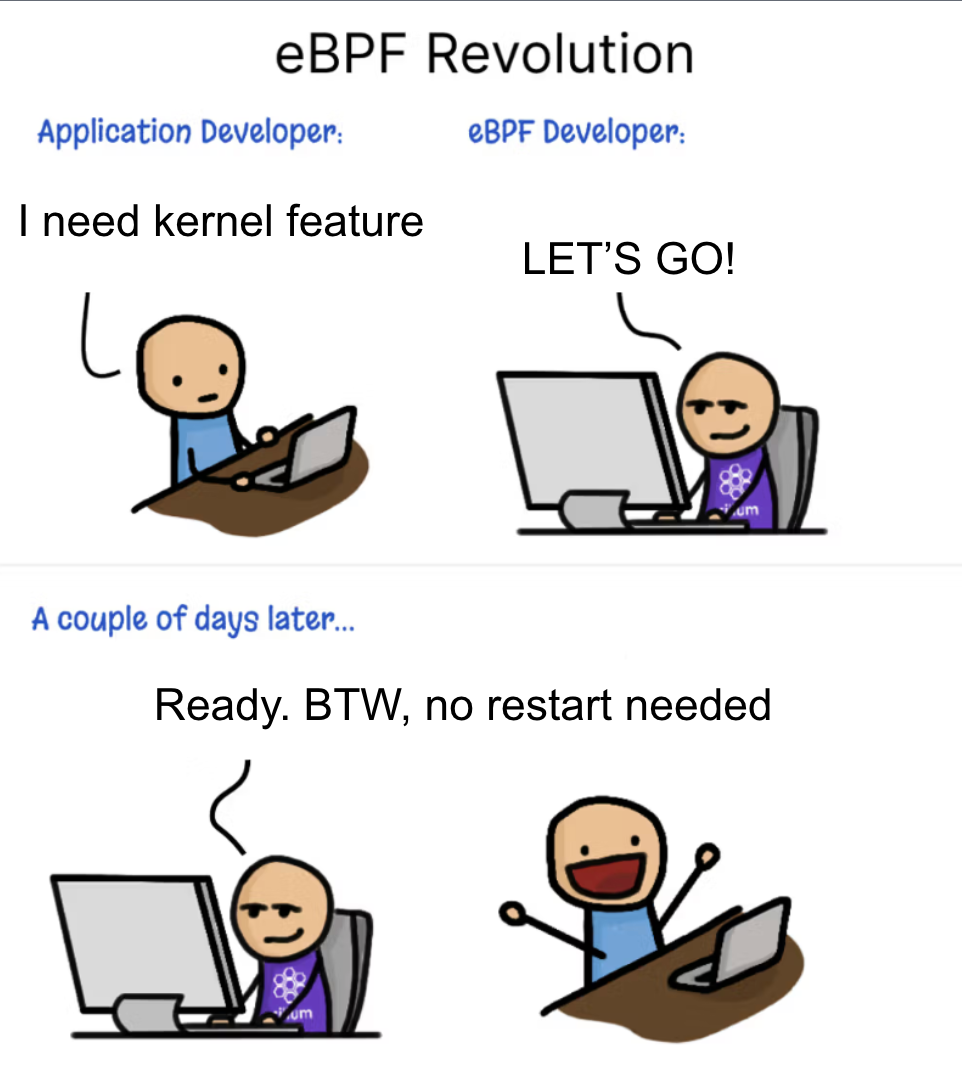
With eBPF, that same developer goes to an eBPF programmer (who might just be themselves) and has what they need within hours or days. No restart required. Around a hundred people in the world used to be able to program the Linux kernel. Now it's more like a hundred thousand, and most of them would never describe it that way. They just install Cilium, or run a profiler that happens to work.
BPF across time
You might be wondering why we're spending this much time on a technology that's been in the kernel since 2014. The honest answer is that in 2014, it wasn't ready for most of what it does today. If you'd asked someone to build an eBPF-based observability platform back then, it would have been impossible. The technology matured in stages, and it's still maturing.
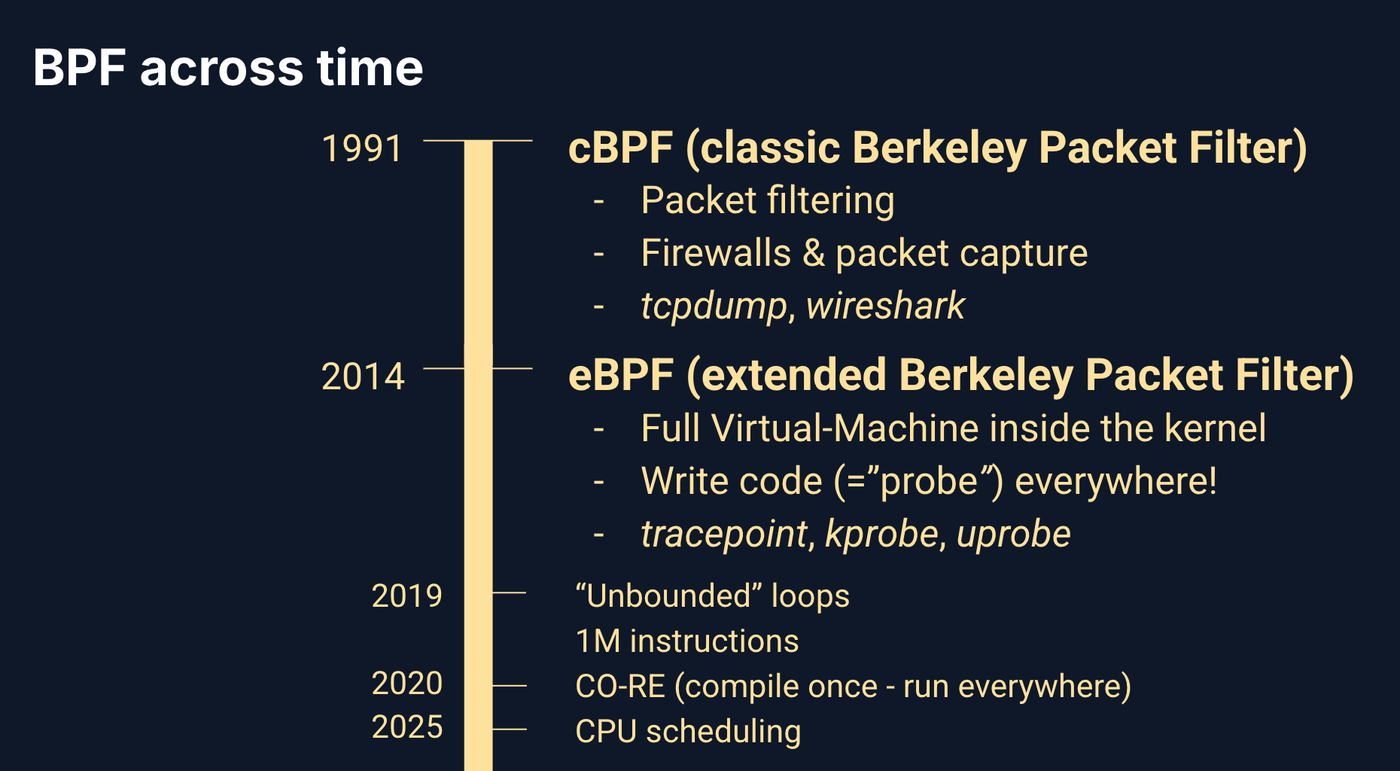
- 1991 – cBPF. Classic BPF handles packet filtering, firewalls and packet capture. It's what powers tcpdump and Wireshark.
- 2014 – eBPF. A full virtual machine inside the kernel. You can write code (a "probe") almost anywhere, using tracepoints, kprobes and uprobes. Not quite everywhere, though. You can't put a probe on the verifier itself, for obvious reasons.
- 2019 – Loops and bigger programs. eBPF programs can finally contain loops (bounded ones the verifier can still prove will end). Try writing real code without loops. Good luck. The instruction limit also jumps from 4,096 to 1 million.
- 2020 – CO-RE. Compile once, run everywhere. A program built against one kernel version can run on others, which is what makes shipping eBPF tools to a fleet of mixed kernels practical.
- 2025 – CPU scheduling. eBPF can now hook into the scheduler and help decide which process runs next.
So eBPF didn't arrive fully formed. It came from a networking bottleneck, survived a long stretch of being too hard for most people to use, and grew into a general-purpose way to program the kernel thanks to better tooling and a steady stream of kernel improvements. Now that we know how it got here, let's look at what people actually do with it.
Common Use Cases
So what do people actually use eBPF for? Most real-world use falls into three areas: networking, security and observability. We'll walk through each, look at a couple of concrete examples, and then talk about why eBPF is such a good fit for observability in particular, including the one tradeoff you should know about.
Networking
Networking is where eBPF started, so it makes sense to start there too. The simplest example is packet filtering. With eBPF you can write a few lines of code that drop traffic on a specific port. Compared with older approaches like iptables, the difference is that your filter is real code. You can filter on any logic you can write, not just a fixed set of rules. The same hook points let you reroute traffic for load balancing and measure exactly how much network each application uses.
That last one is probably sitting in your pocket. If you use Android, open the settings for any app and you'll see how much data it has used. That number is computed with eBPF. Android used to do it with a custom kernel module and replaced it with eBPF because it's more efficient and safer.
Security
In security, the core building block is the probe, which is what we call an eBPF program that runs as an event listener. Put a probe on the kernel's open function and you can see every file access on the system. Watch process lifecycle events and you can see which processes are running, when they exit and why. You can implement a firewall. And a lot more, all from the one layer an attacker can't easily route around.
Observability
Observability is where groundcover lives, and it's where eBPF gets really interesting for developers and SREs. Want to know how long disk writes take? Put one probe on entry to the write function and another on exit, and measure the time in between. That's latency monitoring with two probes. You can also see all the network communication on a machine, which tells you how long traffic takes to arrive and leave, and flags bad traffic too. If you see a stream of HTTP 400s on a particular API, you know there's an error you probably need to handle in your application. And you can profile code by instrumenting it at all sorts of points to find out where it actually spends its time.
A developer looking at that latency example might reasonably ask: "Hang on, I write the code. I can measure how long my own file writes take. Why do I need this?" Fair question. Here's why eBPF still wins for a lot of these jobs:
- Zero code changes. You don't ship a new version of your service to start measuring something.
- No restart. The probe attaches to the running kernel. Your process never notices.
- Full coverage. You see every write to every file, across every process, at once, not just the code paths someone remembered to wrap.
- Less overhead. No extra instrumentation to add, maintain and redeploy every time you want a new measurement.
- Inner-kernel visibility. You can measure kernel internals that your own code simply can't reach.
But there's a tradeoff: less context. Say you want to measure each file write and know the value of some variable in your application at that moment. That's much harder from the kernel. Possible, but harder. This is exactly where OpenTelemetry earns its place. eBPF gives you broad, automatic coverage, and OTel adds the business and application context only your code knows about. Together they cover far more than either one alone.
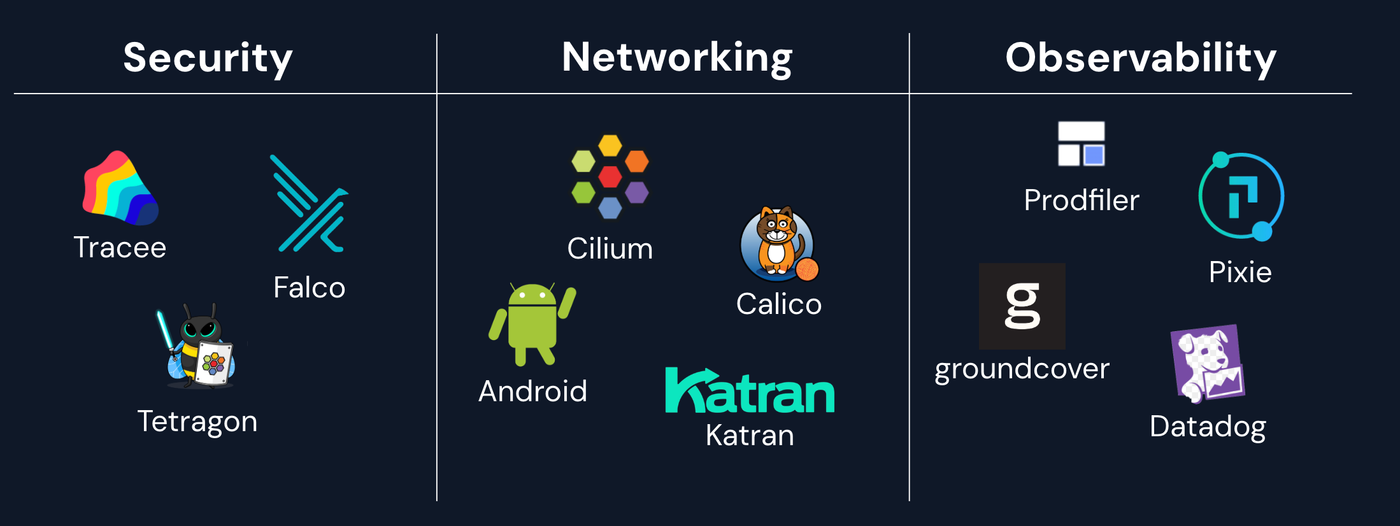
The landscape includes both long-standing products like Android that are gradually swapping in eBPF where it helps, and newer companies like groundcover that are built on eBPF from the ground up. More keep appearing as the technology matures. The short version: networking gets speed and programmable packet handling, security gets deep visibility into files and processes, and observability gets full coverage with zero code changes, at the cost of some application context. Knowing what eBPF can do raises the obvious next question. How does the kernel run code it didn't write without falling over?
How It Works (High Level)
This is the most interesting part, in my opinion. It's a bit more technical, but it's not long. We'll follow a single probe through five stages: writing it, compiling it, verifying it, attaching it and executing it. This walkthrough is based on Brendan Gregg's excellent BPF Internals talk, so if you want to go deeper after reading this, look that one up.
1. Write your probe
Our example hooks a kernel function called do_nanosleep, which runs every time a program goes to sleep. That's an interesting place to listen. The probe itself is tiny: every time do_nanosleep is called, it records which process went to sleep. To get the process ID, it calls a BPF helper named bpf_get_current_pid_tgid. Helpers are the functions eBPF code is allowed to call, and they're your main interface to the kernel from inside a probe.
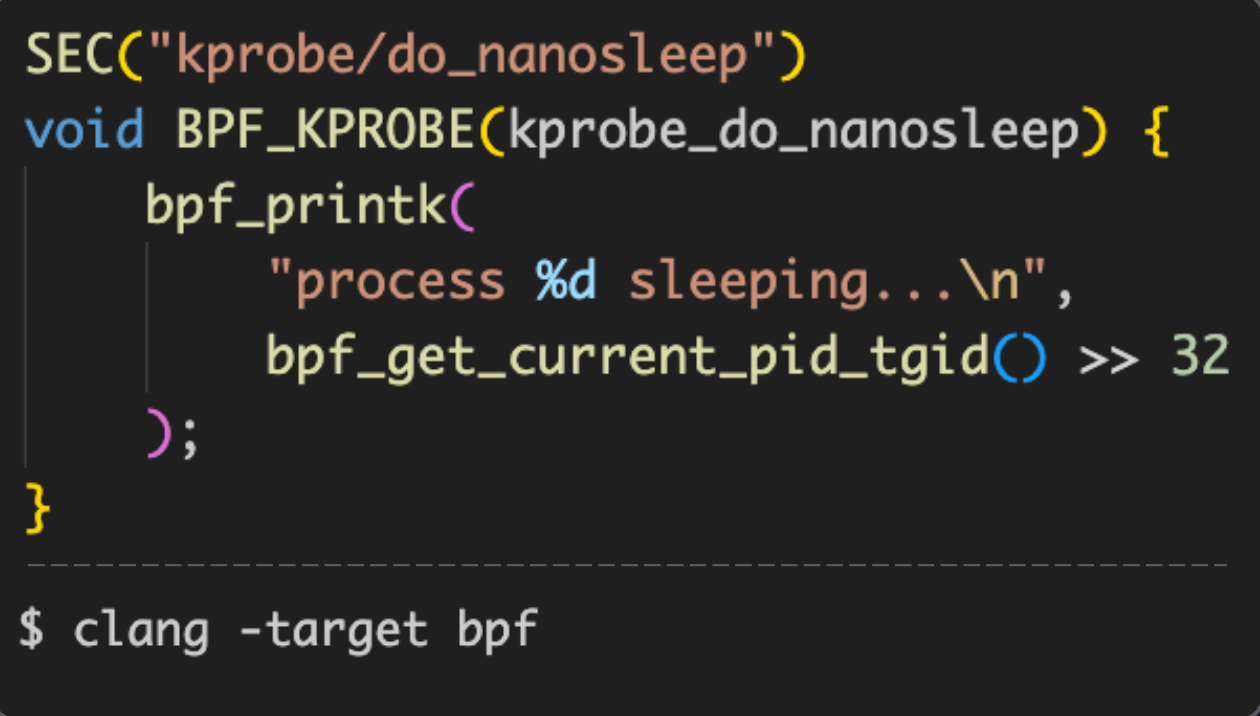
2. Compilation
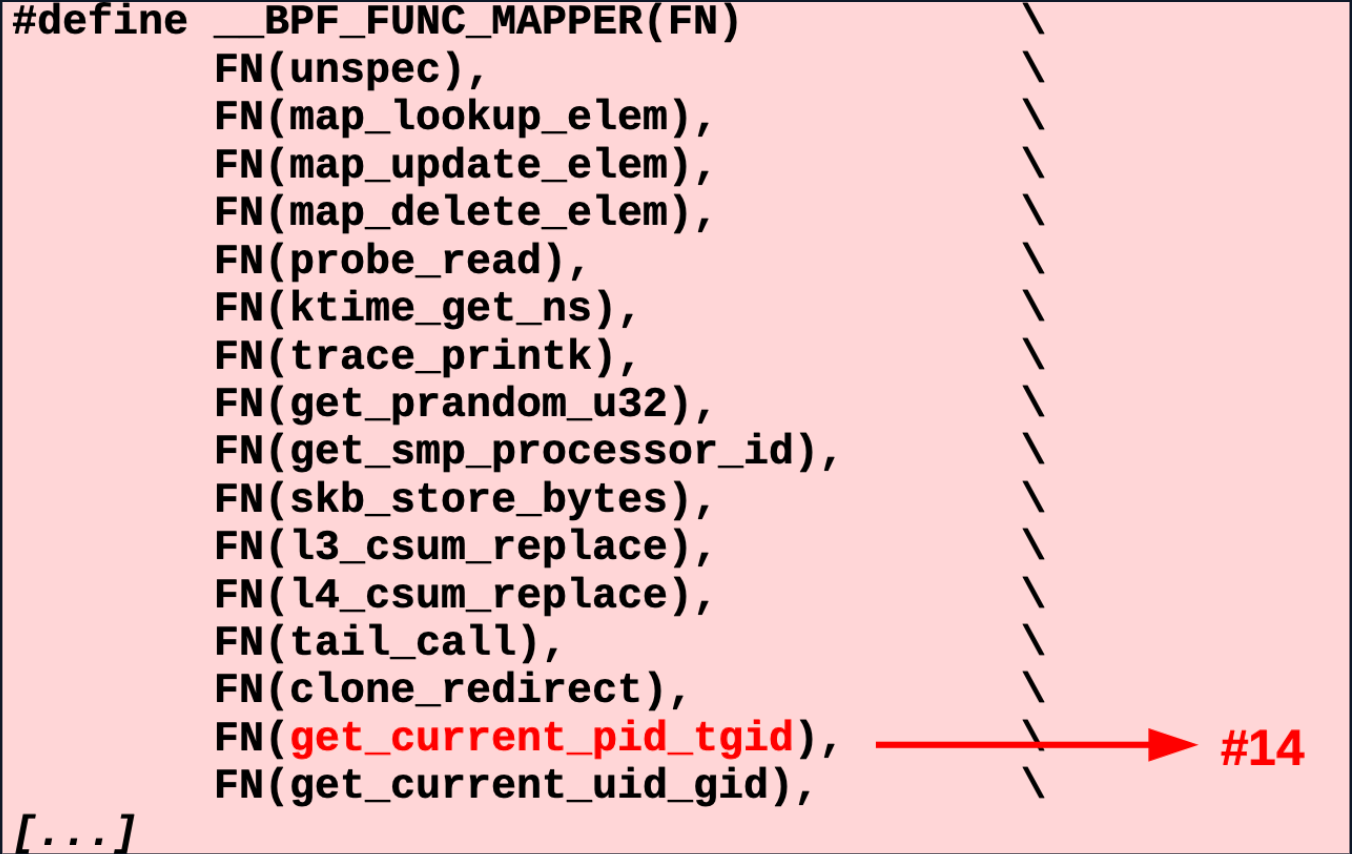
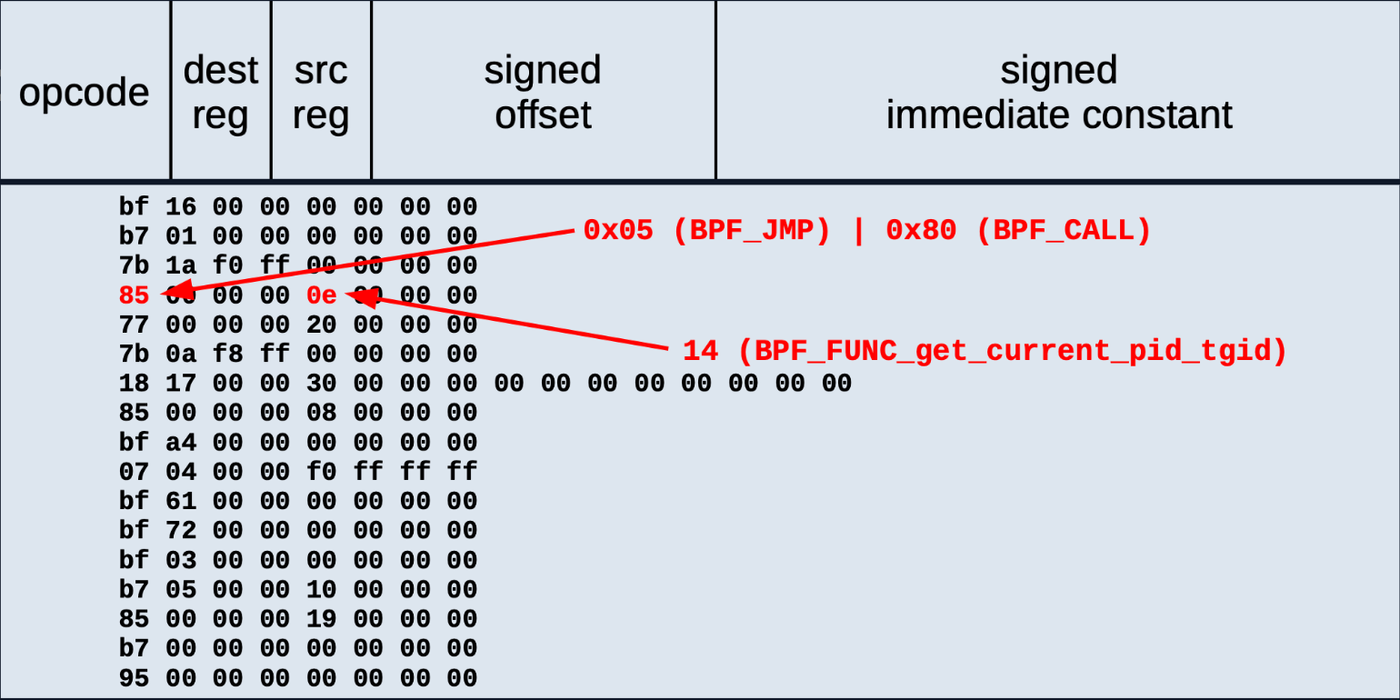
Next we compile the probe. The important detail is the target. Even though this example will run on an x86 machine, we don't compile to x86. We compile to BPF, the instruction set Alexei designed back in the history section. Every instruction becomes a sequence of bytes, and every helper has a number. Ours, bpf_get_current_pid_tgid, is number 14.
If you open the compiled object file, you can find the call to our helper directly in the bytecode. A call to a BPF helper is the instruction 0x85 (that's BPF_JMP | BPF_CALL, or 0x05 | 0x80), followed by some zeros and then 14, our helper number. All of our code lives in bytecode like this.
Stop and think about that for a second. From user mode, you can write whatever code you want and have it run inside the kernel. That should make you a little nervous. The kernel did a huge amount of work to make sure this is safe, and that work lives in the next step.
3. Verification
Before anything runs, a kernel component called the verifier goes over the eBPF program to make sure it can't do anything we don't want it to. It analyzes the code by simulating runs over it, and it enforces a long list of rules, including:
- Limited stack size, so a probe can't consume unbounded memory.
- Limited instruction count, so you can't write an infinite loop and hang the kernel.
- No sleeping, so a probe can't stall whatever kernel path it's attached to.
To check all of that, the verifier tracks a lot of state and walks every flow through the code. Say your program has a variable x and checks if (x > 3). That's a branch. The verifier follows the path where x is greater than three and the path where it's less than or equal to three, continues down both all the way to the end, and confirms that every path exits cleanly without doing anything stupid. This is where the trust comes from. The verifier turns the question "do we trust this code?" into "do we trust this proof?"
4. Attachment
Now the kernel has a program it's approved, and it needs to run it whenever do_nanosleep is called. Here's how. Look at the disassembly of do_nanosleep itself, the actual machine code inside the kernel. The very first instruction is a call.
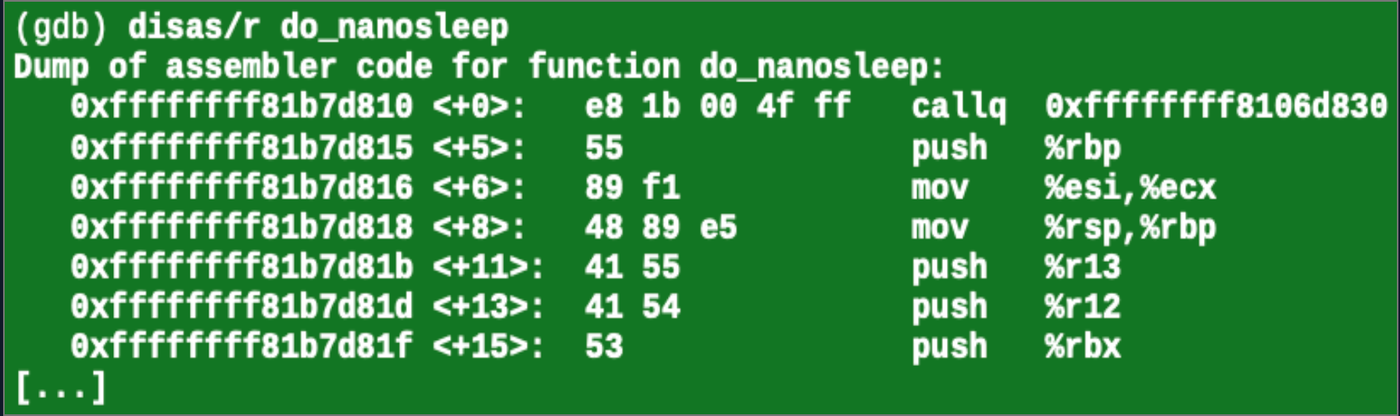
The kernel literally modified its own code at runtime to add that call. It points to what's called a trampoline. When do_nanosleep is called, execution jumps into our probe, and when our probe finishes, it jumps back to the start of do_nanosleep. The hooked function runs as if we were never there. We've just added a little runtime at the beginning, and how much depends on what the probe does.
5. Execution
There's one more puzzle. Our probe is BPF bytecode, but the CPU only understands x86. So how does it actually run? Exactly the way JavaScript does: just-in-time compilation. The kernel's JIT compiler walks the BPF instructions one at a time and translates each one into native code.
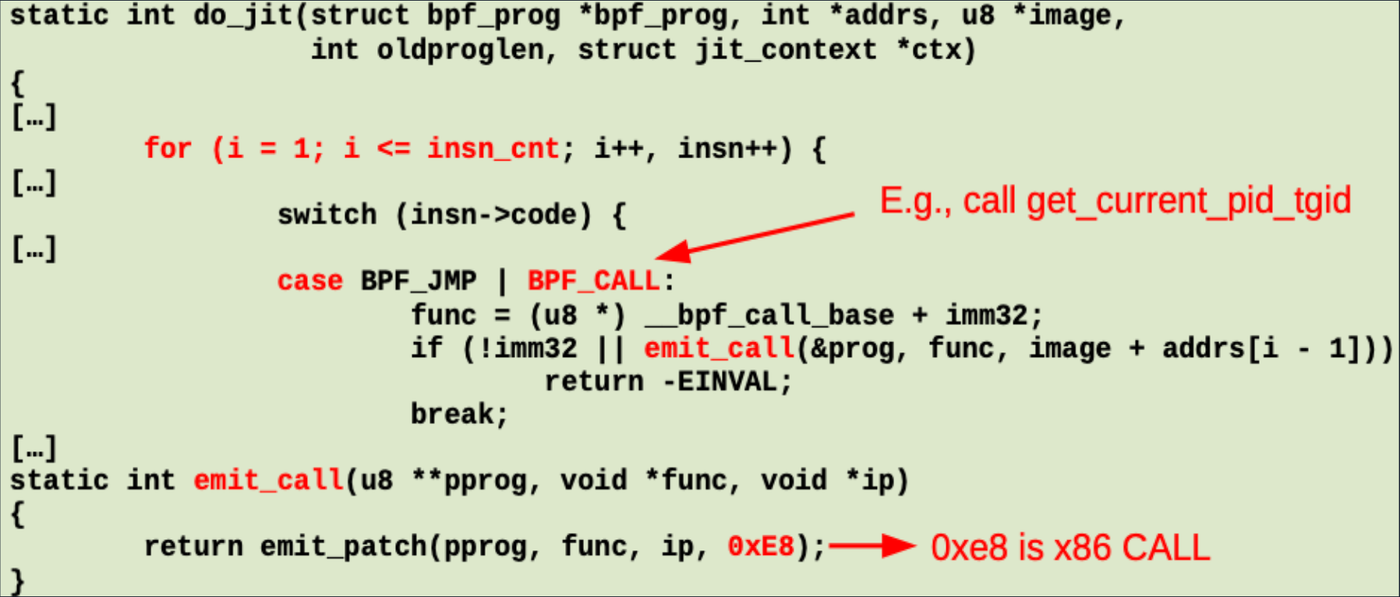
When it reaches our helper call, it recognizes the 0x85 instruction and emits 0xE8, the equivalent call instruction on x86. Then it replaces helper number 14 with the real address of the helper's implementation inside the kernel. It does this for every instruction until the whole program is compiled. The result is code that technically started life in a virtual instruction set but runs as if it had been native x86 from the start. It's a very efficient way to virtualize code.
That's the full trip: write, compile, verify, attach, execute. Every one of those steps is the product of years of kernel work, which is why the BPF across time timeline from the history section matters so much. Bounded loops, the jump to a million instructions and CO-RE are what turned this pipeline from a curiosity into something you can build products on. Speaking of building things, let's get hands-on.
Scripting with eBPF
Enough theory. In this section we'll look at the different ways you can actually use eBPF, take a quick tour of the bcc tools, and then run three bpftrace demos that get progressively more interesting: watching every file open on a machine, reading TLS traffic before it gets encrypted, and tracking writes to one specific file. Thanks again to Ori for building all three.
Picking your level
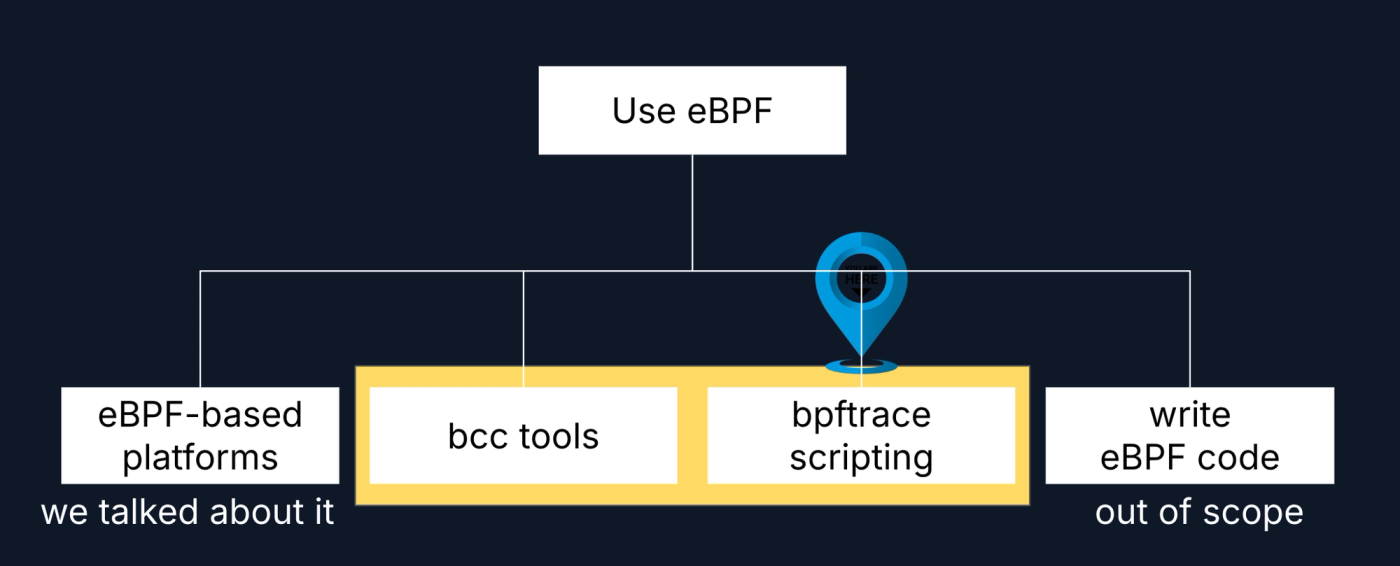
There's a spectrum of ways to use eBPF. At the easy end, you use platforms that have eBPF built in, like the observability, networking and security tools we covered earlier. At the hard end, you write raw eBPF programs yourself, which is out of scope for this post. In the middle are two very approachable options: ready-made bcc tools, and bpftrace scripts you write yourself.
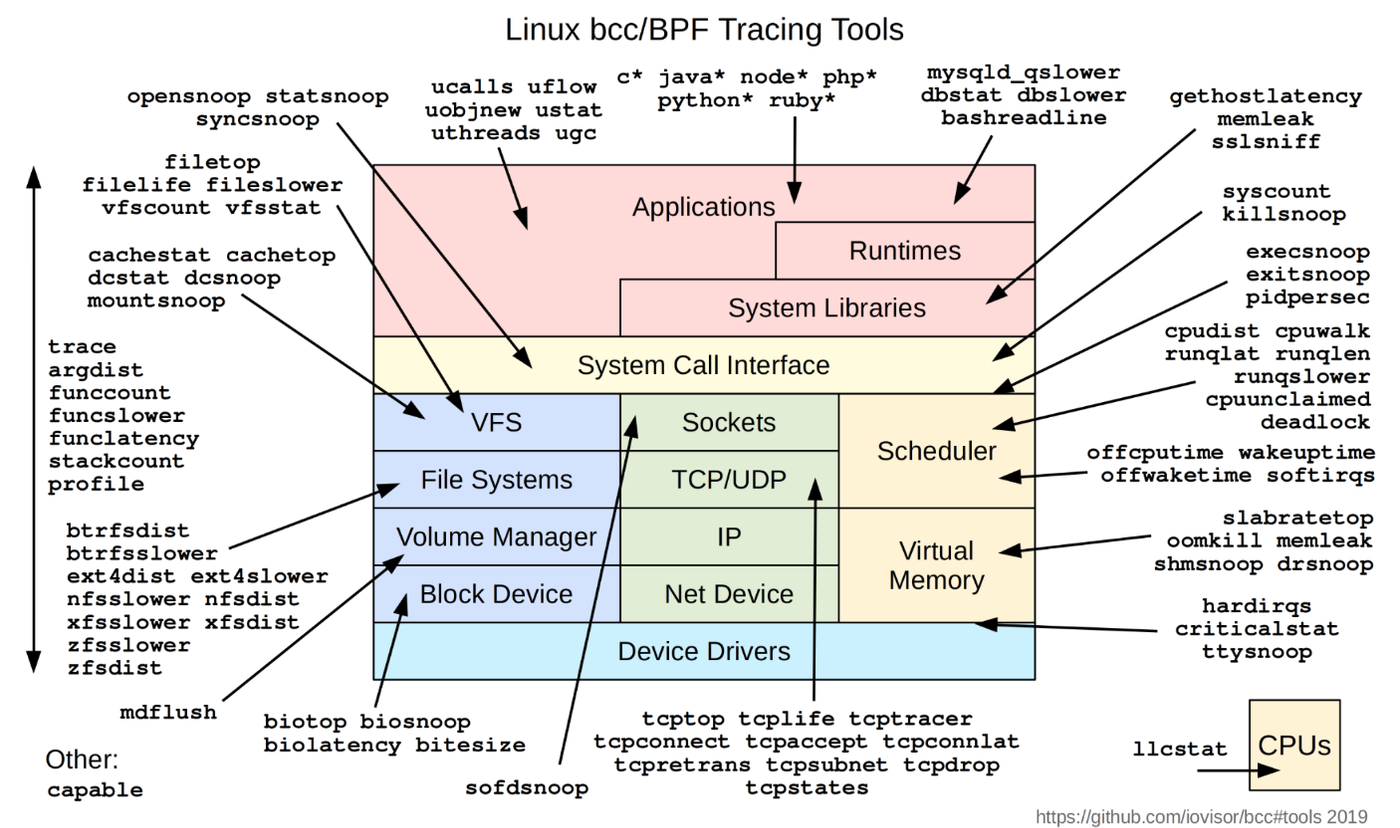
bcc ships with a huge collection of tools, and the screenshot below is actually an old one, so there are even more today. There's something in there for nearly everyone: tools that show which processes were killed for running out of memory, every process that starts, every command run from bash, every TCP connection, and plenty more. If you've never tried them, browsing the bcc tools list is a great first step.
Ready-made tools are great until you need something slightly different. That's where bpftrace comes in.
Example 1: Watch every file being opened
Our first example is a one-liner that shows every file being opened on the system, in real time.
Here's what's going on. bpftrace -e runs a script straight from the command line. tracepoint:syscalls:sys_enter_open attaches a probe to the tracepoint the kernel fires every time the open syscall is entered. Inside the braces we print the process ID and the filename being opened. All you need is the function to probe and which argument holds the filename (in this case, filename).
One practical note: most modern programs call openat rather than open, so if your output is quiet, swap in tracepoint:syscalls:sys_enter_openat and you'll see a lot more.
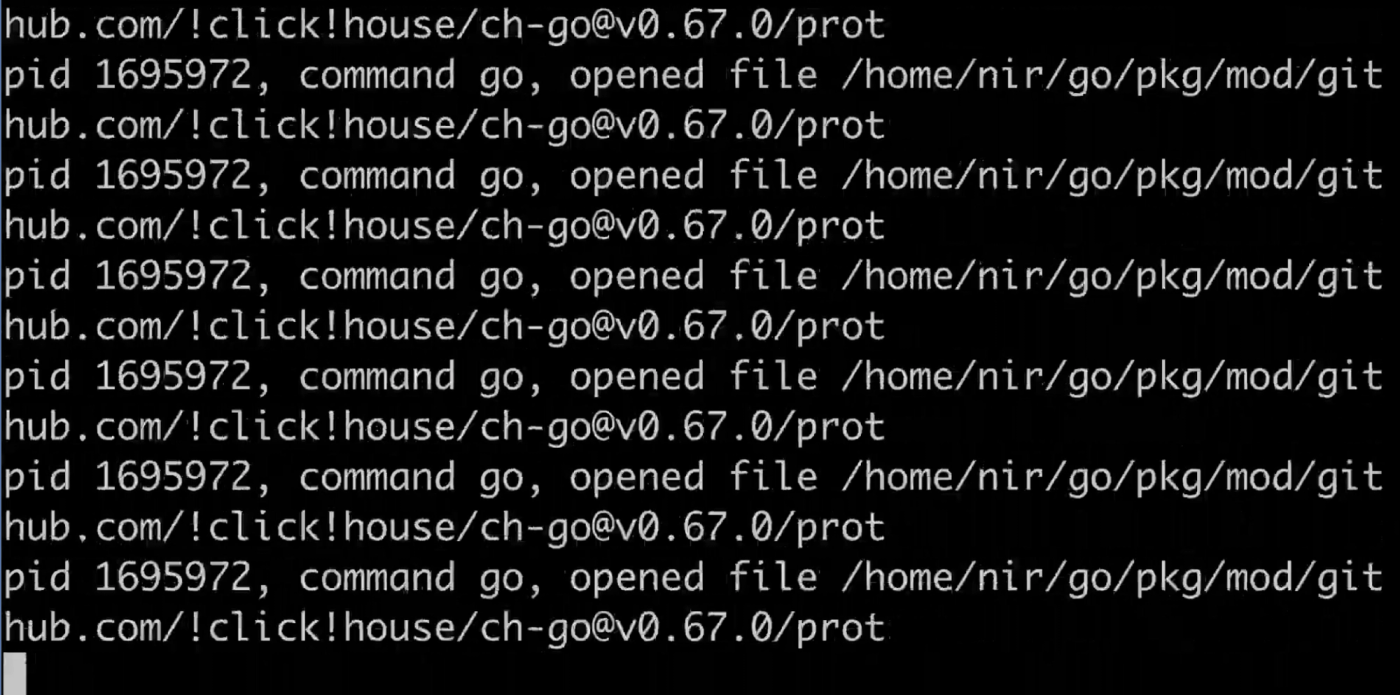
Run it and the terminal fills up immediately. In the example you can see a Go process opening file after file, which looks a lot like it's in the middle of a compile. One line of script, and you're watching the whole operating system.
Example 2: Decrypt TLS traffic with a uprobe
For second example we have a small C server, called server, that listens on port 29195 and responds over TLS with the message "reversim2025 rocks!". A client loop connects to it about once a second. The traffic is encrypted, and we want to see what it actually says.
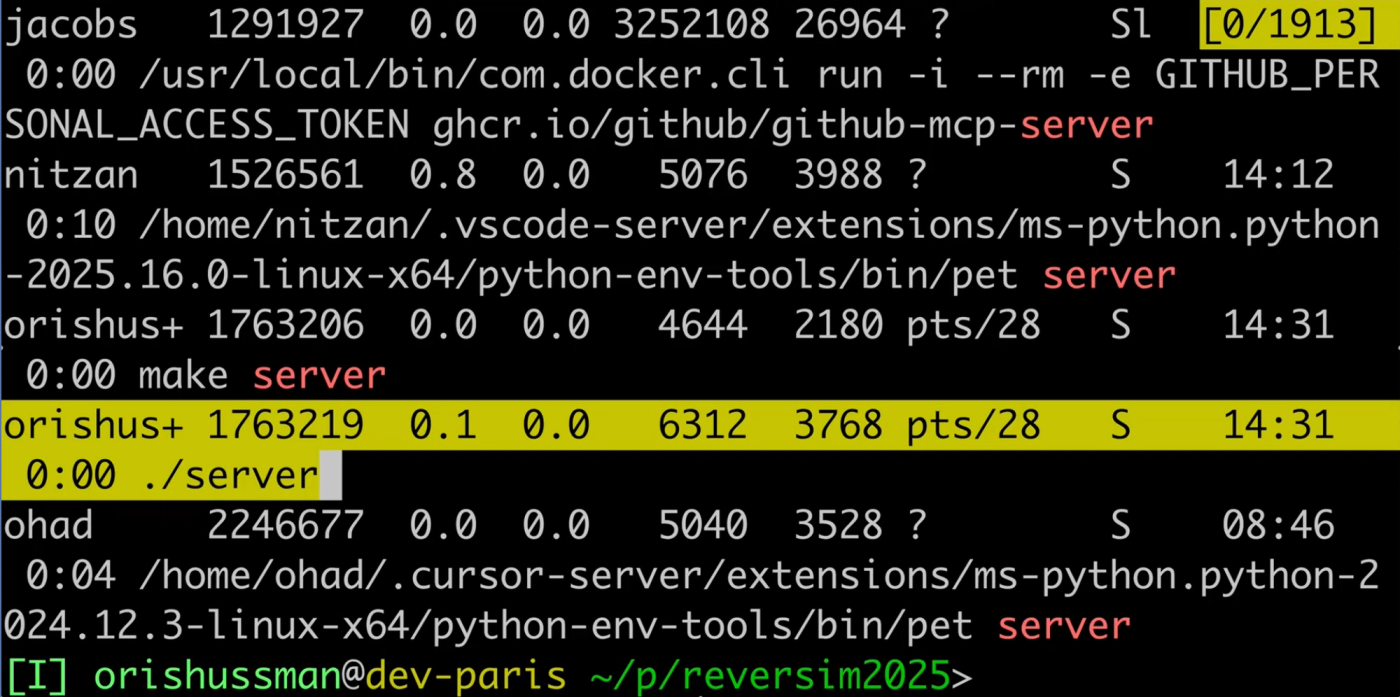
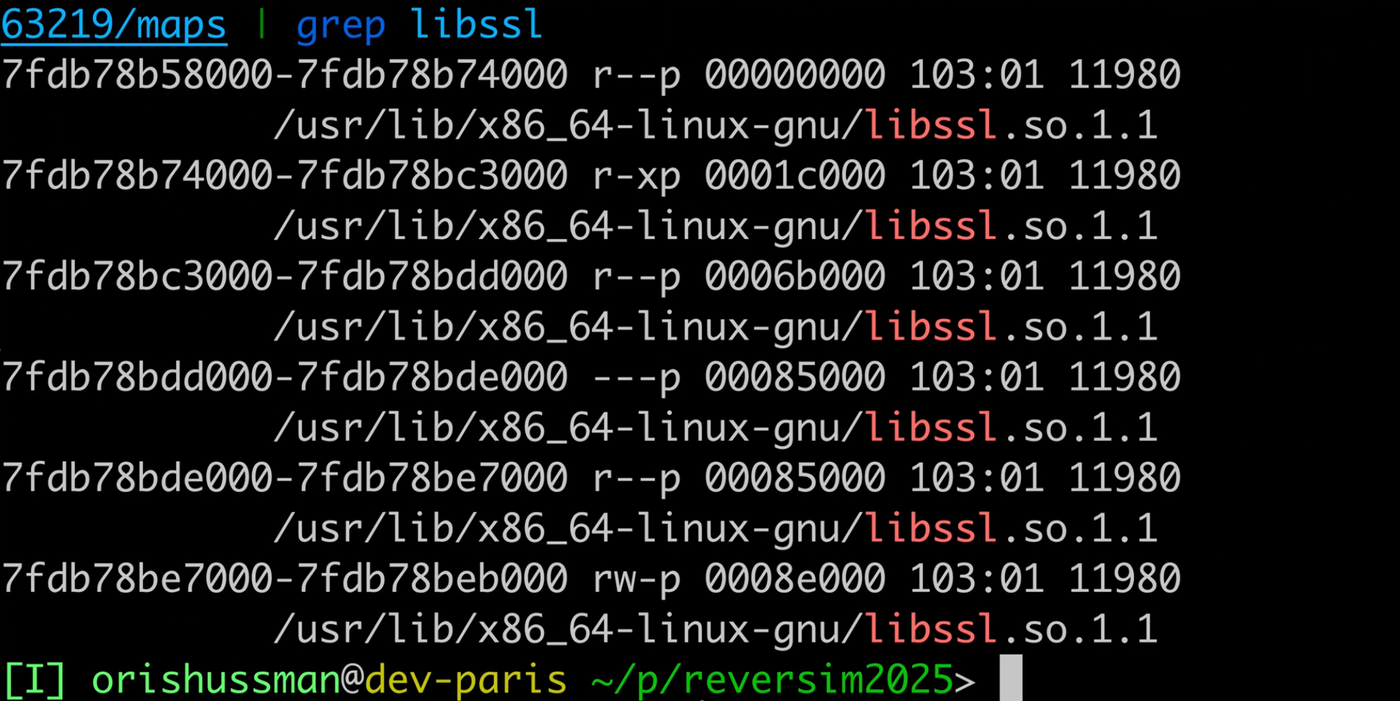
First, a bit of detective work. We find the server's process ID and look at its memory maps, which list every shared library it has loaded.
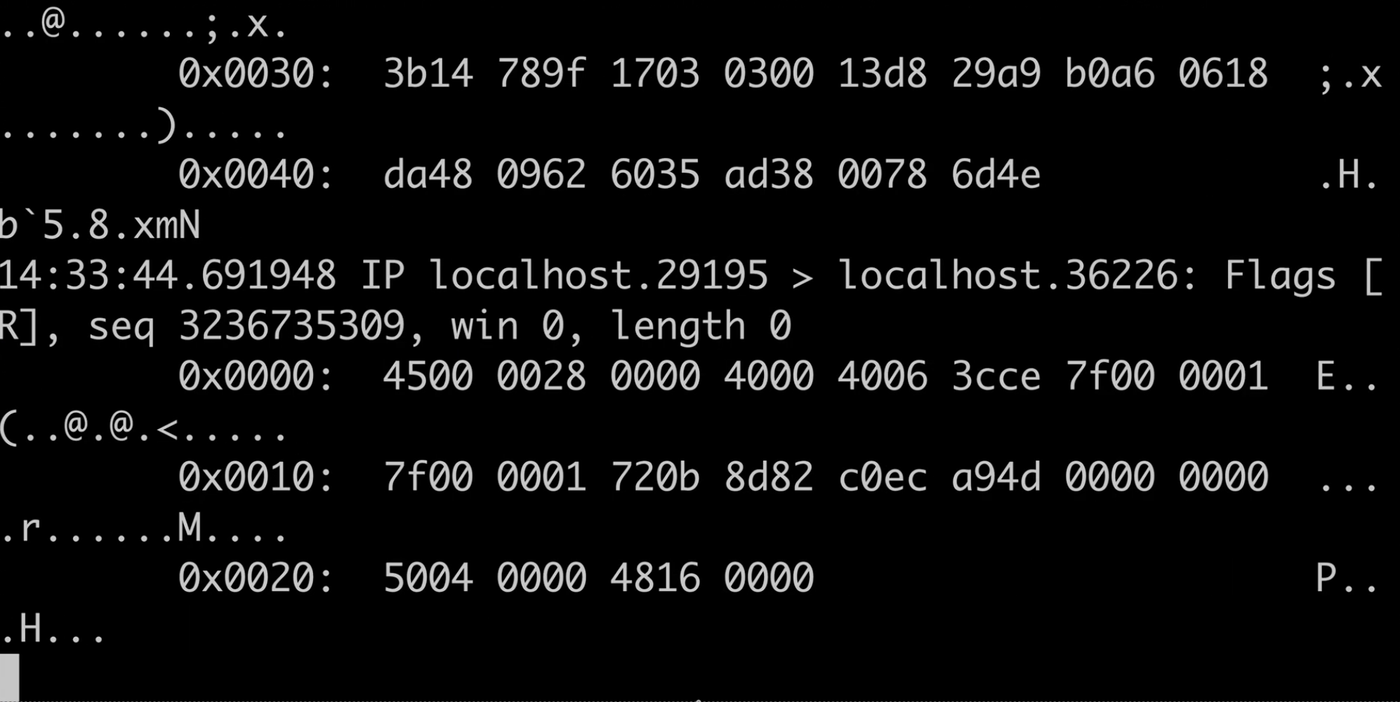
We look at the traffic with tcpdump, and we can see packets going by roughly once a second, but the payload is unreadable.
Now let's read it anyway. This time we use a uprobe, a user-mode probe, because SSL_write lives in a shared library rather than in the kernel. SSL_write receives the plaintext buffer and its length, encrypts it, and sends it. If we attach to it, we see the data before encryption ever happens. We also filter the probe so it only fires when the process name is server.
(The path to libssl varies by distro, so use the one you saw in the maps file.)
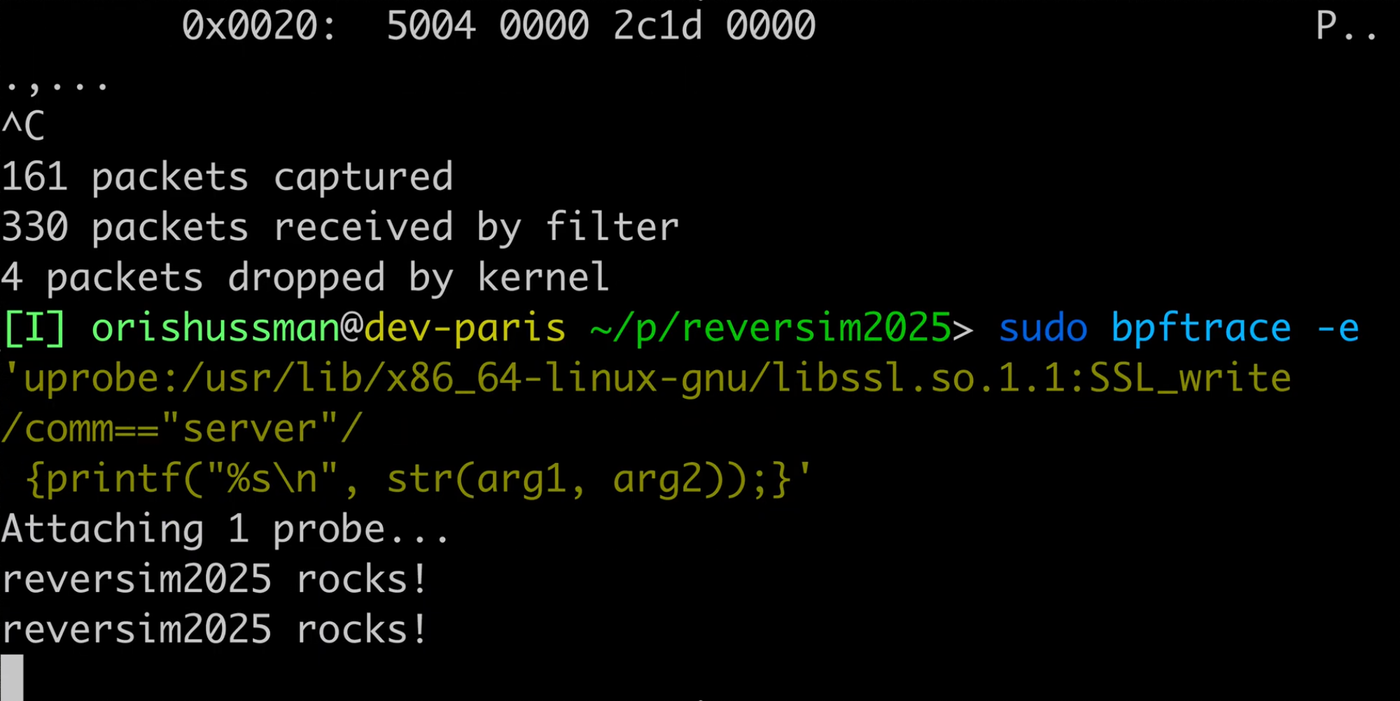
Attach the probe and the plaintext message is outputed. This is the same technique eBPF-based observability tools use to give you full request and response payloads for encrypted traffic.
Example 3: Track writes to one specific file
The last example is the most involved, because it needs several probes that share state. The goal is to print everything written to one particular file, reversim2025.
The obvious first attempt is a probe on the write syscall that prints the process ID and the data. The problem is that it prints writes to every file, and we only care about one. Worse, write doesn't receive a filename at all. It receives a file descriptor. To learn which descriptor belongs to our file, we have to catch the moment the file is opened.
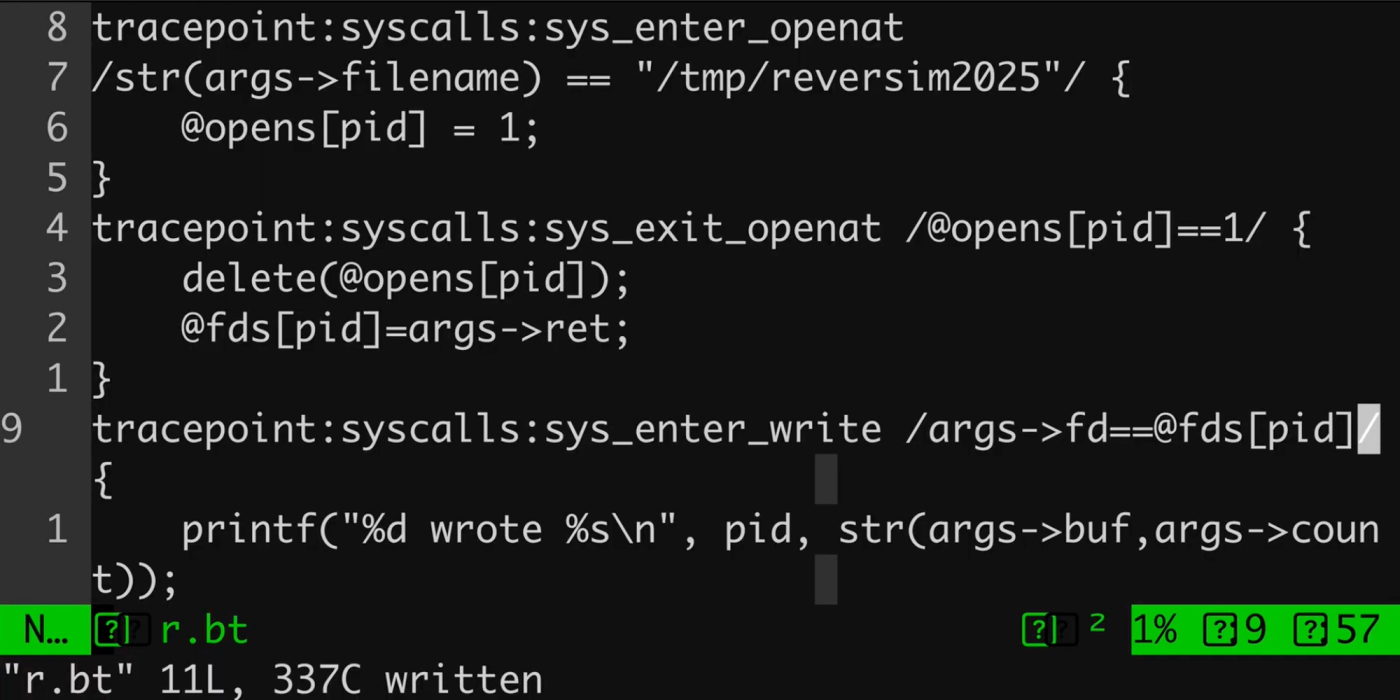
So the script uses three probes that talk to each other through maps in kernel memory:
- On entry to openat, check whether the filename matches the file we care about. If it does, remember that this particular call is interesting.
- On exit from openat, if the call was one we flagged, save the returned file descriptor in a second map, @fds, keyed by process ID.
- On entry to write, only fire when the file descriptor matches the one stored in @fds, and print the data.
(The filename comparison is exact, so match the path the way your program passes it to openat.)
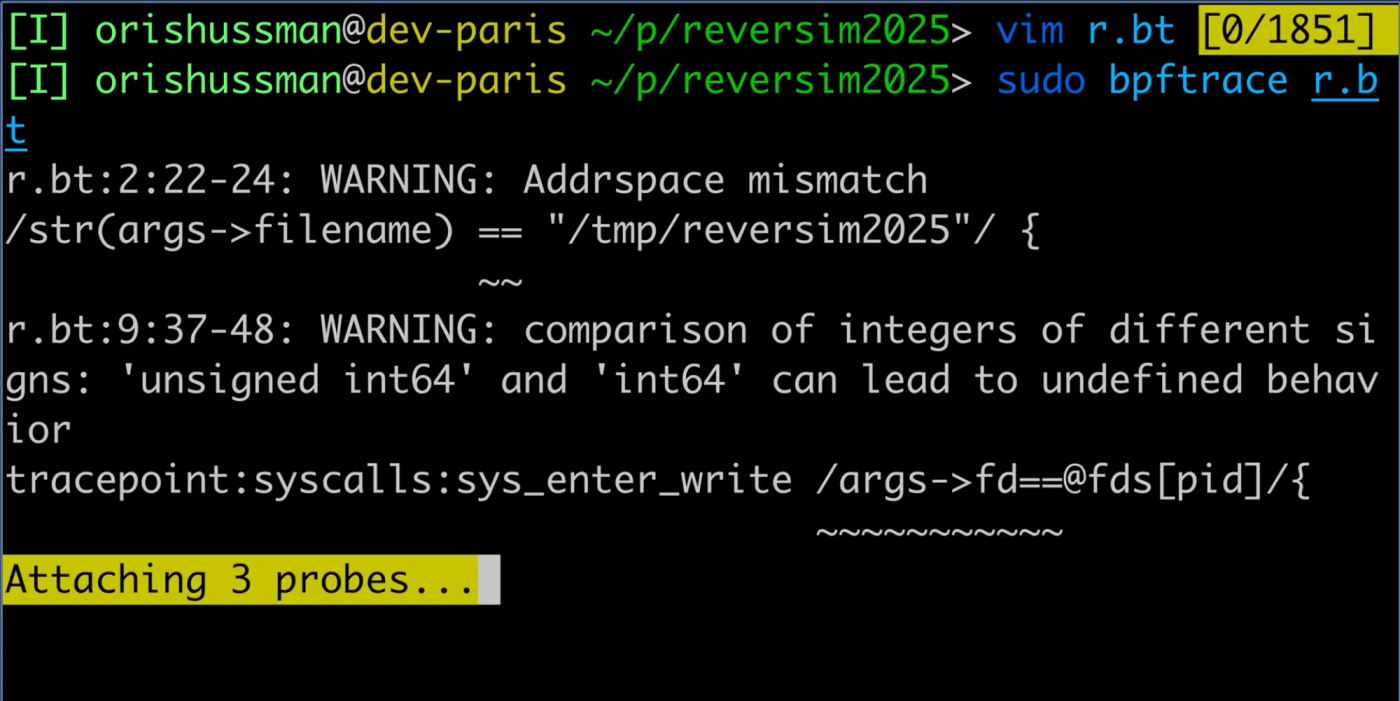
Run it, write something to the file, the process opens the file, and our probes record its file descriptor. The moment it writes, the write probe catches it and prints the data. Three probes, a little shared state, and you've built a targeted file monitor in about fifteen lines.
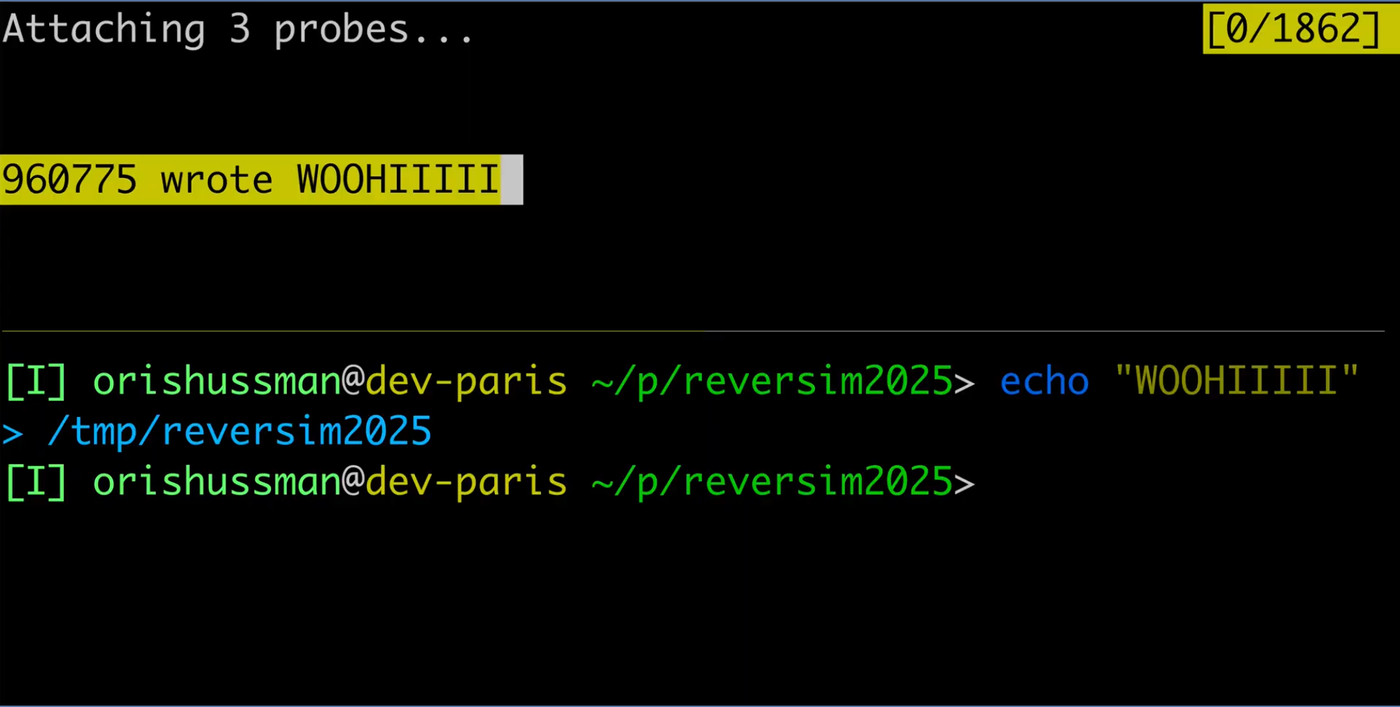
Those three examples cover a lot of ground. The first showed how little code it takes to watch the entire system. The second showed eBPF reaching into user-space libraries to see data nothing else can. The third showed probes cooperating through maps to answer a question no single hook could.
Conclusion
We started with a problem every SRE knows: you can only observe what someone remembered to instrument. eBPF changes that by moving the observation point down into the kernel, where everything passes through anyway.
Along the way, we saw that eBPF came out of a very practical need, when cloud traffic made the kernel's networking stack the bottleneck. Alexei Starovoitov and Daniel Borkmann answered with a verified, virtual instruction set the kernel could safely run. Brendan Gregg and others turned it into tooling regular engineers could use, and a decade of kernel improvements (loops, a million-instruction limit, CO-RE, scheduler hooks) made it practical for real products. We walked through how a single probe gets compiled, verified, attached through a trampoline and JIT-compiled to native code. And we ran three bpftrace demos that went from a one-liner to a small multi-probe program with shared state.
The takeaway is simple. eBPF is a powerful, practical technology, and there's a good chance it can help you right now, whether that's a bcc tool you run during your next incident, a bpftrace script you write to answer a question your dashboards can't, or a platform that does all of this for you. It won't replace the application context OpenTelemetry gives you, and it doesn't need to. Run them side by side and you get both: the business context from your code and the ground truth from the kernel.
If you want to see all of this live, watch Ori's original talk. or Anais's English version which you can watch here. Then go poke around the bcc tools, try the demos above on a test box, and if you'd rather skip straight to eBPF-powered observability for your Kubernetes clusters, try the groundcover playground.