Dashboards built by the agent, not just for it
Ask Agent Mode for a dashboard and get a fully populated, live board on the first pass. Every panel stays there next Tuesday at 3am, shared with the whole team, whether or not you're in the room.
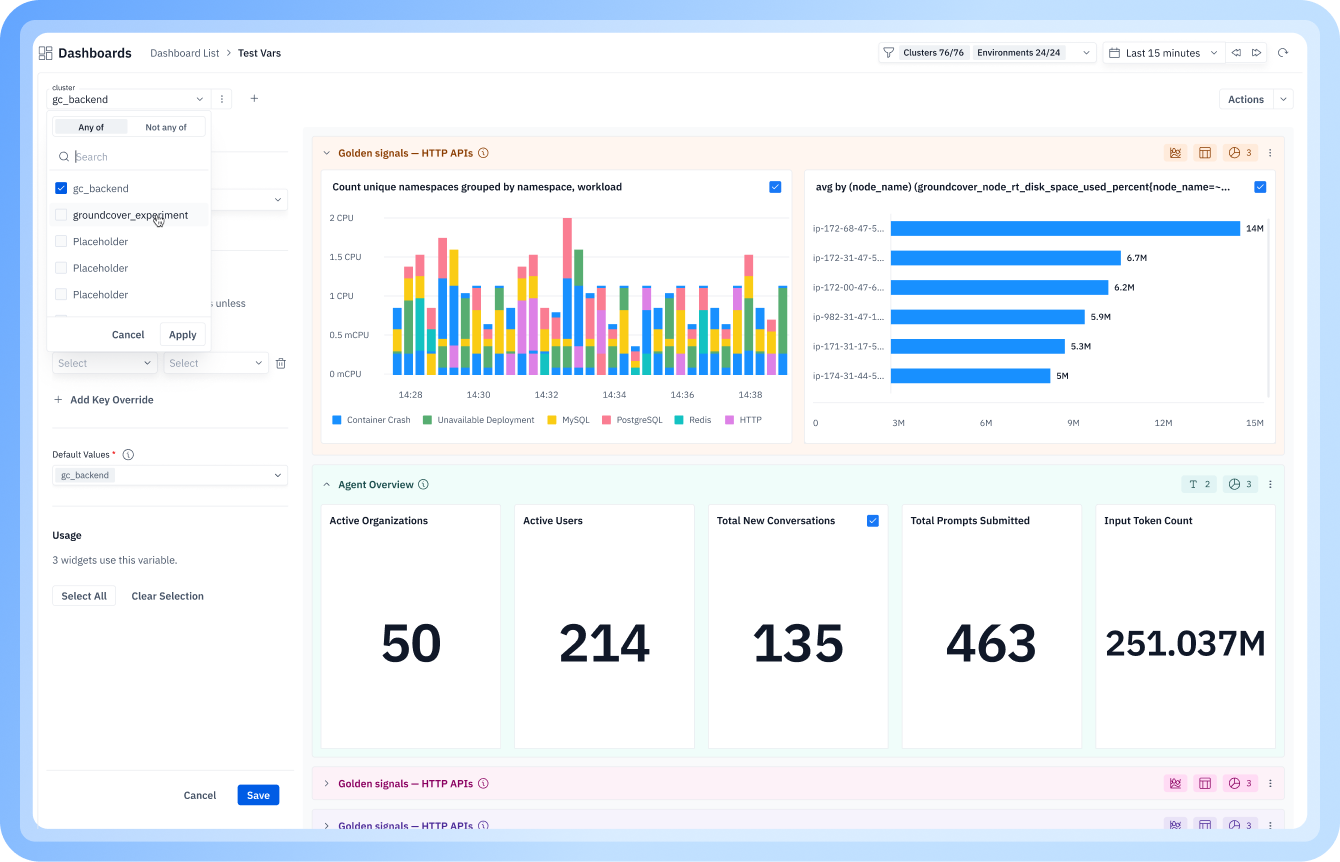

Ask, don't build.
Describe the outcome and Agent Mode brings in the right panels: infra usage, error traces over time, error logs over time, wired to live data.

SLO-grade visualization.
Thresholds, treemaps, conditional formatting, and time-offset comparisons that used to require a separate BI tool.

Nothing gets lost.
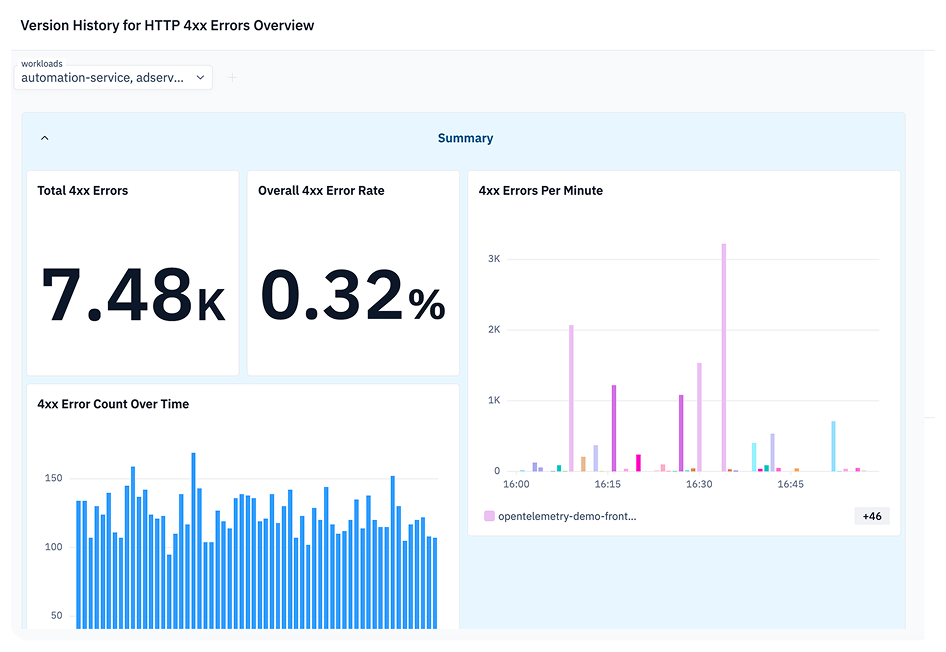
Version history with revert, archive and restore, and stale-version warnings mean a dashboard is never one bad save away from gone.
Why dashboards still matter in an agent-first platform
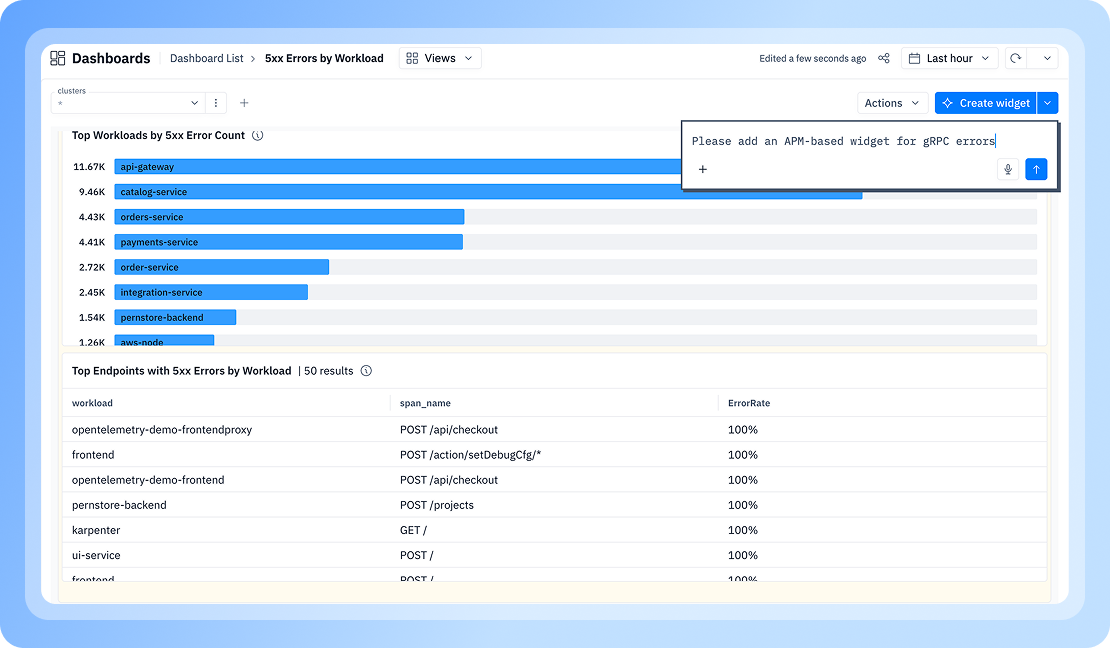
Agents investigate well, and chat is a genuinely excellent surface for it: ask, narrow, find the answer, done. It's reasonable to assume that once you can just ask, a static view starts to look like overhead. Most of the category made that same assumption.
The reasoning breaks because investigation and monitoring are two different jobs. Investigation is conversational and ephemeral, the thread dies once you've found the answer. Monitoring is persistent and shared: it outlives the person who built it, stays visible to people who weren't in the conversation, and is still there next Tuesday at 3am when someone else is on call. Chat is built for the first job. It structurally can't do the second.
The agent supplies the data fluency
From prompt to populated board
Building a dashboard used to require schema fluency: knowing metric names, naming conventions, and which panel types applied. That was always the real barrier, never chart types or colors. Ask Agent Mode for a dashboard and it returns a complete, populated board on the first pass, built faster than you'd build it by hand.
Ask for "the health of each workload" and the agent knows to bring in infrastructure usage, error traces over time, and error logs over time without being told which panels that requires.
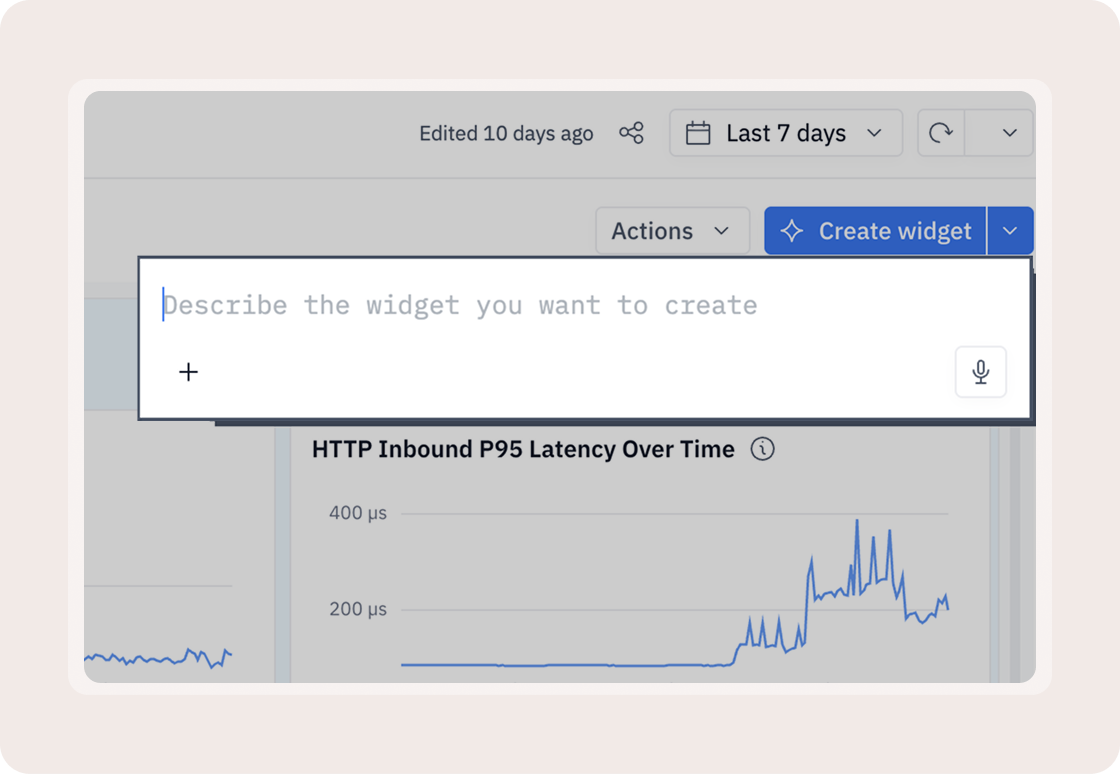
Build from anywhere
You can also build a widget with natural language inside an existing dashboard, no need to rebuild the board, or send a chart the AI assistant generated straight to a dashboard with its query intact using Add to Dashboard.
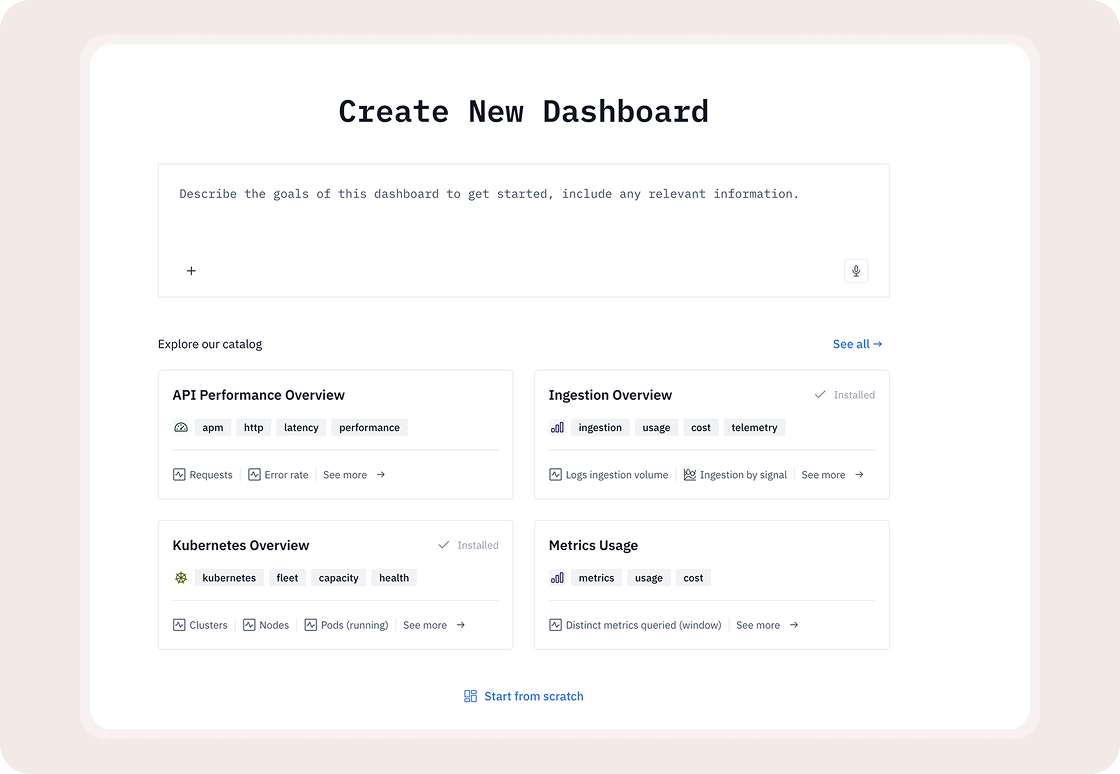
For teams that want a starting point, the dashboard catalog is previewable against your own data before you commit, including a new APM pack covering API performance, service detail, gRPC, DNS health, and dependencies.
Built to stay organized at scale
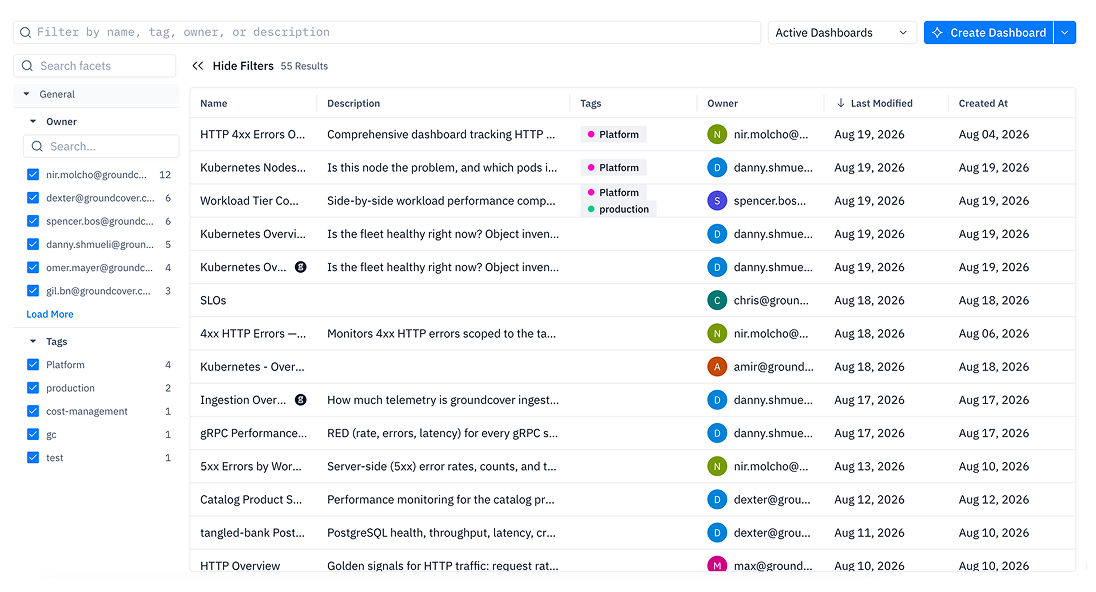
Large dashboard libraries used to become unnavigable, and variables broke across data sources with mismatched label conventions as the normal case, not the exception. Search now spans names, tags, owners, and descriptions, and tags keep a set organized and pullable directly from Slack.
Variables can be applied to specific widgets for finer control, and custom mapping lets one variable resolve to whatever each source calls the field, instead of forcing a duplicate dashboard per source. Associated Values carries this further: selecting a cluster automatically narrows the workload variable to workloads that actually live in that cluster.
Nothing is ever really gone
An overwritten dashboard used to just be gone. Now version history with revert, archive and restore, and a stale-version notice when someone else saves while you're viewing all exist so a dashboard is never a single bad save away from lost work. A synced crosshair across time-series widgets keeps multi-panel investigation aligned, and dashboards export to PDF, with individual widgets exporting to PNG, for reporting outside the platform.
A visualization layer expressive enough for the agent to reach for
Control the presentation
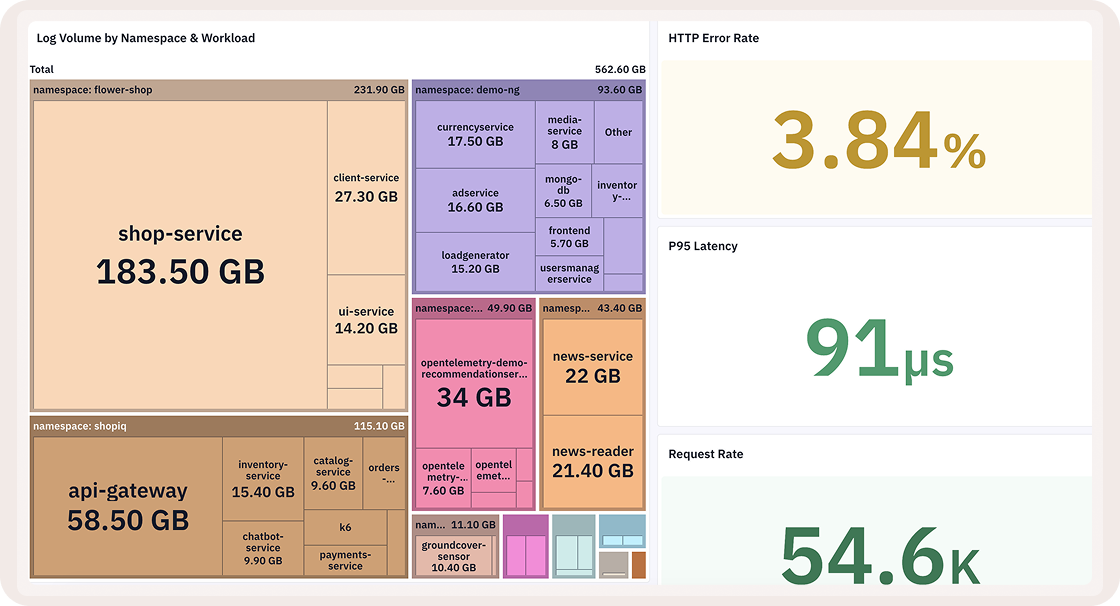
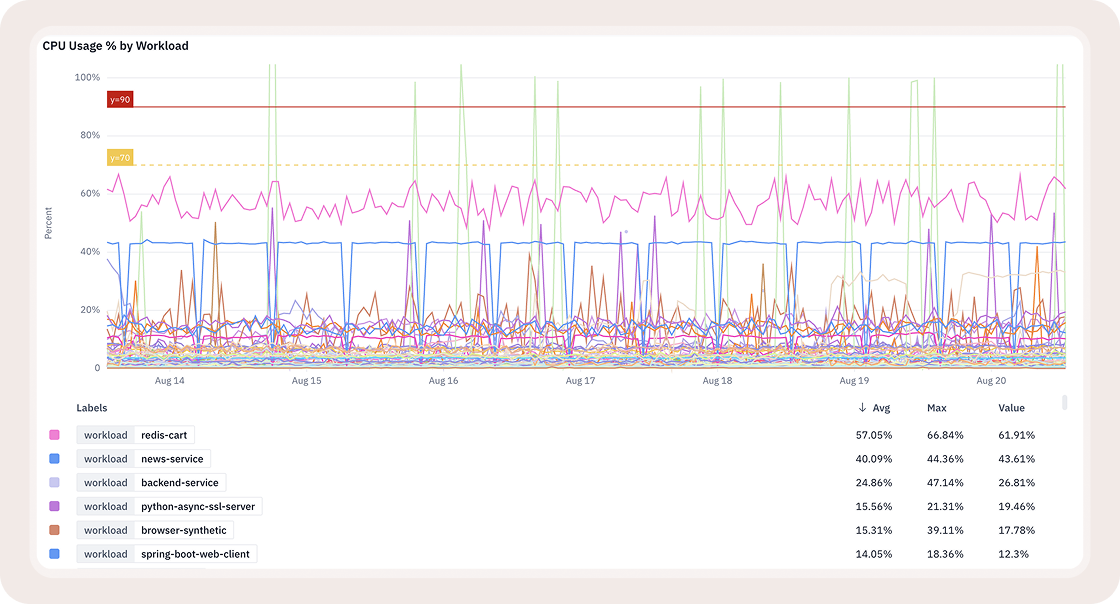
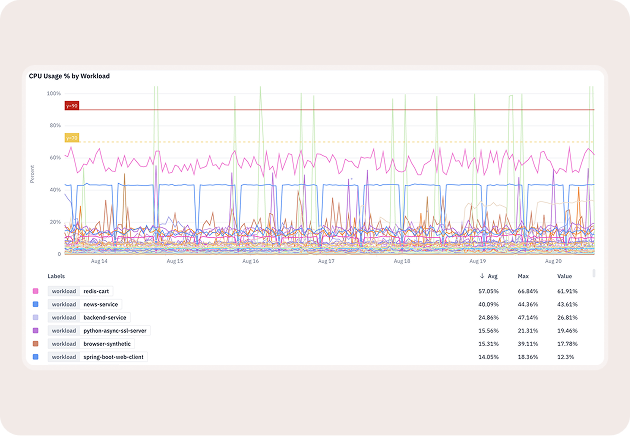
Thresholds as reference lines or bands, with optional labels and Error/Warning/OK/Info severity coloring, solid or dashed, up to ten per widget, the SLO primitive customers requested.
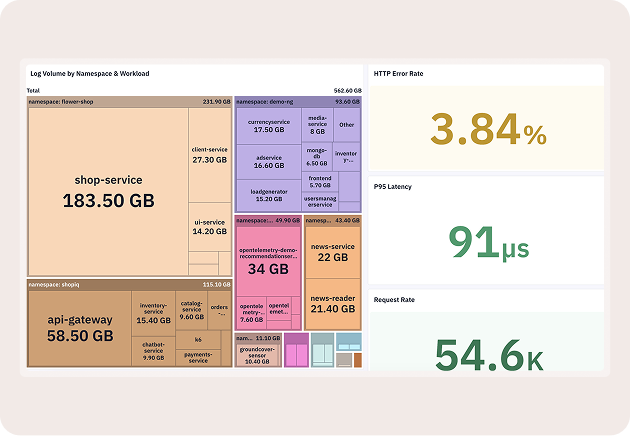
Treemap for hierarchical share-of-total across many categories.
Conditional formatting on stat tiles: comparison or range rules applied to text or background, up to ten per widget, first match wins.
Y-axis control: scale, min, max, always-include-zero, log scale, plus decimal and metric-format controls.
Compare and investigate
Legend modes: compact, table, or hidden, with Avg/Min/Max/Sum/Value stat columns. Time offset per query, so today's request rate overlays the same metric from a week ago on one chart. Multiple queries and arithmetic formulas combined in a single widget.
Copy link on any widget or section, producing a URL that scrolls to and highlights it.
Hover drill-down from a table row into Explore, for either aggregate analysis or the underlying raw rows.
Built for how dashboards actually get used
- Every panel is wired to live data, not a snapshot, so what you see now is what's true now.
- Thresholds, treemaps, and conditional formatting built in, no separate BI tool required.
FAQ starters
Common questions about groundcover Dashboards.
Yes. Full dashboards export to PDF, and individual widgets export to PNG.
Yes, up to ten of each per widget. For conditional formatting, first match wins when multiple rules could apply.
Yes. Version history includes revert, plus archive and restore, so a dashboard is never a single bad save away from lost work.
You get a stale-version notice if someone else saves while you're viewing, so you're not silently overwritten without knowing.
Custom mapping lets one variable resolve to whatever each source calls the field, instead of forcing a duplicate dashboard per source. Associated Values takes this further: selecting a cluster automatically narrows the workload variable to workloads that actually live in that cluster.
API performance, service detail, gRPC, DNS health, and dependencies.
Yes. Ask for something like "the health of each workload" and Agent Mode returns a complete, populated board on the first pass, bringing in the right panels (infrastructure usage, error traces over time, error logs over time) without you specifying which panels that requires.
Investigation and monitoring are different jobs. Chat is conversational and ephemeral, the thread dies once you've found the answer. A dashboard is persistent and shared: it outlives the conversation that built it, stays visible to people who weren't in the room, and is still there next Tuesday at 3am when someone else is on call.
Explore More groundcover products
Discover additional groundcover capabilities that work seamlessly with Synthetics.

Application Performance Monitoring
Gain end-to-end visibility into application performance. Identify and resolve issues instantly with zero code changes.
gcQL
gcQL is groundcover's unified query language: one interface for logs, metrics, traces, events, entities, and monitors, instead of a different query model for each data type.
Monitors
A monitor is gcQL plus a threshold: the same query that powers your dashboards, watching your system continuously and turning a breach into an issue the moment it happens.
Observability
for what comes next.
Start in minutes. No migrations. No data leaving your infrastructure. No surprises on the bill.