Alerts built on the same query language you'd write by hand
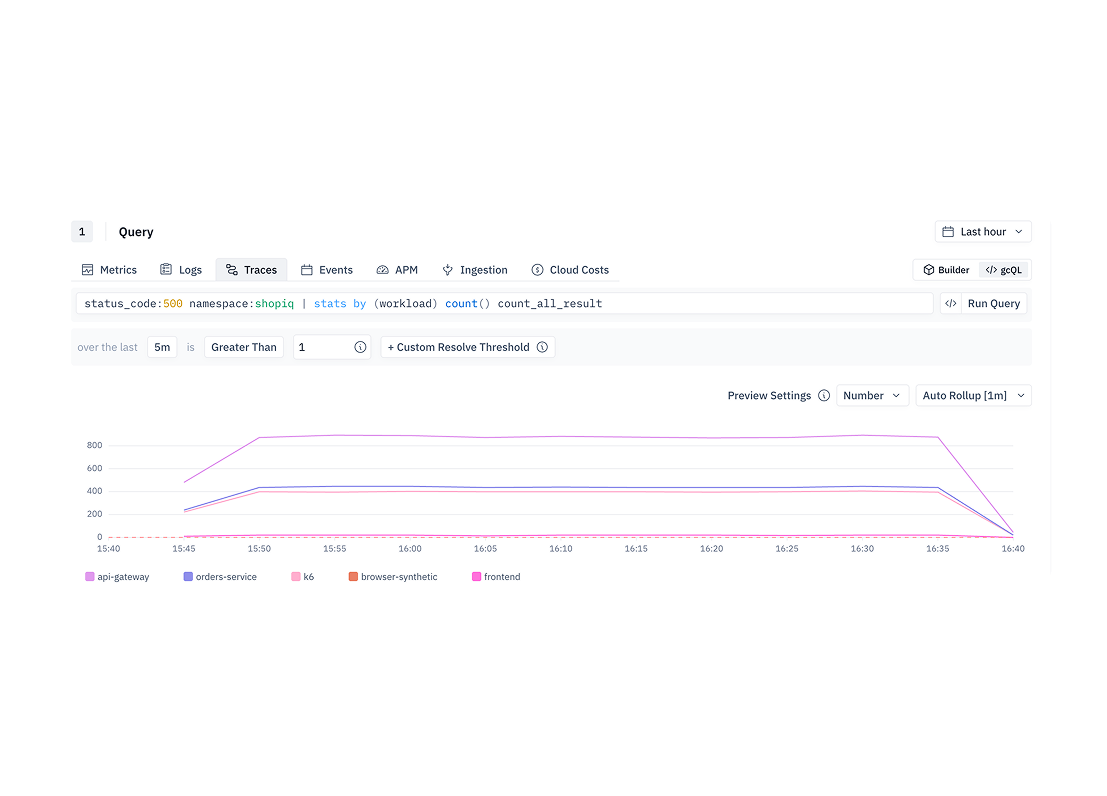
A monitor is gcQL plus a threshold: the same query that powers your dashboards, watching your system continuously and turning a breach into an issue the moment it happens.

Build it guided or write it raw.
The Monitor Wizard walks you through query, thresholds, and alert routing step by step. Or drop into gcQL code mode and write the underlying query directly.

Alerts that reach the right place.
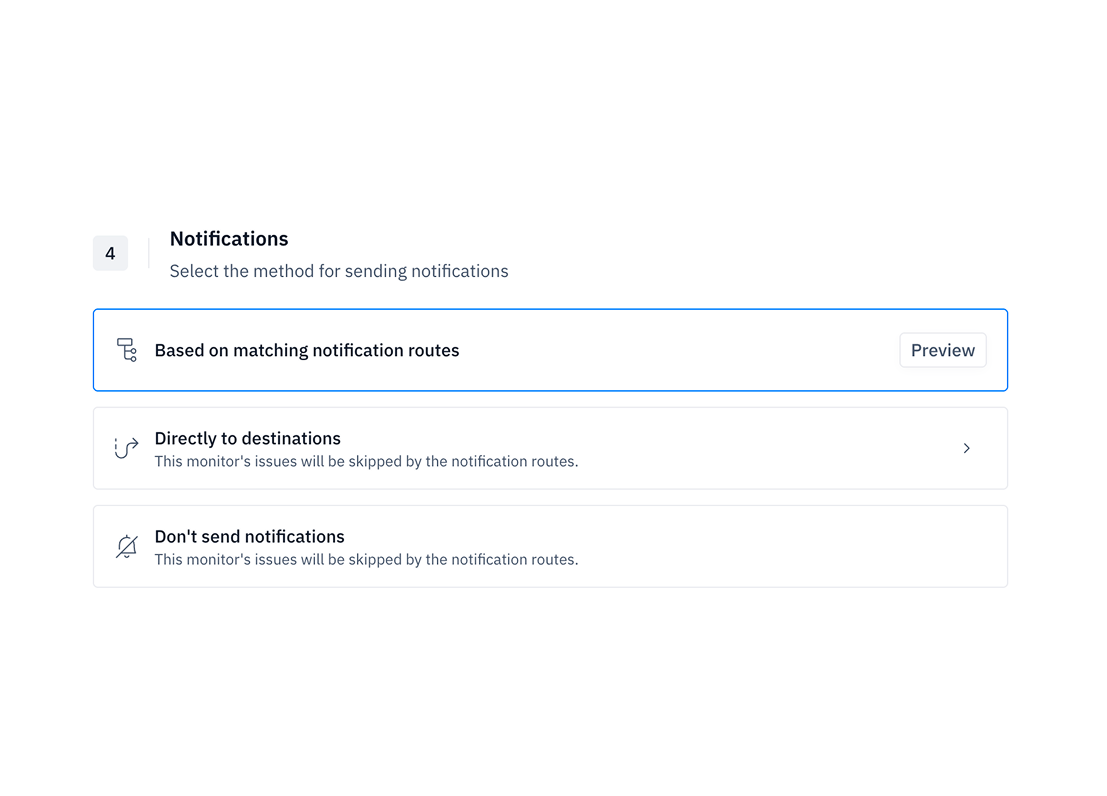
Notification Routes with a preview before you save, so you see exactly which routes a monitor will trigger, plus end-to-end testing that simulates an issue to confirm it fires where you expect.

Nothing fires quietly.
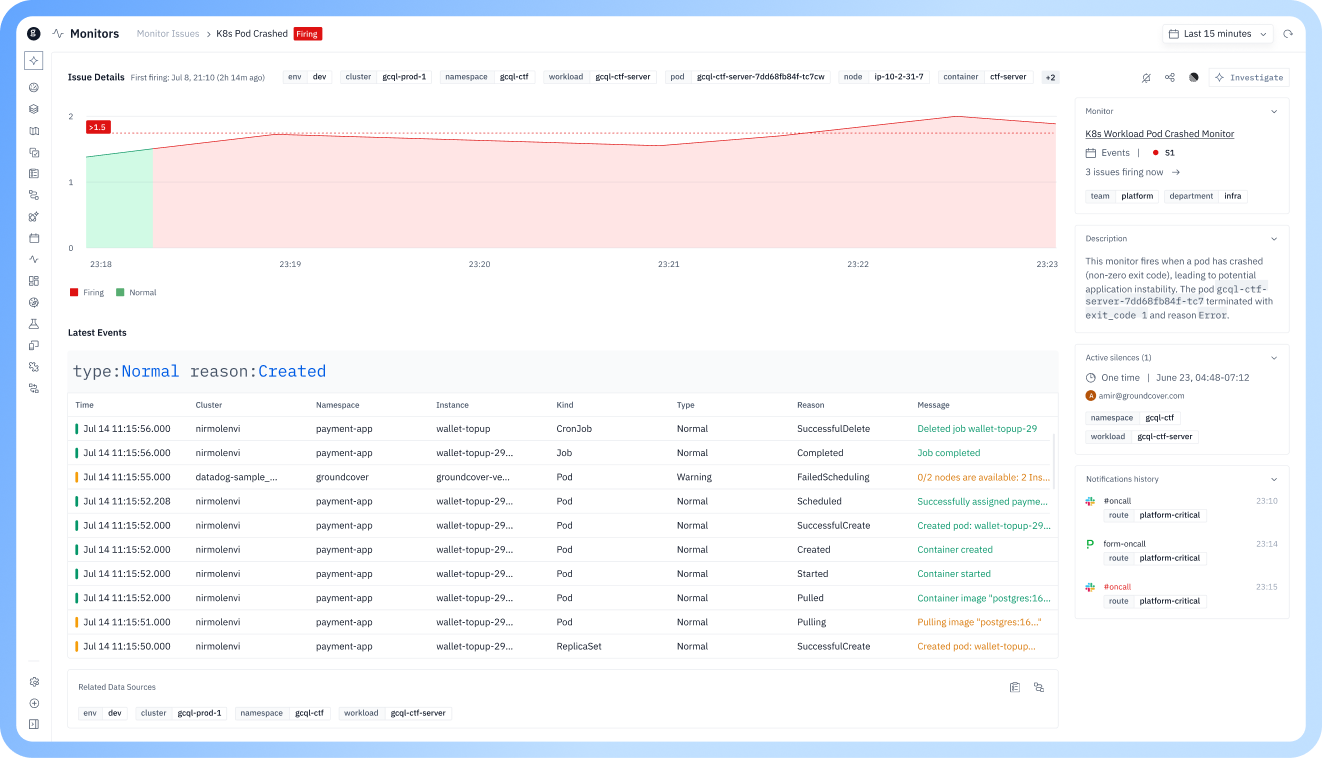
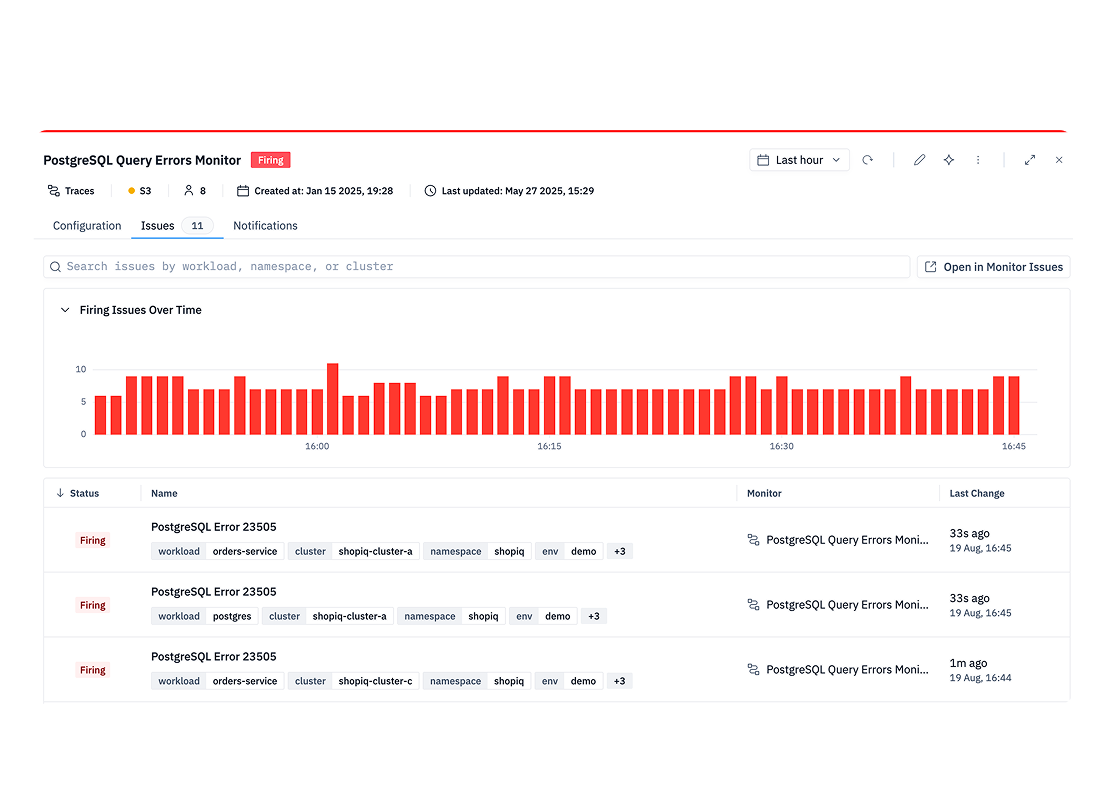
Monitor health surfaces in the drawer. No Data states get a reason and route of their own, and every issue keeps the context that produced it.
One query language, from dashboard to alert
A monitor is a gcQL query plus a threshold. The same language that builds a dashboard widget defines what a monitor watches for, so there's no separate alerting syntax to learn once you already know how to ask groundcover a question.
A wizard that tells you what will actually happen
The Monitor Wizard shows a live preview of which Notification Routes will fire based on your current configuration, before you save anything. Pongo2 templating lets issue titles and summaries pull in dynamic values like {{ labels.namespace }} or {{ values }}, with autocomplete so you're not cross-referencing docs to remember the variable name. End-to-end testing simulates an issue against your monitor so you can confirm the right routes and the right connected apps receive it, before it's live against real data.
Alerts that land where the work already happens
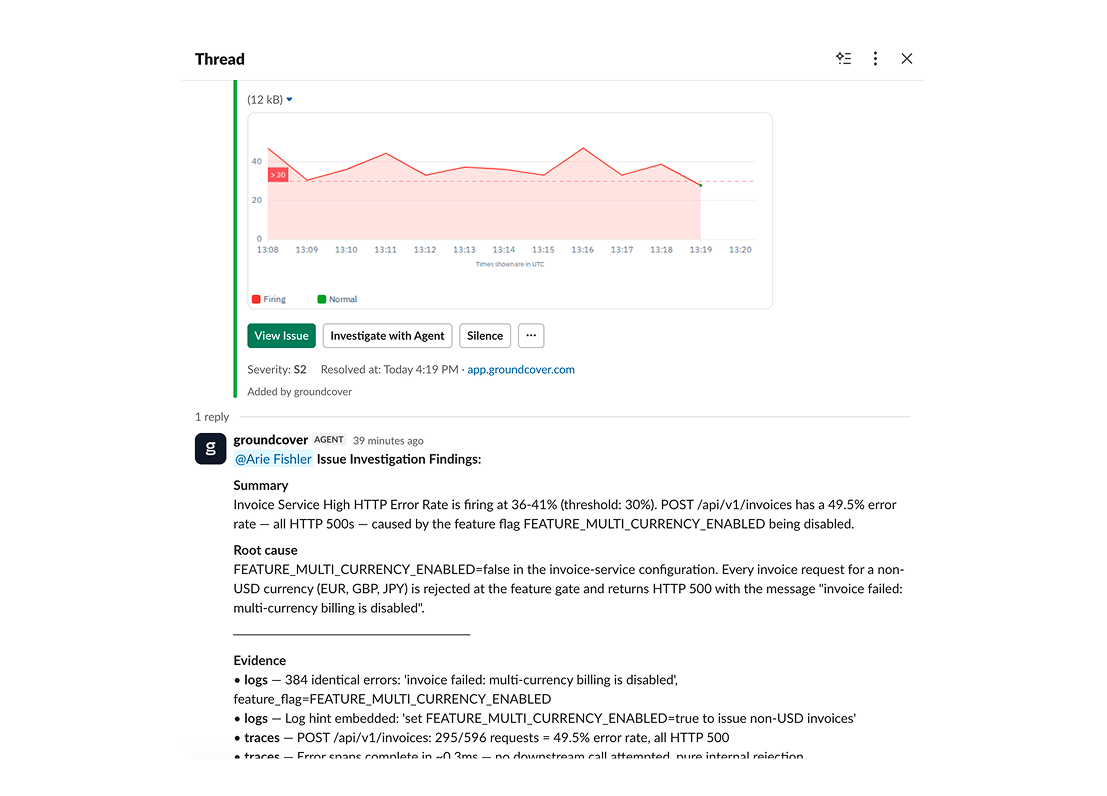
The Slack Connector routes monitor notifications to the right channel and lets the groundcover agent investigate with the full thread as context, so an alert in Slack isn't a dead end. The Linear Connector turns a firing issue into a ticket automatically, and feeds Linear's own history back into root cause analysis. The same issue view that lives in the product now shows up in Slack when a monitor fires, so investigating doesn't require a tab switch.
Built to be trusted, not just built to fire
Monitor health now surfaces directly in the drawer, and a No Data state comes with a reason and its own routing, instead of silence that looks the same as "everything's fine." The Monitor List page is the filterable hub for every monitor you run: name, creation date, live issue count, and firing status at a glance, with saved team views and facets so a large monitor library doesn't become its own investigation.
Manage monitors as code
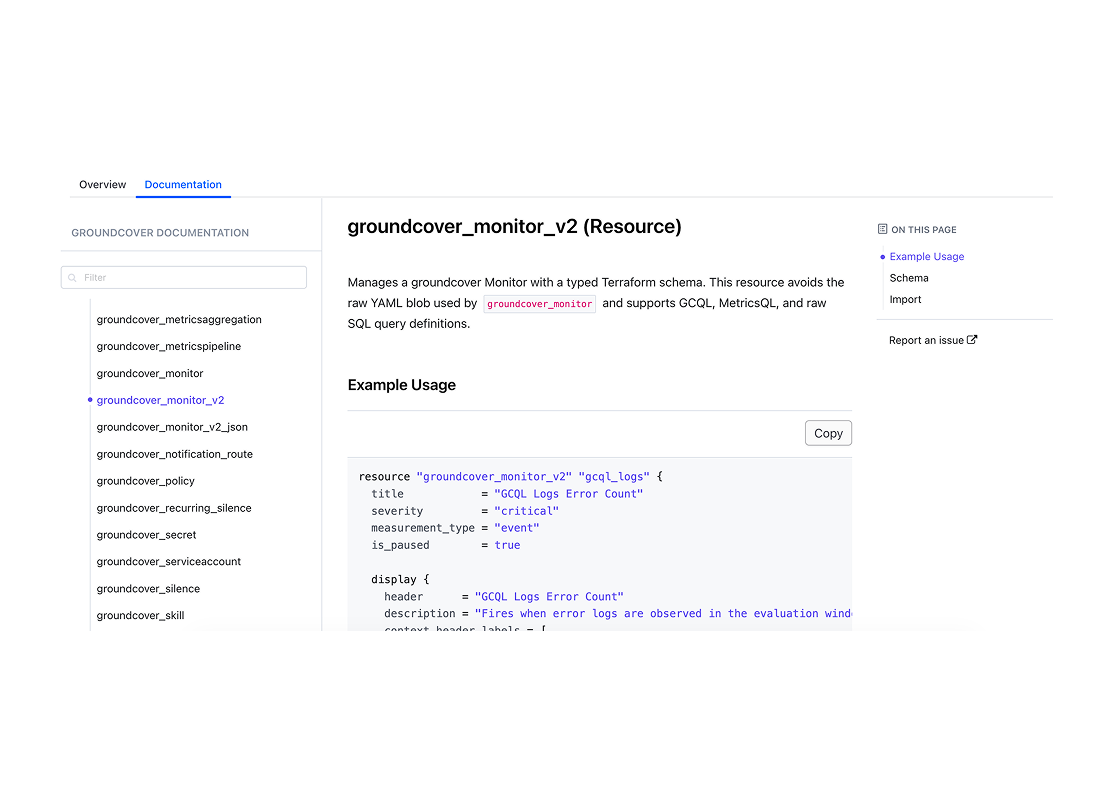
Monitors are now a first-class typed Terraform resource instead of a YAML blob, so teams that manage their observability configuration as infrastructure can version, review, and roll out monitors the same way they do everything else.
Built to be trusted
- Every monitor is a gcQL query plus a threshold, no separate alerting language
- Notification routing verified before you save, not
discovered after a missed alert
FAQ starters
groundcover Query Language (gcQL) Reference - Link
End-to-end testing simulates an issue against your monitor so you can confirm the right routes and connected apps receive it, all before it's live against real data.
Yes. Monitors are a typed Terraform resource, not a YAML blob, so you can version, review, and roll them out the same way you manage the rest of your infrastructure as code.
No Data gets its own state, its own reason, and its own routing, instead of silence that looks the same as "everything's fine." You'll know a monitor stopped receiving data instead of assuming it's healthy just because nothing fired.
Notification Routes handle this, and the Wizard shows you a live preview of which routes will fire based on your current configuration before you save. You can also run end-to-end testing that simulates an issue to confirm it lands in the right Slack channel or Linear project before the monitor goes live.
Yes. The Wizard walks you through query, thresholds, and routing step by step, but you can drop into gcQL code mode at any point and write the underlying query directly.
A dashboard widget shows you a query's results when you look at it. A monitor is that same gcQL query with a threshold attached, so it watches continuously and turns a breach into an issue the moment it happens, instead of waiting for you to check.
Explore More groundcover products
Discover additional groundcover capabilities that work seamlessly with Synthetics.

Real User Monitoring
Monitor real user sessions, detect frontend errors, and improve performance, with all user data kept private inside your cloud.
gcQL
gcQL is groundcover's unified query language: one interface for logs, metrics, traces, events, entities, and monitors, instead of a different query model for each data type.
Dashboards
Ask Agent Mode for a dashboard and get a fully populated, live board on the first pass. Every panel stays there next Tuesday at 3am, shared with the whole team, whether or not you're in the room.
Observability
for what comes next.
Start in minutes. No migrations. No data leaving your infrastructure. No surprises on the bill.