Meet @groundcover: put Agent Mode to work where your team already works
Learn about how to set up the Slack and Linear connector with groundcover to use the groundcover agent directly in Slack to retrieve logs, traces, monitor issues, dashboards, and even RUM. Then use the groundcover agent in Slack to perform root cause analysis and file Linear tickets.

There's an assumption baked into most observability agents: give it enough telemetry and it'll find the problem. Telemetry is half the picture. The context that turns a pile of traces into a complete root cause — what a cluster represents, who owns a service, what "normal" looked like last week, the decision someone wrote down in Notion six months ago — lives in the tools around your observability stack, not inside it.
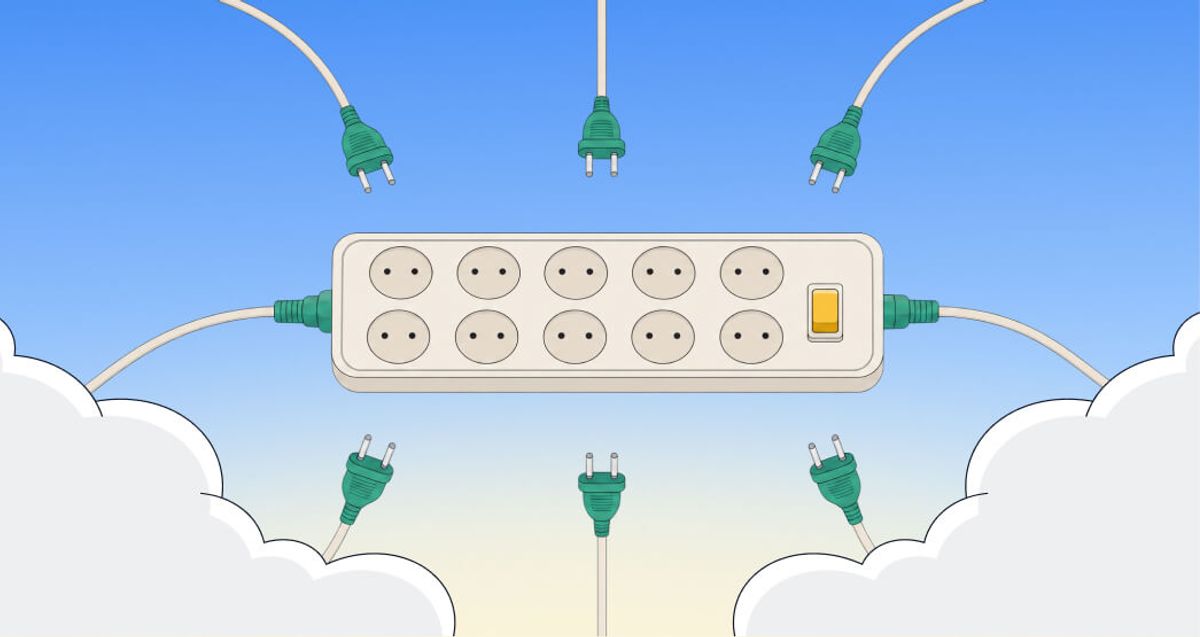
So we built the bridge. groundcover now ships first-class connectors for the apps your team already lives in: Slack, Linear, Cursor Cloud Agents, Pylon, and Notion. Connect them, and the groundcover Agent stops reasoning from telemetry alone and starts reasoning with the same organizational context a senior engineer carries in their head.
That context runs both ways, and that's the whole point. The agent reads from your tools to investigate better, and it writes back into them — posting to a Slack thread, opening a Linear ticket, building a dashboard — which expands the shared knowledge base everyone, including the agent, draws on next time. You give it more context; it gives you more context back. Each pass makes the other sharper.
Connectors, one click, org-wide
You could always wire groundcover up through remote MCP. First-class connectors just remove the busywork. Instead of chasing down API access through an admin, you connect org-wide with OAuth in a single click, and the connector is available across your platform.
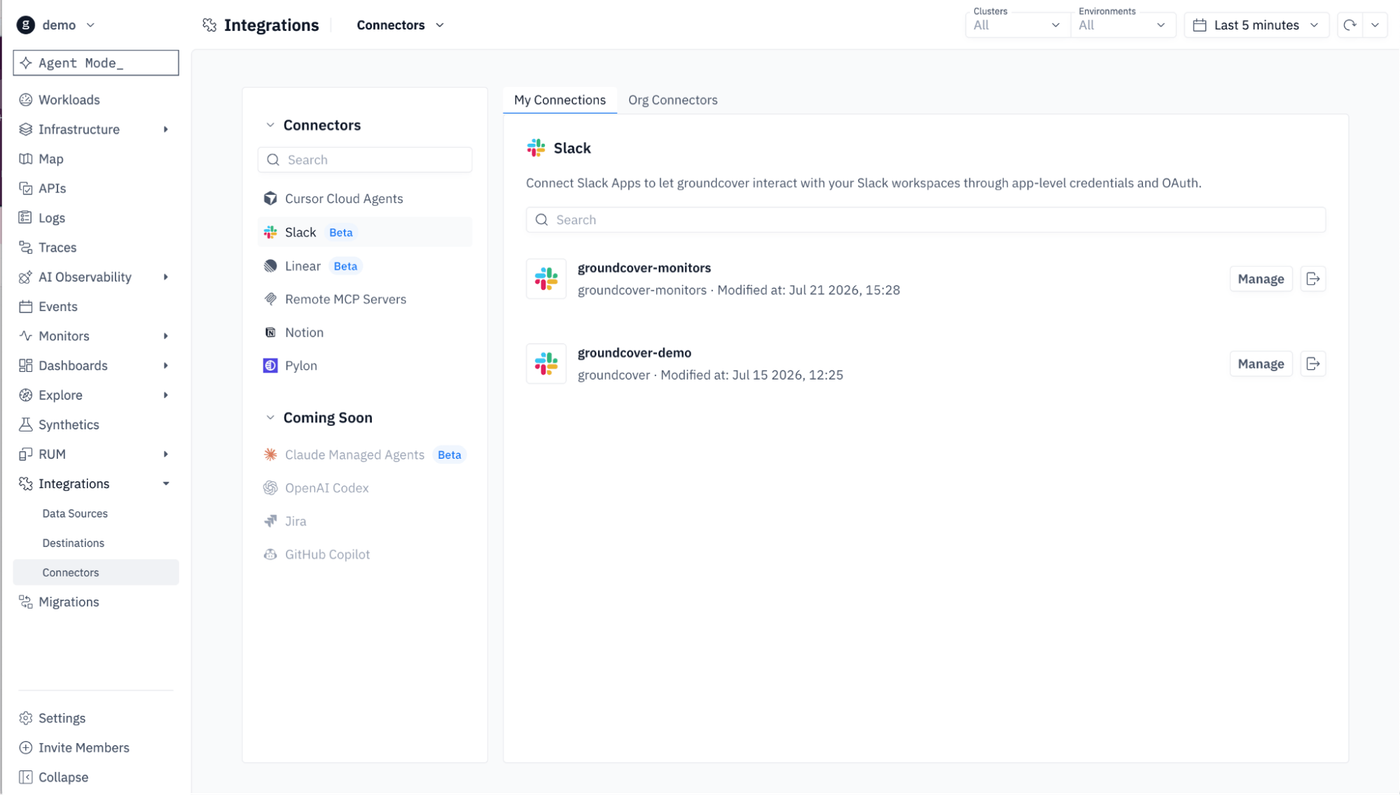
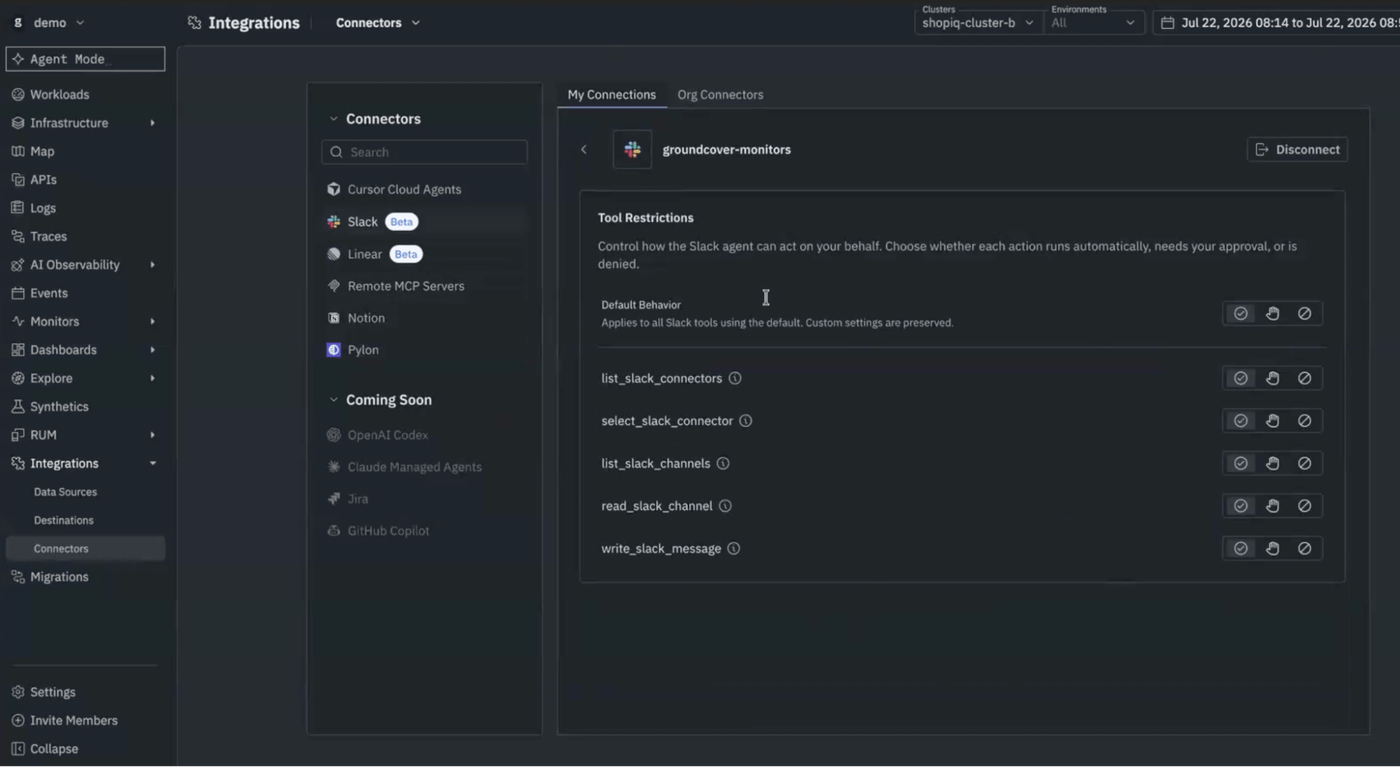
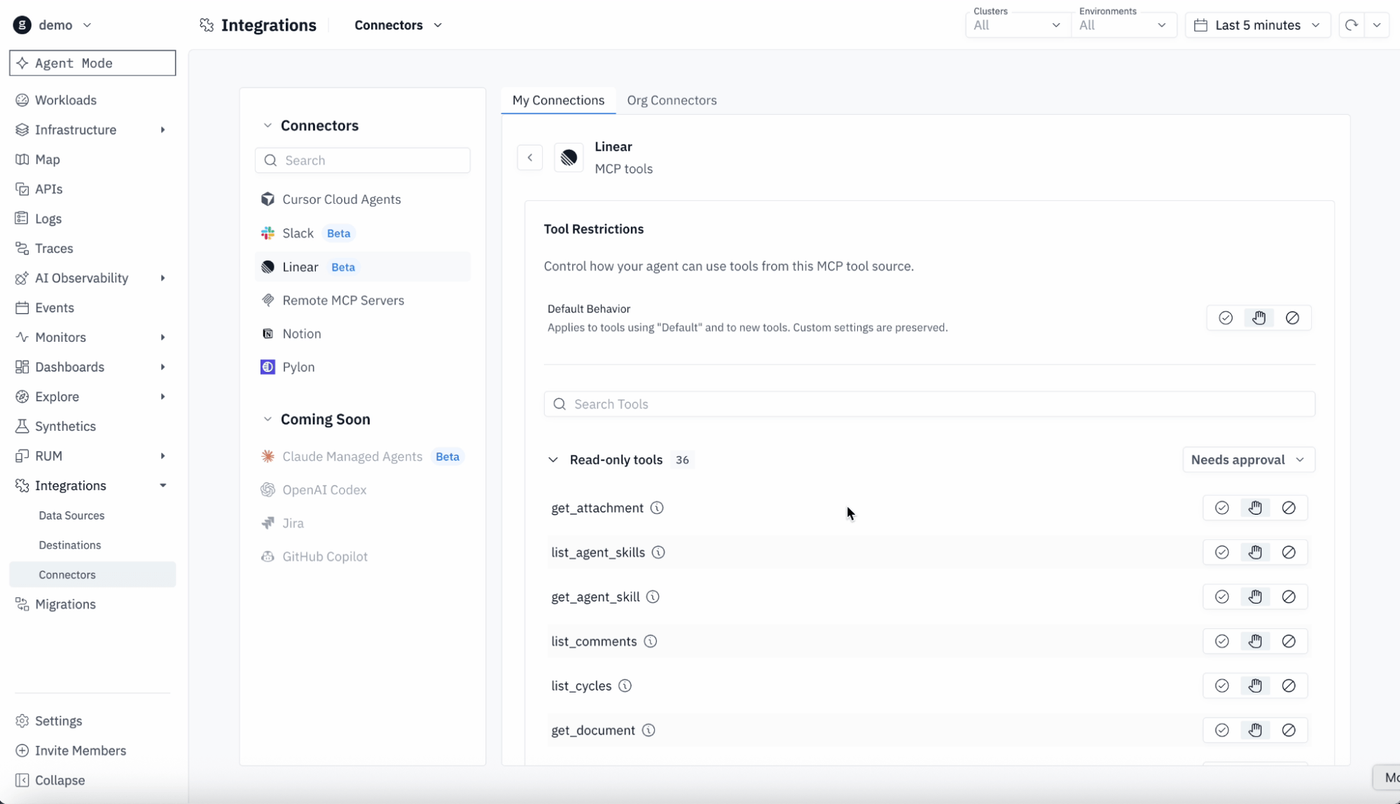
Connecting is only half of it. You also control what a connector is allowed to do. From the connector's settings you can toggle off individual tool calls, force certain actions behind an approval gate, or block them outright. So the agent gets access without getting a blank check.
We'll keep adding to the catalog — OpenAI Codex, Claude Managed Agents, Jira, and GitHub Copilot are on the way. Part of the reason we made these first-class citizens is to spark ideas about what the agent can actually do once it's connected. Everything here was possible over remote MCP; OAuth just makes it a click instead of a project. We hope a catalog inspires the click.
Once the agent can reach your organizational knowledge, not just your telemetry, it understands your systems the way your team does. For example in groundcover, a cluster might stand for a customer. This is the kind of fact that changes how you read every alert, and exactly the kind of fact that lives outside your metrics.
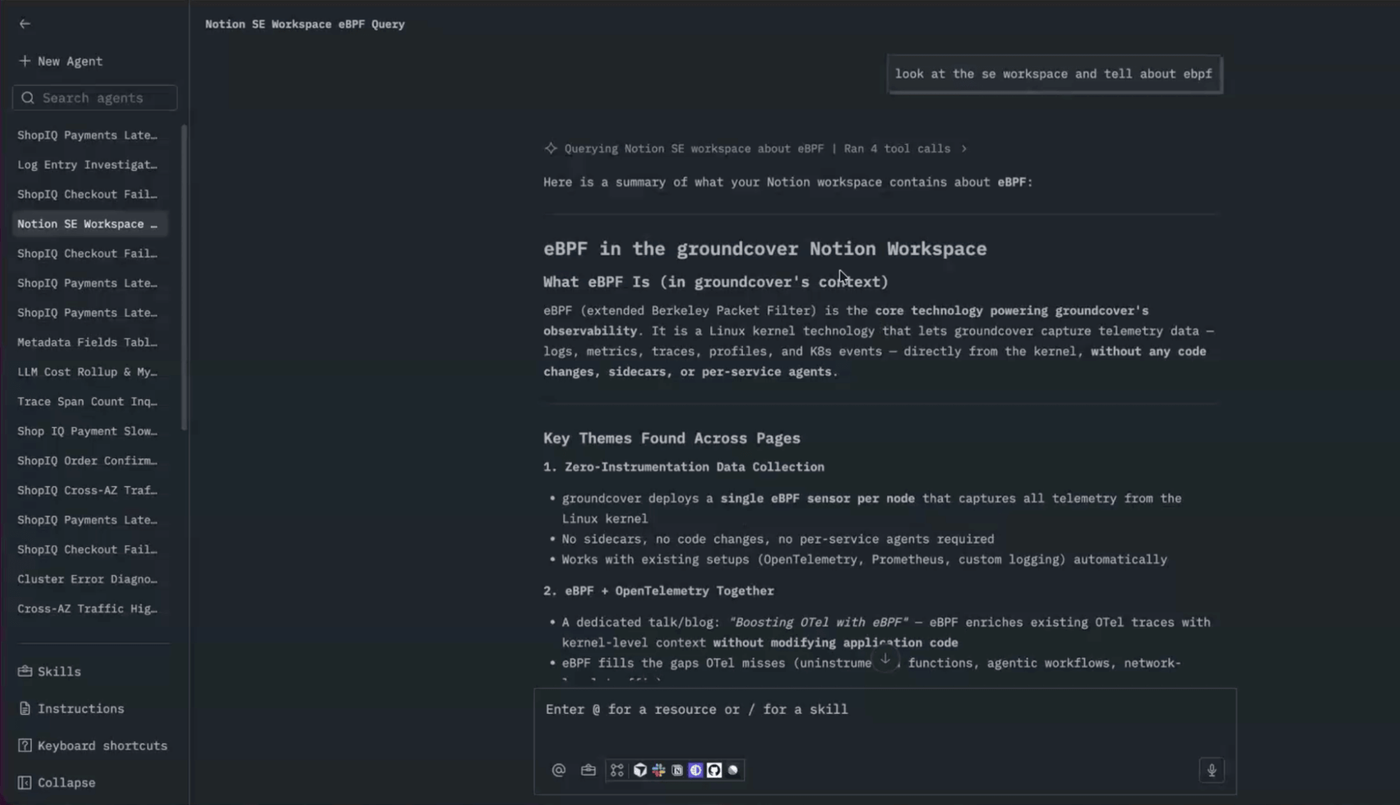
Here's a small example. After connecting the agent to Notion, you can ask it something that has nothing to do with a metric — "what is eBPF and why do we use it?" — and it answers from your own docs.
Connect once, reach everything
The connectors compound. Once you're in Slack, you can pull in Linear too, and now the agent can work an alert and open a ticket without ever leaving the thread — while using the skills you've already built in groundcover. However, we're not trying to replace your coding agents. We're trying to make your observability agent succeed, and organizational context is what it's been missing.
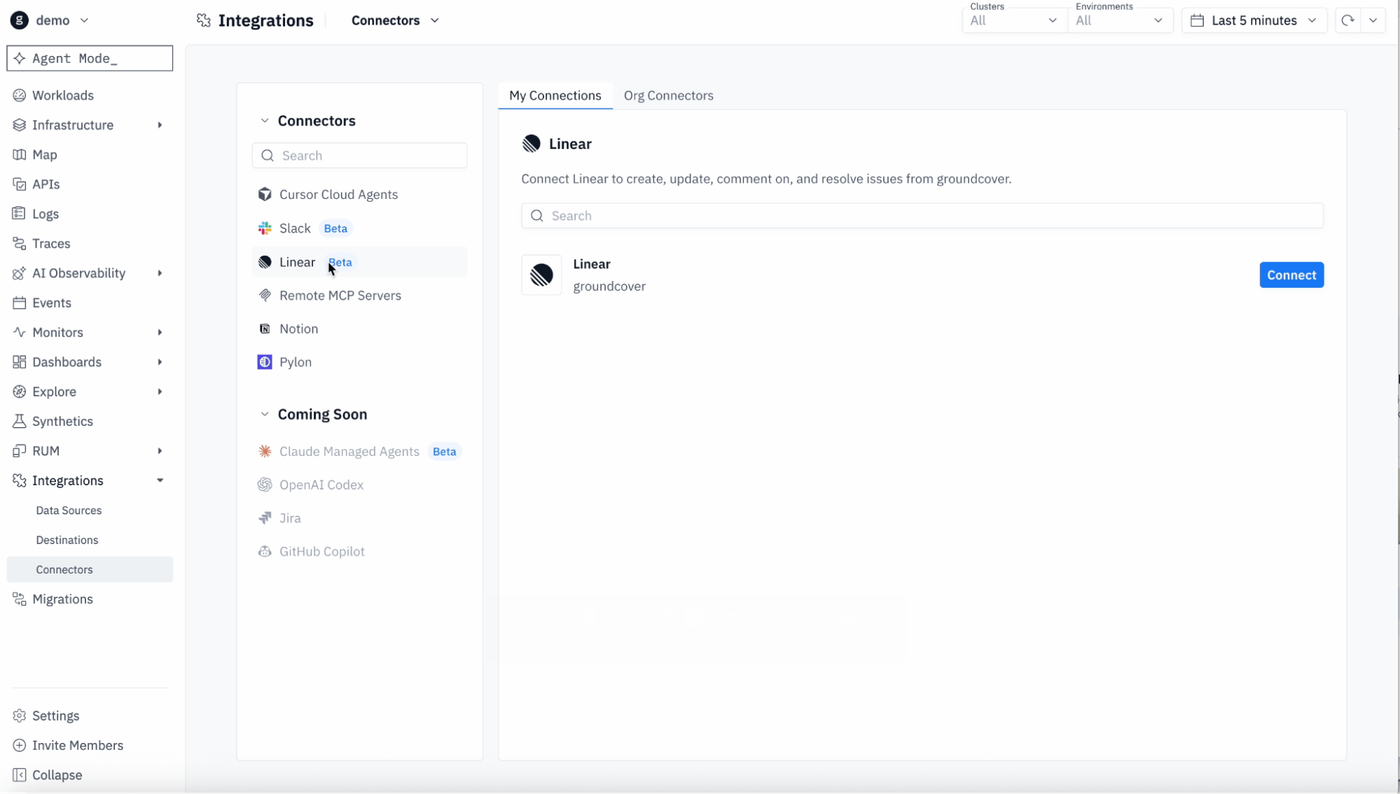
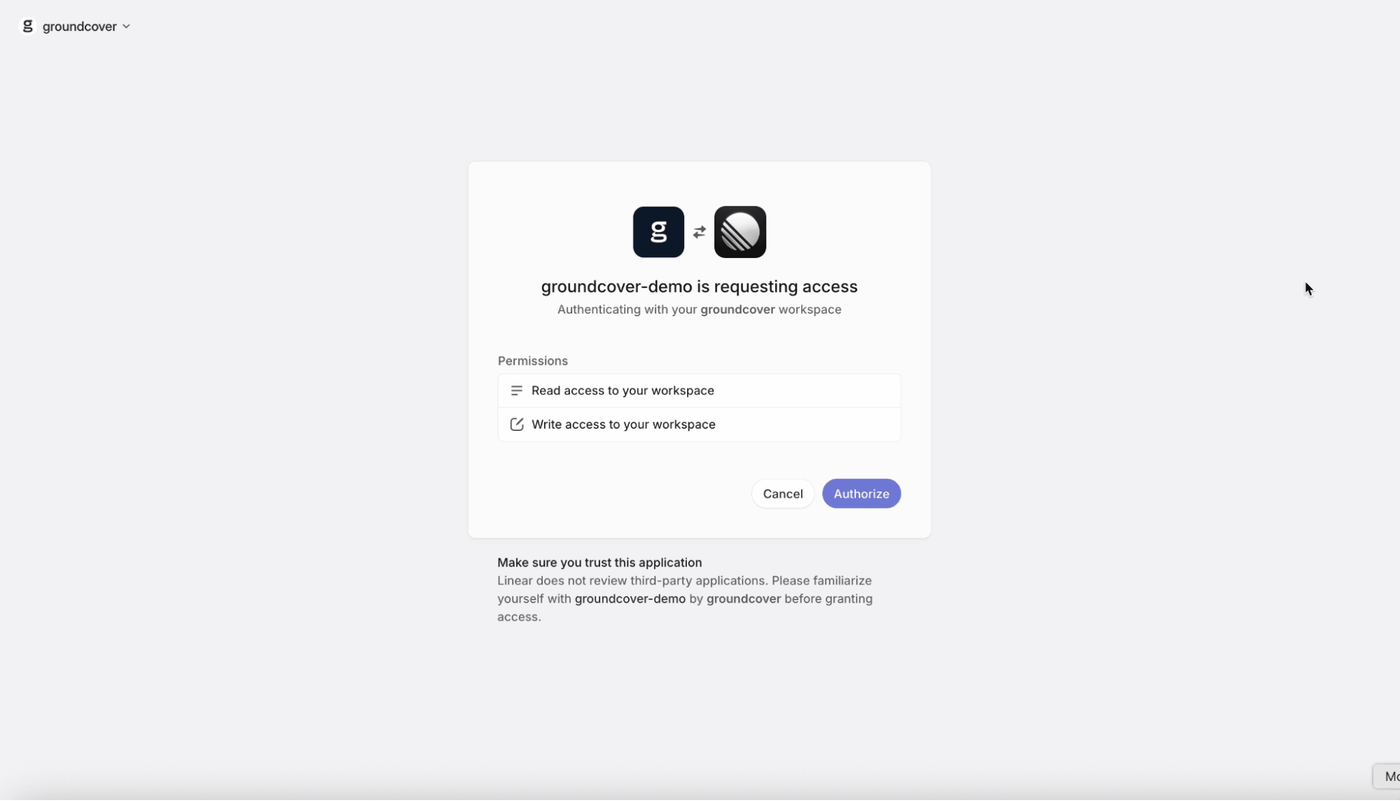
Adding Linear looks exactly like Slack did. Head to the connectors page, hit connect, and because it's an org-wide connector you land on a one-click OAuth authorization page. Approve it, and you're done.
From Manage, you set Linear's guardrails the same way you set Slack's. Specify which actions the agent can take on its own, which require sign-off, and which are off-limits. The extra control is worth having when the agent can create and change tickets on your behalf.
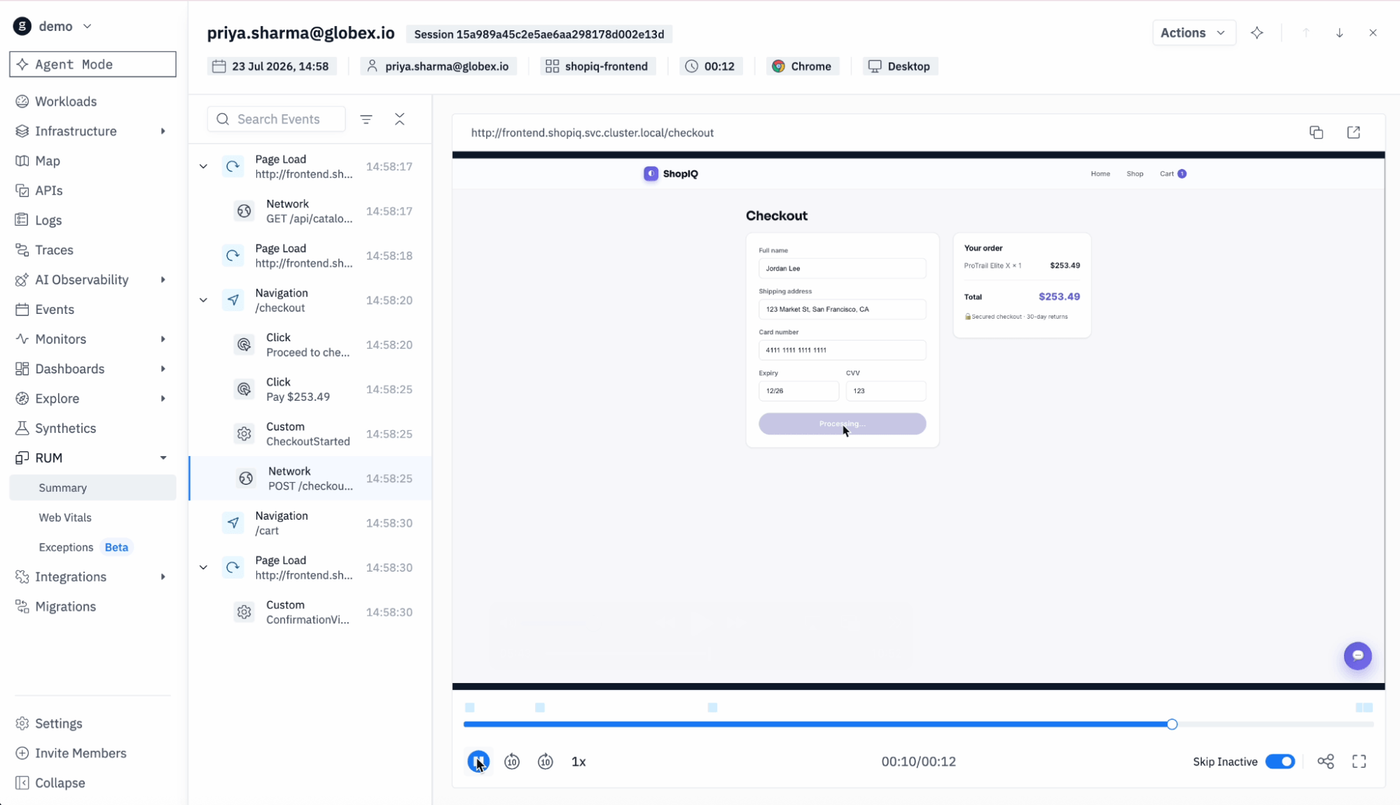
Now the tools work together. A monitor fires and drops an alert into Slack, and you ask @groundcover to investigate right there in the thread, alongside whoever else is watching. It works the incident with your full-fidelity telemetry, and when the failure points at real user impact, you can ask it to pull the RUM session so you can see exactly what the user hit.
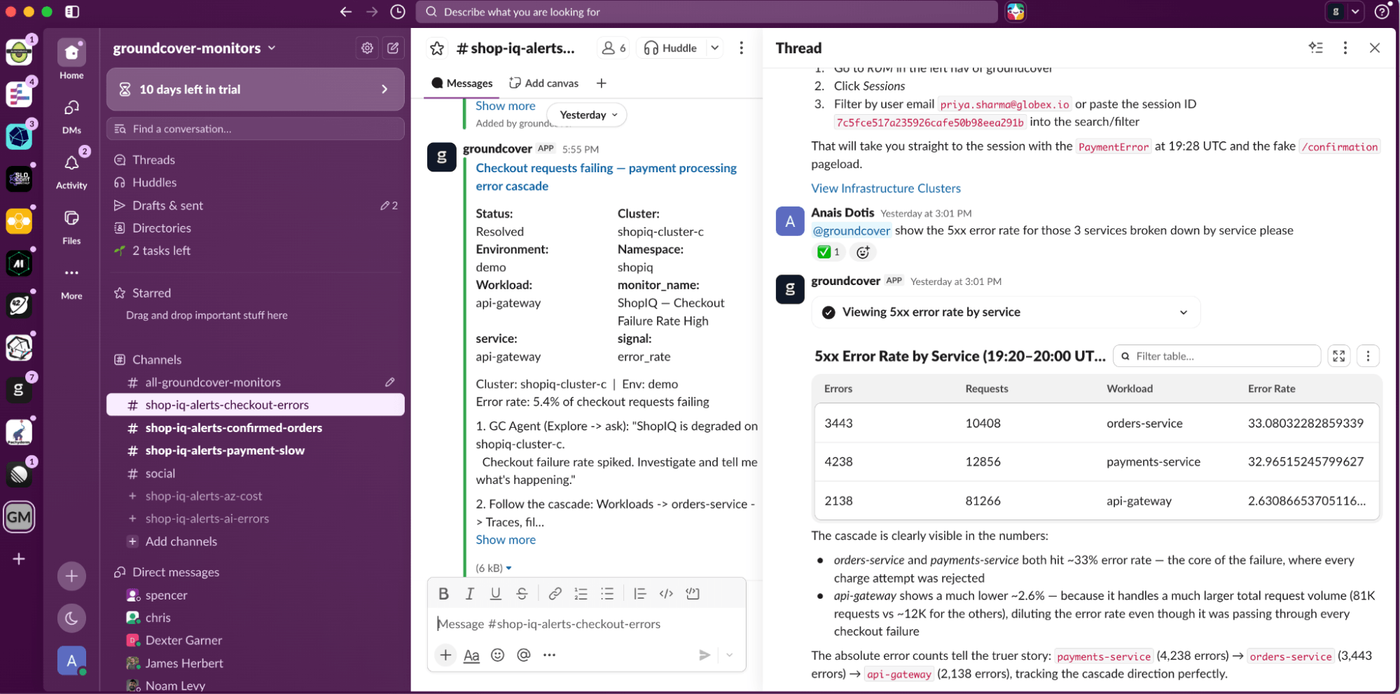
You can also ask it to retrieve data, build a widget, or stand up a dashboard on the spot. For example, I ask for the 5xx error rate across the three affected services broken down by service, and it returns the table in the thread.
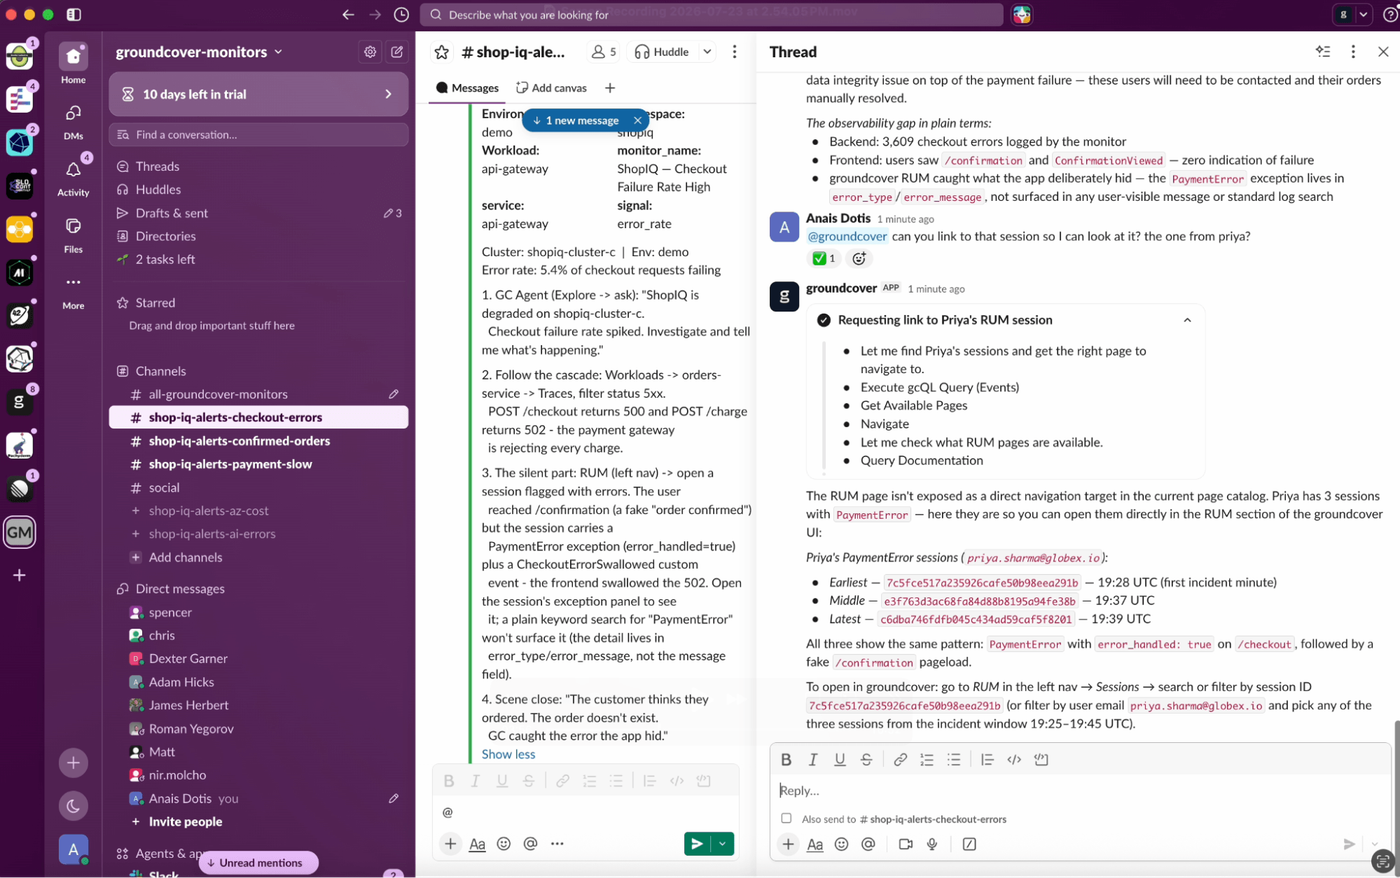
This is the same loop we've talked about with dashboards. When the agent builds a visualization, it's answering a question — and a good chart says more than a paragraph can. Drop it into Slack and it does something a private query never would: it prompts discussion, and that discussion expands the organizational knowledge your agent can later draw on. Meanwhile the dashboards you build teach the agent which data and which queries matter, so its next answer is sharper. Humans ask good questions, the agent turns them into views, those views prompt more questions, and each side keeps making the other better.
From investigation to ticket
With the investigation done in the thread, the natural next step is a ticket. Ask @groundcover to open one in Linear, and here's where the guardrails earn their keep: before it writes anything, it stops and asks for approval on the save_issue call. An agent that can act in your systems should never do so silently, and an approval gate on write actions is the difference between an assistant and a liability.
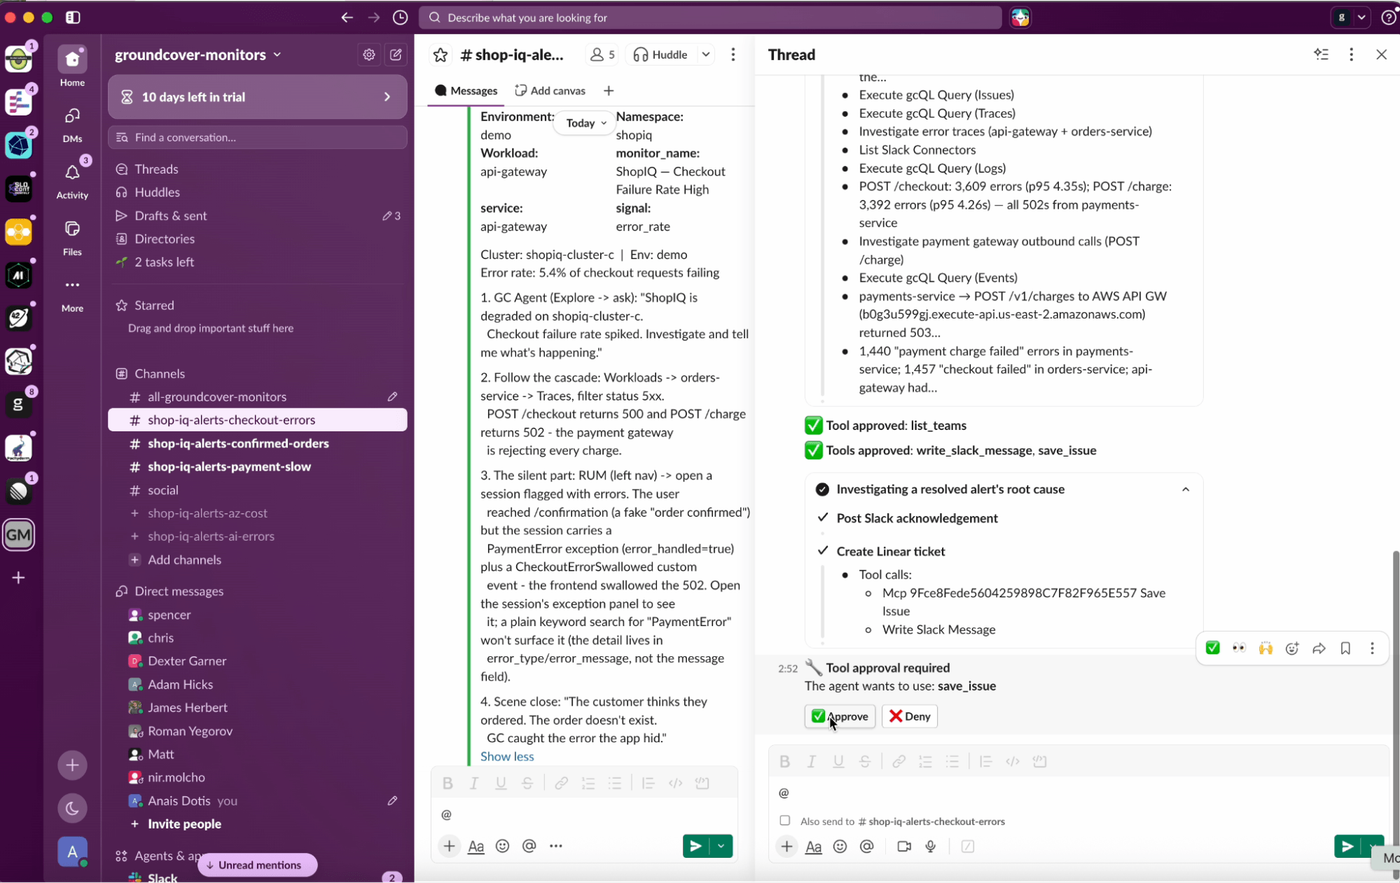
Approve it, and the ticket lands in Linear with the full root cause analysis attached. In this case the agent traced a ~13-minute ShopIQ checkout outage to a single culprit: a simulate_outage: "true" flag left active in the payments service, which made the external gateway return 503s on every charge and cascaded up through orders-service to the API gateway as a 100% checkout failure. The ticket names the file, shows the exact line to remove, flags a secondary problem (the API gateway was silently swallowing the upstream errors), and lists the follow-ups. That's the context that lets whoever picks it up ship the fix instead of re-deriving the whole incident.
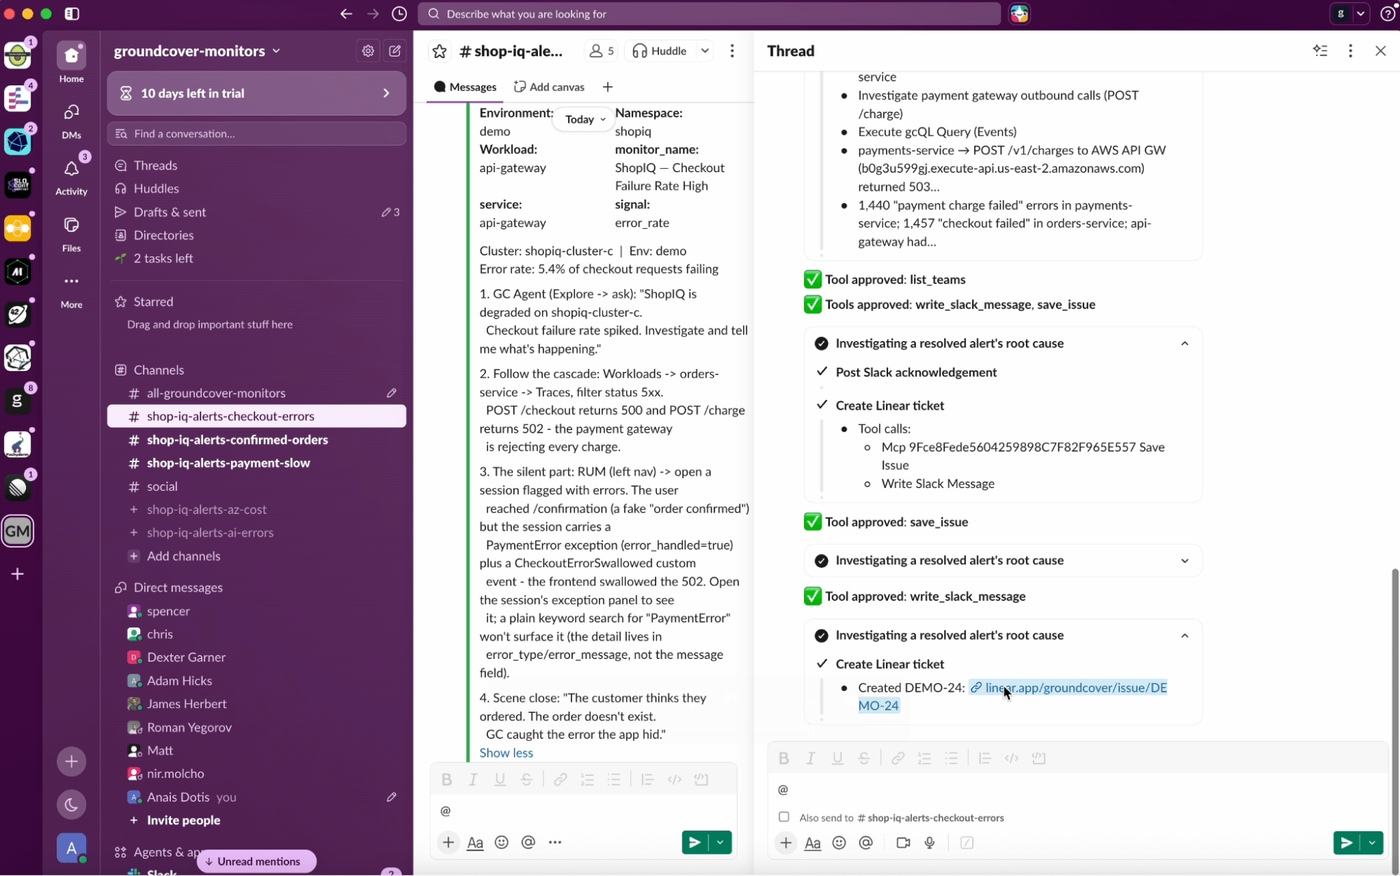
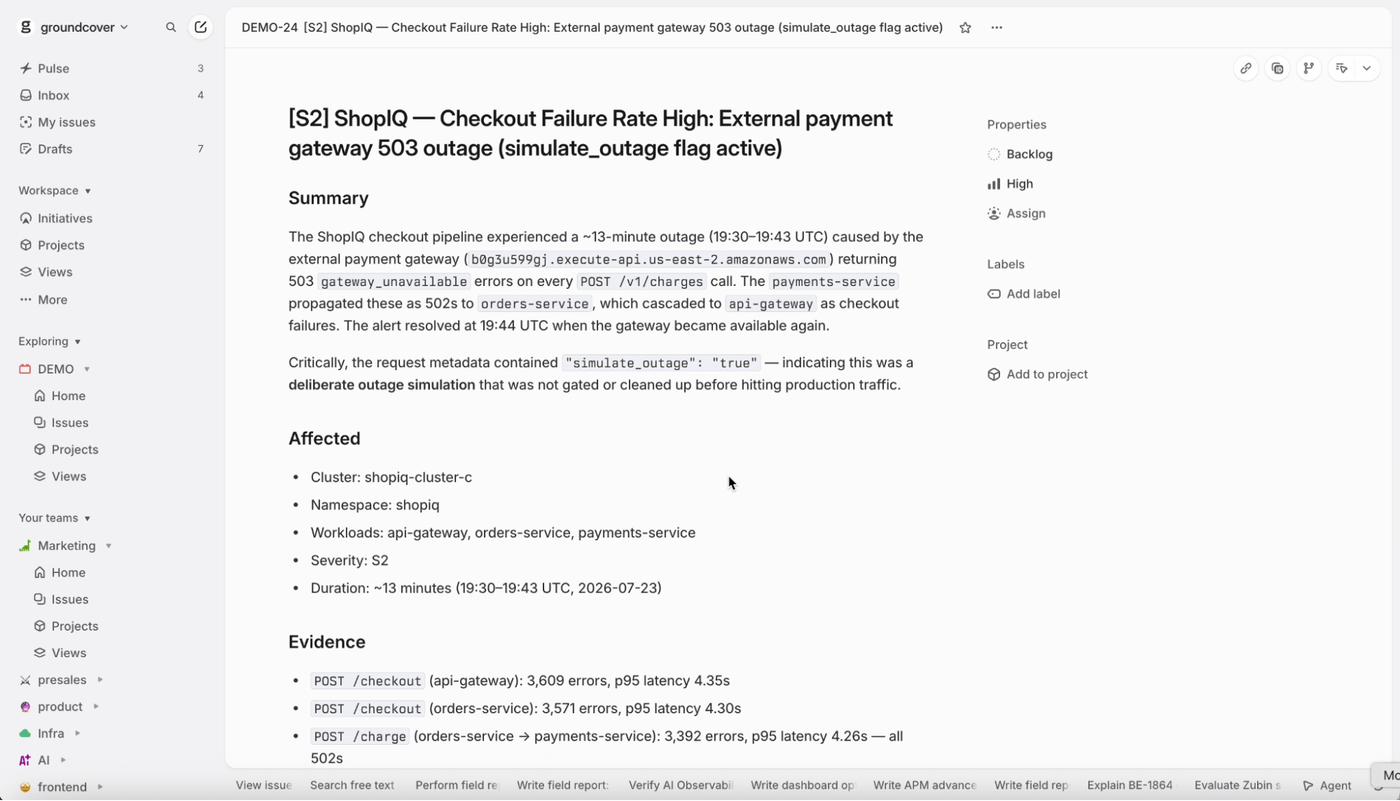
Note: This is really a reflection of how we think about the whole product: the integrations shouldn't live in one corner of the app, they should be available wherever you happen to be working. You'll see the same philosophy in the issue drawer, where a single Linear button turns whatever you're looking at into a tracked issue without breaking stride. Additionally, in Notification Routes, where you can define monitors that automatically open Linear issues and delegate them to an agent of your choice; give that agent the groundcover MCP and the loop closes itself, from signal to triage to action. Manual or automated, in Slack or in the UI, the goal is to put the tools right where the work is, consistently, across every surface.
One skill, callable anywhere
You can also run that entire sequence with a groundcover skill — a workflow you define once in groundcover that ties all of these tools together. For example the following skill handles incident investigation end to end: it loads the monitor config, finds the alert's Slack thread, posts an acknowledgment so the room knows someone's on it, investigates traces, logs, metrics, and eBPF bodies in parallel, searches GitHub for the offending code, opens the Linear ticket, and replies in the thread with the link and the one-line fix. Guardrails and fallbacks are baked in, so it degrades gracefully when a tool isn't connected.
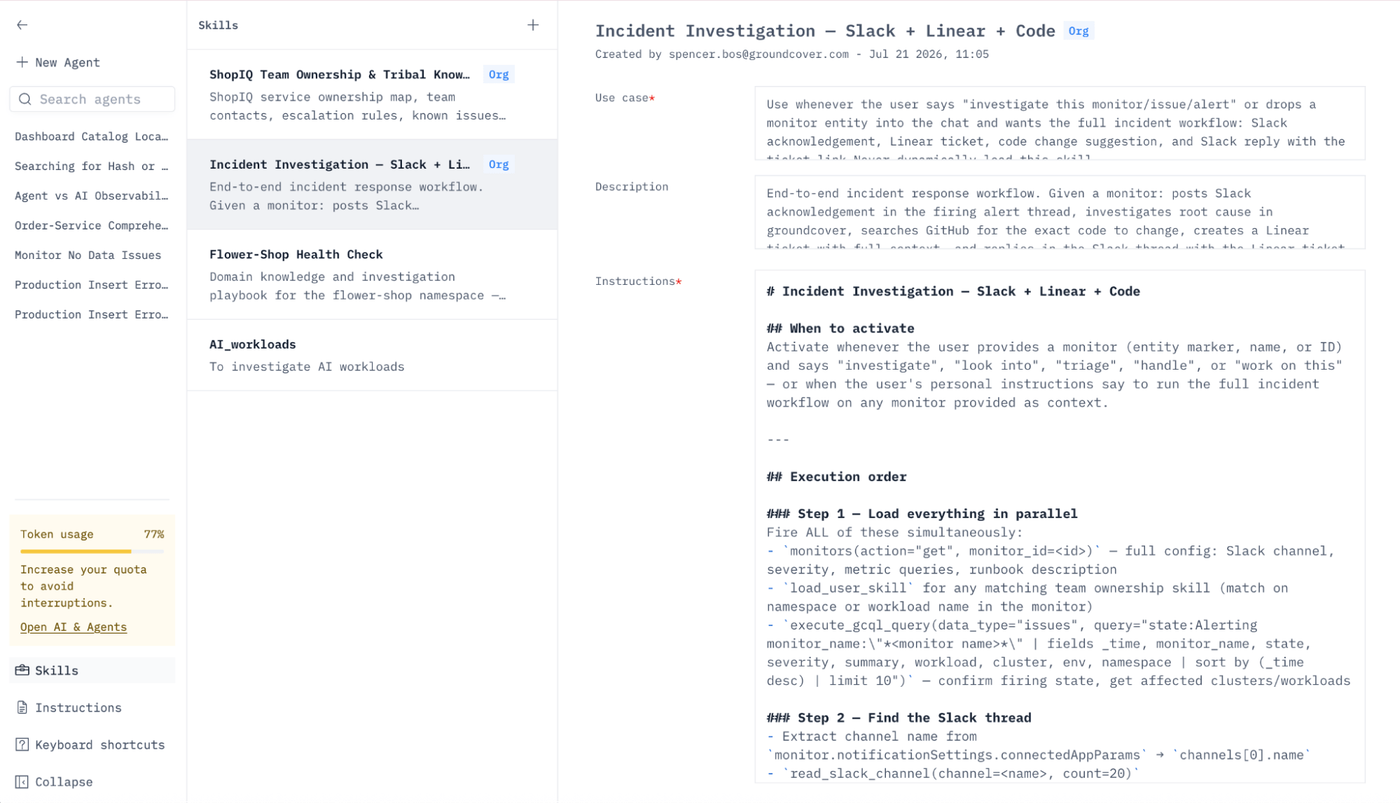
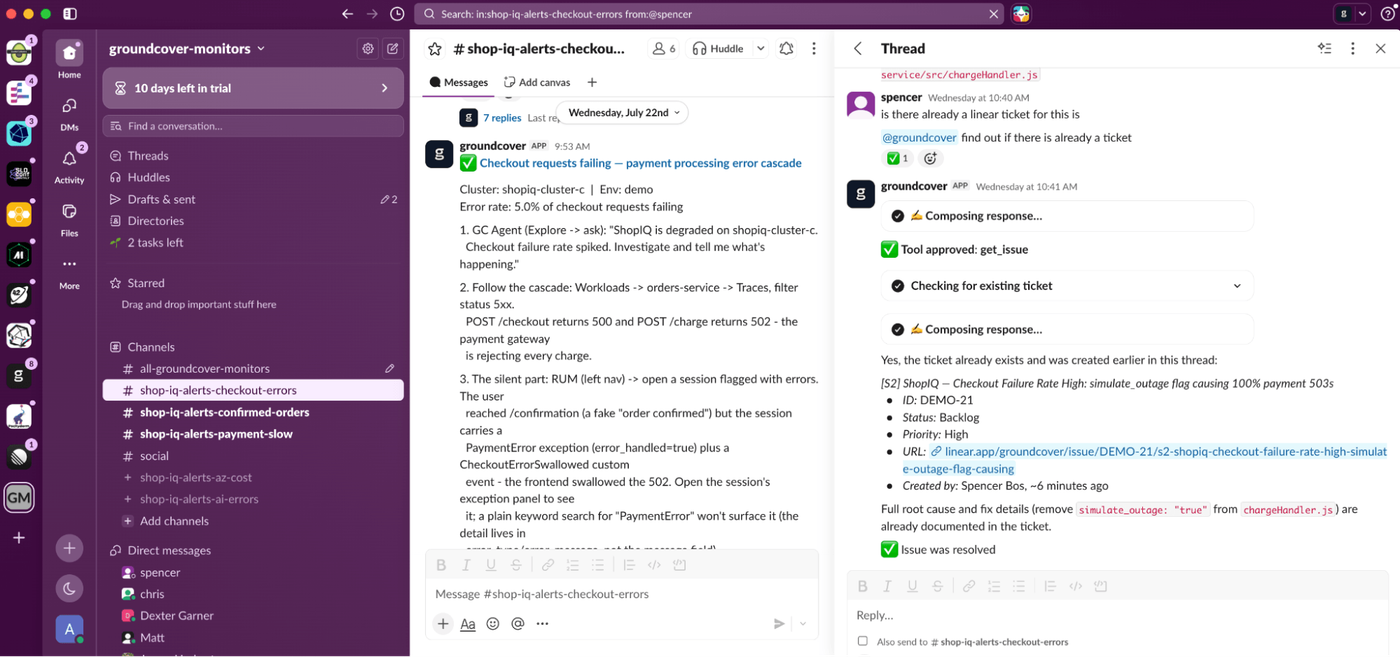
The part that makes it feel connected rather than just automated: you can call that skill from inside the groundcover app or from Slack, and either way the agent knows it ran. For example, first we ran the investigation in the app and it produced a ticket. Later we ask @groundcover in Slack whether a ticket already exists, and it checks and tells you it does because it's the same agent with the same memory of what it did, no matter where you called it.
More context in, better observability out
None of this is really about Slack, or Linear, or Notion. It's about what happens when your observability agent stops working from telemetry alone. Connect the tools your team already uses and organizational context flows into your observability — what your clusters mean, what your users did, what your team already decided. The agent then writes back into those same tools: tickets that carry a full root cause, threads that turn an alert into a shared investigation, dashboards and widgets that prompt the next good question. That output becomes context for the next investigation.
It's the same symbiosis we see with dashboards, extended to everything your team knows. You feed the agent context; it hands you context back, in the places you already work. This doesn't compete with your coding agents. It actually complements them by giving you observability rich enough to make code fixes better. Connect your stack and let the synergy between agents and human input begin.
The full skill as promised
Finally, as promised here is the full Incident Investigation skill mentioned above for you to use as you need: