Kubernetes Memory Metrics: What to Track, and Best Practices



Memory is a resource that Kubernetes workloads can’t live without. By extension, tracking Kubernetes memory metrics – meaning data related to memory utilization within Kubernetes environments – is vital for maintaining adequate performance. It can also play a role in helping to manage Kubernetes costs by ensuring that clusters don’t include more memory resources than they need.
With all of the above in mind, keep reading for a deep dive into Kubernetes memory metrics, including what they are, why they’re important, key types of memory metrics to track, and how to work effectively with memory metrics in Kubernetes.
What are Kubernetes memory metrics, and why do they matter?
Kubernetes memory metrics are data that track memory usage within Kubernetes environments. Using memory metrics, engineers can answer questions like how much free memory is available within a cluster, which workloads are consuming the most memory, and how memory consumption changes based on fluctuations in workload requests.
For the sake of clarity, note that memory metrics in this context refer to volatile memory (also known as random access memory, or RAM). Applications use volatile memory to store data temporarily when they are running. It’s distinct from persistent memory (in other words, disk usage or storage space), which applications use to store data that they need to retain for extended periods or between application re-launch events.
The type of volatile memory we’re discussing in this article is also distinct from cache memory, which is a special type of volatile memory that exists within CPUs. Servers can use cache memory to store data that they access very frequently, but most of the data that workloads need to store while they are operating is housed in RAM, not in the CPU cache.
How Kubernetes collects memory metrics across nodes and Pods
Kubernetes collects memory metrics by aggregating data from multiple components running throughout the cluster. At the node level, the operating system and container runtime track memory consumption for processes, containers, and system services. The kubelet, which runs on every node, gathers resource usage information from the underlying container runtime and Linux control groups (cgroups). These mechanisms provide detailed visibility into how much memory is being allocated, consumed, cached, or reserved by workloads and system processes. The kubelet exposes this information through metrics endpoints that can be accessed by monitoring systems and other Kubernetes components.
At the Pod and container level, Kubernetes tracks memory usage based on the resources consumed by the containers that make up each workload. Kubernetes associates memory metrics with specific Pods, namespaces, deployments, and nodes, enabling administrators to view resource consumption at different levels of granularity. Because Pods can contain multiple containers, Kubernetes tracks memory usage for both individual containers and the aggregate Pod. These metrics help operators understand which workloads are consuming the most memory and identify potential issues such as memory leaks, inefficient applications, or overprovisioned resources.
To make memory metrics available across the cluster, Kubernetes commonly relies on the Metrics Server and external monitoring platforms. The Metrics Server periodically collects resource usage data from the Kubernetes cluster’s kubelets and provides a lightweight API used by commands such as kubectl top and by autoscaling features. For more advanced monitoring, tools such as Prometheus can scrape kubelet and node metrics directly, storing historical data and enabling detailed analysis, alerting, and visualization.
Together, these components create a continuous flow of memory telemetry that supports capacity planning, performance optimization, troubleshooting, and automated scaling decisions.
Key Kubernetes memory metrics to track
A number of memory metrics are available in Kubernetes. Here’s a look at the most important ones:
- Memory usage: Measures the amount of memory currently consumed by a container, Pod, or node. Tracking usage helps identify workloads that are approaching resource limits or consuming more memory than expected.
- Working set memory: Represents memory actively used by applications, excluding memory that can be easily reclaimed by the operating system. It is often a more accurate indicator of actual memory pressure than total memory usage.
- Memory requests: Defines the amount of memory a workload requests when it is scheduled. Monitoring requests helps ensure efficient resource allocation and reveals workloads that may be over- or under-provisioned.
- Memory limits: Specifies the maximum amount of memory a container is allowed to consume. Tracking limits help prevent resource contention and reduce the risk of containers being terminated due to excessive memory consumption.
- Memory utilization percentage: Compares current memory usage against requested or available memory. This metric helps assess whether workloads are appropriately sized and whether additional capacity may be needed.
- Node memory usage: Measures total memory consumption across a Kubernetes node, including workloads and system processes. Monitoring node-level usage helps detect resource exhaustion and capacity constraints that could affect multiple workloads.
- Available memory: Indicates the amount of memory still available on a node for scheduling new workloads or accommodating spikes in demand. Low available memory can signal impending resource pressure.
- Page faults: Tracks the number of times an application must retrieve memory pages from disk (where they can be stored in the event that volatile memory space becomes exhausted) because they are not present in standard memory. High page fault rates can indicate inefficient memory usage and degraded performance.
- Out of memory (OOM) events: Records instances where Kubernetes or the operating system terminates a container because it exceeded available memory. Frequent OOM events are a strong indicator that memory requests or limits need adjustment.
| Memory | Description | Why it’s useful |
|---|---|---|
| Memory usage | Total memory currently being used by a resource. | Provides an overall view of memory usage and trends. |
| Working set memory | Total memory currently being used by a resource, without counting non-essential memory objects that could be deleted or freed up without disrupting the resource. | Provides insight into how much memory a workload actually needs (which may be different from what it’s currently using). |
| Memory requests | The minimum amount of memory that a workload should receive. | If a workload’s memory request is too low, it could lead to performance degradations. |
| Memory limits | The maximum amount of memory that a workload is allowed to use. | If a workload’s memory limits are too high, it might tie up memory that other workloads need. |
| Memory utilization percentage | Total amount of memory currently being used relative to the total amount available. | High memory utilization percentages signal that memory resources are running short. |
| Node memory usage | Total memory being consumed on a node. | If node memory usage approaches total memory available, workloads hosted on the node may begin to fail or experience performance degradations. |
| Available memory | Total memory that is not currently in active use. | Low levels of available memory could cause performance degradations or prevent new workloads from being scheduled. |
| Page faults | Number of times an application has to retrieve memory pages from disk. | Page faults often signal that workloads are short on volatile memory. They also correlate with performance degradations (because retrieving data from disk takes much longer than from volatile memory). |
| Out of memory (OOM) events | Number of times the Linux kernel terminated a container due to excessive memory usage. | OOM kill events reflect a lack of sufficient memory. |
Kubernetes memory requests and limits: Their impact on performance
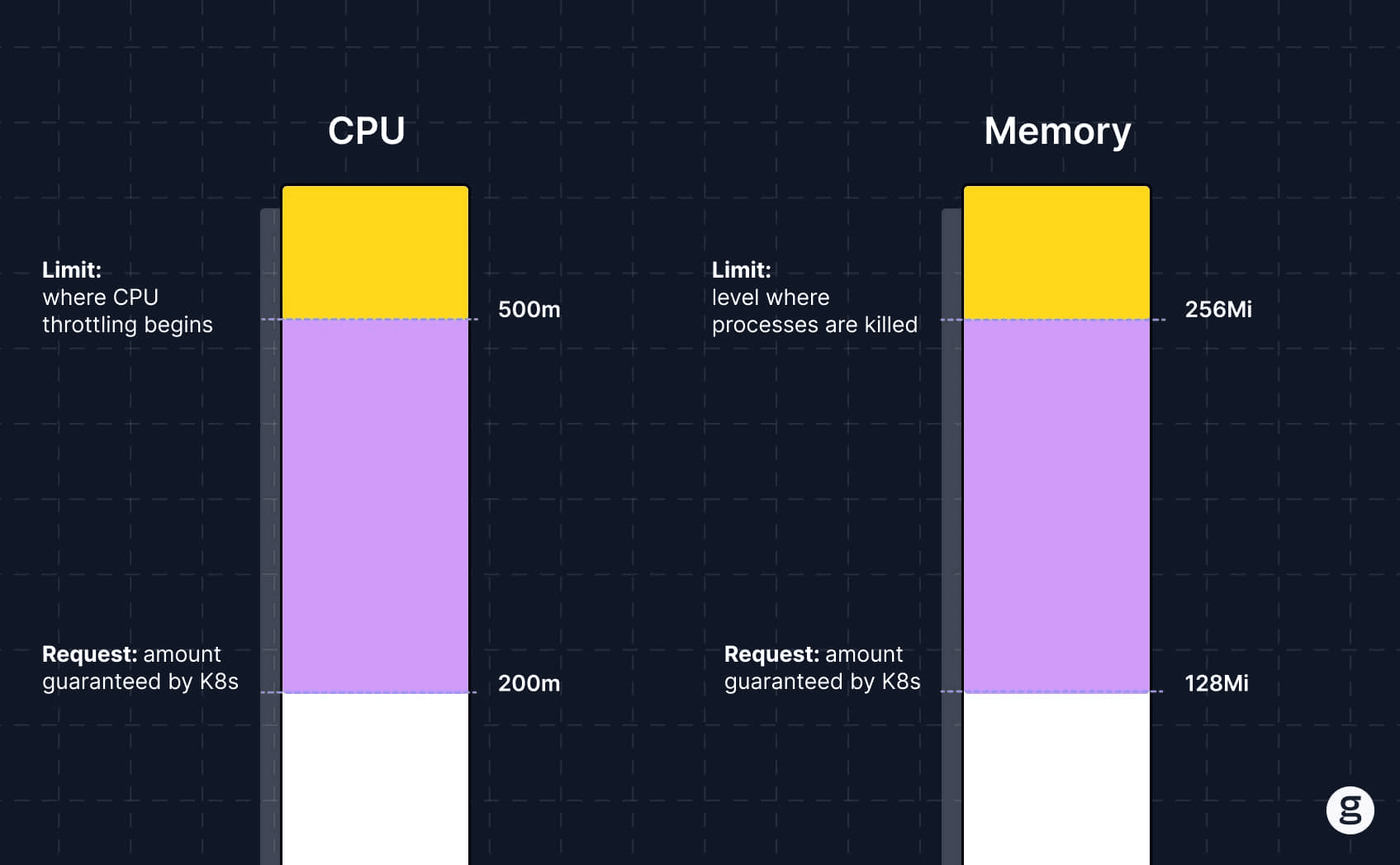
As with other key types of resources, Kubernetes allows admins to manage memory by setting requests and limits. These are optional settings that define (in the case of a request) the minimum amount of memory that should be available to a workload and (in the case of a limit) how much total memory a workload can consume.
Memory requests and limits are useful tools for allocating memory efficiently across clusters. They’re a way for admins to ensure that applications that require a certain amount of memory will always receive it, while also preventing applications from “hogging” memory and preventing other workloads from using it.
That said, there’s no guarantee that the requests or limits that admins configure are ideal for a given application. Requests or limits that are too low could lead to scenarios where an application runs out of memory and experiences a performance degradation because an insufficient amount is allocated to it. At the same time, if requests or limits are too high for a given application, Kubernetes may end up reserving too much memory for that application, leaving less memory available for other workloads to use.
The point here is that it’s critical to analyze workload memory needs strategically before setting requests and limits. Also vital is observing workloads in real time to collect insights about how much memory they’re actually consuming and how memory allocations correlate with performance.
How Kubernetes memory metrics influence scheduling and OOM decisions
In addition to helping admins make informed decisions about allocating and managing memory for workloads, memory metrics also play a key role in influencing how Kubernetes operates behind the scenes.
Kubernetes uses memory-related information to make scheduling decisions that help ensure workloads are placed on nodes with sufficient available resources. When a Pod is created, the scheduler evaluates the memory requests defined for its containers and compares them against the allocatable memory on each node. Nodes that cannot satisfy the requested memory are excluded from consideration. Although the scheduler relies primarily on requested memory rather than real-time usage metrics, memory utilization data may be used by administrators and automated tools to adjust requests over time, improving scheduling efficiency and reducing the risk of resource contention.
Memory metrics also play an important role in identifying node memory pressure, which occurs when a node begins to run low on available memory. Metrics such as memory usage, working set size, and available node memory help Kubernetes determine whether the node is experiencing memory pressure. In these situations, Kubernetes may evict lower-priority Pods to protect node stability and preserve resources for critical workloads.
Out of Memory (OOM) decisions are heavily influenced by container memory consumption relative to configured limits. If a container exceeds its memory limit, the OOM killer (a mechanism in the Linux kernel) can terminate the process to prevent the node from running out of memory. Kubernetes detects these OOM events and reports them through Pod status information and monitoring metrics. By tracking memory usage trends, OOM kill events, and memory pressure indicators, operators can adjust requests and limits to reduce unexpected terminations, improve workload reliability, and maintain healthy cluster performance.
How to access Kubernetes memory metrics: Metrics Server, Prometheus, APIs, and other methods
For teams seeking insights into memory usage trends, a variety of tools and techniques are available for collecting Kubernetes memory metrics. Key options include:
- Metrics Server: The Metrics Server collects real-time resource usage data from kubelets on each node and exposes it through the Kubernetes Metrics API. You can access memory metrics using commands like kubectl top nodes and kubectl top Pods, which provide a quick view of current memory usage without long-term storage.
- Kubernetes Metrics API: The Metrics API provides a standardized way for the control plane to expose resource usage information such as memory and CPU. It is commonly used by autoscalers like the Horizontal Pod Autoscaler to make scaling decisions based on current memory utilization rather than historical trends.
- Prometheus: Prometheus scrapes detailed metrics from kubelets, cAdvisor, and Kubernetes components, storing them for long-term analysis. It provides deep visibility into memory usage patterns, working set memory, and node-level utilization, and it supports alerting and visualization through tools like Grafana.
- Kubelet /metrics endpoint: Each node’s kubelet exposes raw memory and container metrics through an HTTP endpoint. These metrics include container-level memory usage and cgroup statistics, which Prometheus and other monitoring tools can scrape for detailed observability.
- Container runtime metrics (cAdvisor): cAdvisor runs as part of the kubelet and collects per-container resource usage data, including memory consumption and cache usage. These metrics provide fine-grained insight into how individual containers are using memory within a Pod.
The role of Kubernetes memory metrics in autoscaling and capacity planning
Kubernetes memory metrics play a central role in both autoscaling and capacity planning by providing the data necessary to adjust resources dynamically and plan long-term infrastructure needs. In autoscaling, metrics such as memory usage and memory utilization percentage are used by components like the Horizontal Pod Autoscaler to determine when workloads should scale up or down. When memory consumption consistently approaches defined thresholds, Kubernetes can automatically add or remove Pods to maintain performance and prevent resource exhaustion.
For Kubernetes capacity planning, historical memory metrics data helps operators understand how workloads behave over time and how much memory is typically required under different conditions. By analyzing trends in node memory usage, working set memory, and peak demand, teams can more accurately size clusters, set appropriate requests and limits, and forecast future infrastructure needs. This reduces the risk of overprovisioning, which wastes resources (and, by extension, money), and underprovisioning, which can lead to performance degradation or OOM events.
Common challenges with Kubernetes memory metrics and observability gaps
While working with memory metrics in Kubernetes may seem straightforward, behind-the-scenes nuances can lead to some significant challenges:
- Inconsistent memory metrics: The memory data reported by Kubernetes can be different from the memory metrics collected by external tools or operating system utilities. This happens mainly because of variations in the way tools define and track working memory (meaning the amount of memory that is actively being used). It can cause problems in scenarios where, for example, the Linux kernel thinks that an out-of-memory event is occurring but Kubernetes does not.
- Inaccurate or misleading container memory metrics: Often, a certain amount of memory that a container appears to be using is actually unreferenced heaps, meaning a memory object that the application no longer requires. These heaps are periodically deleted through garbage collection processes, but until garbage collection occurs, Kubernetes counts them toward total active memory metrics. As a result, Kubernetes may think a container requires more memory than it actually needs.
- Overly aggressive evictions: Kubernetes is fairly aggressive about evicting Pods from nodes as a way of reducing memory pressure and preventing nodes from crashing. In some cases, this can lead to unexpected evictions because a node may appear to have a healthy memory buffer remaining, but Kubernetes evicts Pods nonetheless.
- Memory leaks: Applications that experience memory leaks may consume increasing amounts of memory over time. Admins who view memory metrics for these apps may mistakenly believe the applications actually need a large memory allocation; in reality, the applications are simply using memory inefficiently, and should be reprogrammed to mitigate the memory leaks.
Best practices for monitoring and optimizing Kubernetes memory metrics
To work with memory metrics most effectively in Kubernetes, consider the following best practices:
- Set accurate memory requests and limits: Define realistic memory requests based on observed usage and set limits to prevent runaway workloads (while keeping in mind that issues like unreferenced heaps or memory leaks can make this data misleading in certain cases). This improves scheduling efficiency, reduces memory contention, and lowers the risk of OOM kills.
- Monitor working set memory instead of just total usage: Focus on working set memory (which is the memory a workload is actively using, without counting data it may be storing but doesn’t currently need) to better reflect actual application demand rather than cached or reclaimable memory. This helps teams avoid overreacting to inflated usage numbers and tune workloads more effectively.
- Use continuous monitoring and alerting: Collect detailed memory metrics over time and configure alerts for high utilization, memory pressure, or OOM events. Continuous visibility helps detect leaks, spikes, and capacity issues before they impact production.
- Regularly review and right-size workloads: Analyze historical memory trends to identify overprovisioned or underprovisioned Pods and adjust requests and limits accordingly. This improves cluster efficiency and ensures resources and helps keep resources in alignment with real application needs.
| Practice | How it helps |
|---|---|
| Set accurate memory requests and limits | Requests and limits that are too high or too low can cause performance issues and/or waste resources. |
| Monitor working set memory instead of just total usage | Working set memory provides a more accurate snapshot of how much memory a workload truly requires. |
| Use continuous monitoring and alerting | Continuous monitoring and alerting report memory usage issues as they occur, allowing teams and/or autoscalers to take action fast. |
| Regularly review and right-size workloads | Regular reviews allow admins to right-size memory allocations (such as by adjusting requests and limits) as workloads or request patterns change. |
How groundcover delivers deep Kubernetes memory metrics with eBPF visibility
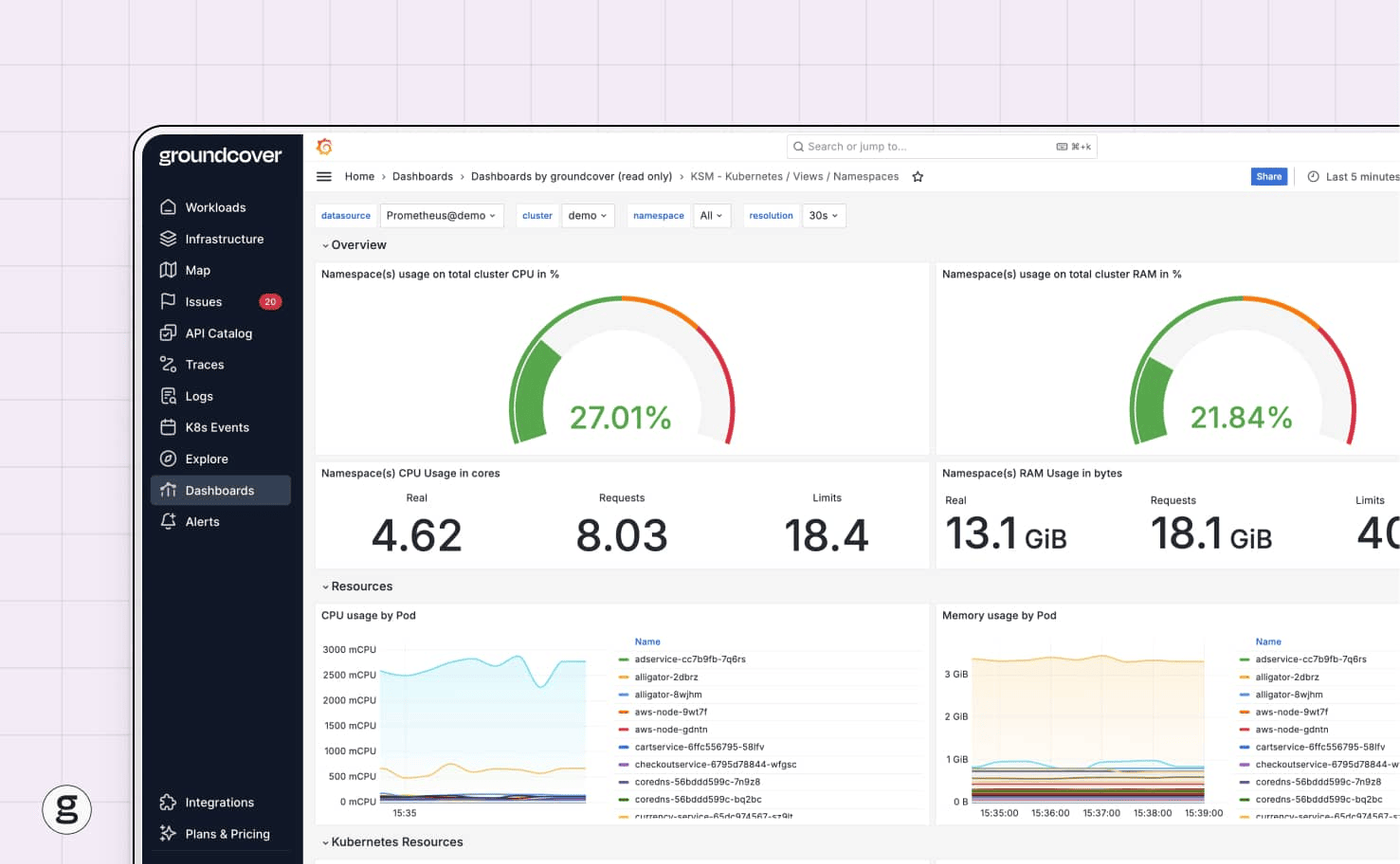
Groundcover isn’t just another tool for collecting memory metrics. It’s a super-efficient solution that comprehensively details and correlates memory metrics for every Kubernetes resource.
Part of groundcover’s secret is eBPF, a Linux kernel framework that groundcover uses to collect memory metrics in an extremely efficient way. (Other observability platforms use agent-based metrics collection, which leads to much higher resource overhead.) The other is its ability to track every memory metric for Kubernetes components in real time, then correlate them so that admins can trace memory usage issues to their root cause.
Putting memory metrics to work in your Kubernetes cluster
Memory metrics may not be the most exciting part of data that you can collect in Kubernetes. But they’re an absolutely vital source of insight into workload performance, cluster resource utilization efficiency and Kubernetes cost management. That’s why collecting and analyzing memory metrics should be a part of every Kubernetes administration strategy.
FAQs
Memory metrics in Kubernetes focus on the volatile (i.e., non-persistent, or RAM) memory usage of workloads. CPU and disk resources are distinct from volatile memory, and high levels of CPU or disk utilization don’t necessarily correlate with high levels of memory usage. Thus, it’s important to monitor disk, CPU and memory usage metrics separately.
For detecting memory pressure for individual containers (meaning a container that is running low on available memory), container_memory_working_set_bytes is the best metric. At the node level, node_memory_MemAvailable_bytes provides insights into nodes’ memory usage.
groundcover differs from traditional memory monitoring tools in two key ways. First, because groundcover collects metrics via eBPF, it consumes minimal resources during collection – which means more resources remain available for actual workloads to use.
Second, by monitoring and correlating all Kubernetes resources, groundcover provides vital context that helps admins get to the bottom of issues quickly – whether they’re caused by a memory problem or any other type of challenge.