Master Grafana Dashboards for Kubernetes Monitoring
Learn how to set up Grafana for Kubernetes monitoring, create custom dashboards, and optimize cluster performance with actionable insights.
.jpg)
Imagine trying to drive a car without a speedometer, fuel gauge, temperature gauge and the other essentials that help you understand at a glance what's happening to the vehicle. You'd probably struggle to drive safely. You might even find yourself running out of gas or stranded on the side of the road with an overheated engine.
Similarly, you can't operate a Kubernetes cluster very effectively if you lack a means of visualizing what's happening in the cluster quickly and easily. Tracking the state of your nodes, Pods, and so on in order to identify and address performance issues requires continuous data visualization, along with alerts that tell you when something looks off.
This is where Grafana, a leading open source data visualization and analytics tool, comes in. Grafana is to Kubernetes and other software platforms what the dashboard is to a car: A solution that helps you understand the state of your software environment on an ongoing basis.
Grafana does this by helping to visualize the metrics that Kubernetes produces. Because Grafana's flexibility allows you to create multiple visualizations for multiple types of metrics, you can easily get the insights you need to achieve deep observability, even in the most complex of environments.
To prove the point, this article walks through what Grafana does and why it matters. We also explain how to set up Grafana in Kubernetes clusters and how to make the most of Grafana as part of your Kubernetes observability stack.
What is Grafana?
In case it's not clear by now, Grafana is an open source tool designed to help visualize and interpret monitoring data. Its key functionality centers on what are known as Grafana dashboards, which are customizable data visualizations that you can view side-by-side based on data sources of your choice.

In addition, Grafana allows you to set up alerting conditions. It will then fire off alerts when your data meets a certain condition or passes a threshold.
Thus, Grafana helps teams make sense of monitoring data – especially when they're dealing with complex environments (like those based on Kubernetes), where they typically have many data sources that they need to analyze collectively in order to detect anomalies and errors. You can use Grafana to help observe virtually any type of workload, but its power really shines when you're dealing with complex, cloud-native environments.
To be clear, Grafana doesn't collect monitoring data for you. For that, you'll need other tools that you integrate with Grafana, as we explain below. But once you have your monitoring data, Grafana helps you figure out what it all means so that you can put it to use for the purpose of optimizing workload performance.
Installing Grafana in Kubernetes
Using Helm is the recommended method for deploying Kubernetes monitoring components, as it simplifies the management of Kubernetes resources and enables easy configuration of monitoring tools like Grafana and Prometheus.
Beyond the fact that Grafana offers some powerful observability features, the icing on the Grafana cake is its ease of setup and deployment. Although the setup process can vary depending on which type of environment you're deploying Grafana to, it's typically pretty simple.
For example, to set up Grafana in Kubernetes, you'd follow these steps:
- Create a Grafana manifest file. You can find the boilerplate code here.
- Deploy the file into your Kubernetes cluster with the command
Note: The average Grafana installation is configured as a ClusterIP service and is not accessible externally by default.
Setting up a Grafana dashboard for Kubernetes typically involves deploying Prometheus for metrics collection via Helm and connecting it as a data source in Grafana. You can install Grafana dashboards for Kubernetes by cloning the repository from GitHub and deploying them using Helm, ConfigMaps, or ArgoCD.
When using the official Grafana Helm chart or the kube-prometheus-stack Helm chart, you can install dashboards directly by configuring the dashboardProviders and dashboards values in your Helm chart. Grafana dashboards can also be provisioned as Kubernetes ConfigMaps by enabling and configuring the Grafana dashboards sidecar in the official Grafana Helm Chart. This approach streamlines the management of Kubernetes resources and ensures your dashboards are automatically loaded and updated as needed.
And there you go. Grafana should now be up, running and available through your browser at localhost:3000 (or whichever port you configured for running Grafana when you created the manifest).
Grafana configuration for Kubernetes
The steps above cover Grafana deployment on Kubernetes, but in order to connect Grafana to Kubernetes data sources so that you have data to visualize, you’ll need to perform some extra configuration. When configuring your Grafana dashboards, consider using the prometheus datasource variable to enable dynamic data source selection. This is especially useful in multi-cluster or federated environments, as it allows dashboards to be compatible across different Grafana instances.
First, install kube-state-metrics by running:
Then, install the Kubernetes Metrics Server with:
Kube-state-metrics and the Kubernetes Metrics Server generate data that helps you monitor the state of your Kubernetes cluster.
To get the data into Grafana, you'll also need to set up a metrics backend. VictoriaMetrics and Prometheus are both good choices. We won't go through the details of setting up these metrics backends here, but suffice it to say that you can find solid guides for deploying VictoriaMetrics and Prometheus online.
Data sources for Grafana
Above, we explained how to set up Grafana and collect simple Kubernetes metrics with it. But Kubernetes cluster metrics represent just the tip of the iceberg when it comes to the data sources you can analyze and visualize with Grafana. Grafana supports a wide variety of additional data sources.
Data sources that you can use with Grafana fall into two categories:
- Built-in data sources, which Grafana supports out-of-the-box with minimal setup or configuration needed. Grafana offers more than a dozen built-in data sources, such as Prometheus, Loki, Elasticsearch and all of the monitoring services (like Cloudwatch) on the major public clouds.
- Data sources made available via plugins. There are currently more than 150 data sources that you can connect to Grafana using plugins, and if that list isn't long enough for you, you can create your own Grafana plugin to move data from your favorite source into Grafana dashboards.
Grafana dashboards facilitate data consolidation by integrating with Prometheus, OpenTelemetry, and other sources for infrastructure monitoring.
In more complex environments, you may encounter a federated Grafana instance setup, where multiple Grafana instances share a common Prometheus datasource. This enables centralized dashboards and querying across different clusters or environments, allowing seamless integration and data aggregation using specific Prometheus datasource variables to support the federated deployment.
So, whether you want to visualize data from Kubernetes or virtually any other type of environment or tool, there's a way to get the data into Grafana via either a built-in or custom data source.
Understanding Kubernetes Nodes
Kubernetes nodes are the backbone of any Kubernetes cluster, serving as the physical or virtual machines that run your containerized workloads. Each node hosts one or more pods and is responsible for executing application processes, managing resources, and maintaining connectivity within the cluster. Monitoring Kubernetes nodes is essential for maintaining cluster reliability and performance, as issues at the node level can quickly cascade into broader application problems.
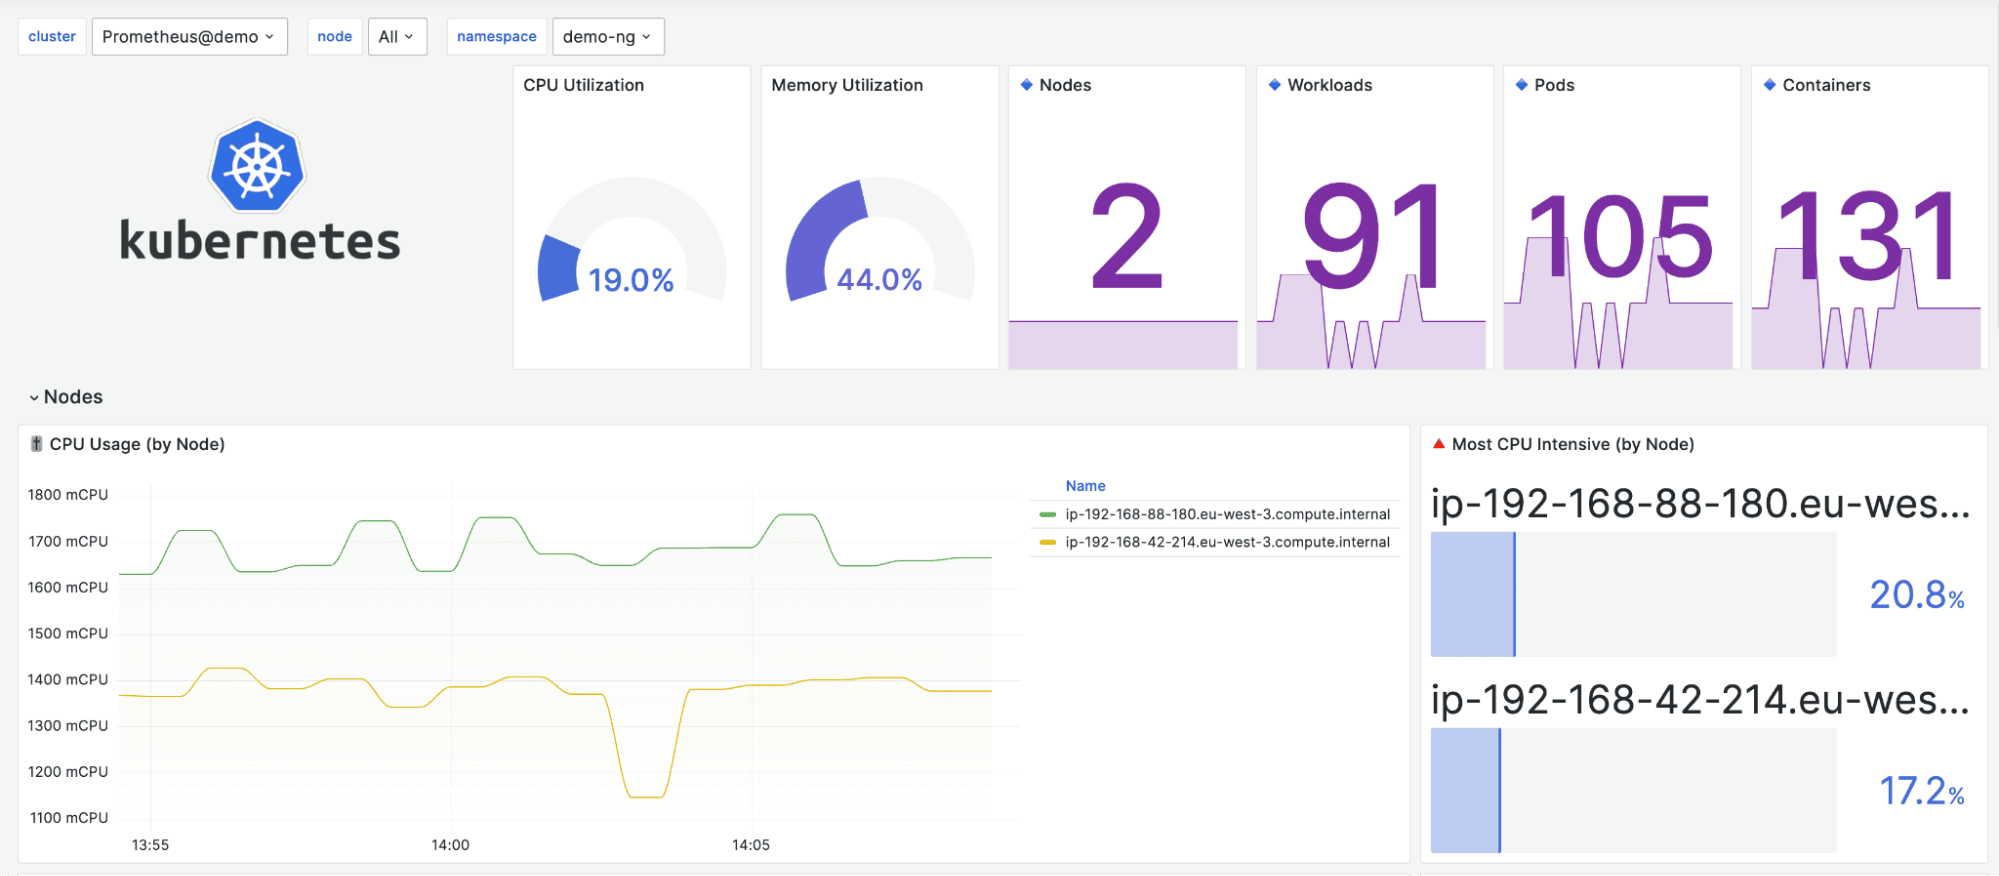
Key metrics to track on Kubernetes nodes include CPU usage, memory usage, and network utilization. These metrics provide immediate insights into how resources are being consumed and help identify performance issues before they impact workloads. For example, high CPU usage might indicate an overloaded node, while excessive memory usage could signal a need for resource reallocation or scaling.
Grafana dashboards make it easy to visualize these key metrics, offering a detailed view of node health and performance. By leveraging observability tools like Prometheus and Grafana, administrators can monitor node metrics in real time, troubleshoot issues efficiently, and make data-driven decisions to optimize resource allocation. This proactive approach to monitoring ensures that your Kubernetes cluster remains reliable, responsive, and ready to handle changing workloads.
Using a Node Exporter
The Node Exporter is a vital tool for collecting detailed metrics from Kubernetes nodes, enabling comprehensive monitoring of node performance and resource usage. Acting as an agent, the Node Exporter gathers a wide range of system-level metrics—including CPU, memory, disk, and network statistics—and exposes them to Prometheus for scraping and storage.
To get the most out of Node Exporter in your Kubernetes cluster, it’s best practice to deploy it as a DaemonSet. This ensures that every node in the cluster runs an instance of the Node Exporter, providing complete visibility into the health and performance of all nodes. Once configured, Prometheus collects the exported metrics, which can then be visualized in Grafana dashboards for easy monitoring and analysis.
By integrating Node Exporter with your monitoring stack, you gain the ability to identify performance bottlenecks, detect anomalies, and troubleshoot issues at the node level before they escalate. This level of insight is crucial for maintaining a healthy Kubernetes cluster and ensuring that your applications run smoothly and efficiently.
Creating custom Grafana dashboards for Kubernetes
To use Grafana to maximum effect in your Kubernetes environment, you'll want to create custom Grafana Kubernetes dashboards that display data in ways that make most sense for your needs.
You can do this easily through the Grafana UI (which, again, will be available at a URL such as localhost:3000). Start by clicking Dashboards, then click New and New Dashboard to begin building a custom dashboard.
You'll be able to select from a wide range of Grafana visualization options. Common options include:
- Time series, which displays graphs of data over time.
- Table, which shows data in a tabular format.
- Heatmaps, a way of displaying histograms over time.
- Lists, which you can use to display lists of alerts, dashboards and other components inside Grafana.
- Gradient mode, which enhances data visualization by applying smooth color transitions to graphs, making trends and anomalies easier to identify.
Grafana supports extensive customization options, allowing users to import pre-built dashboard templates and modify them to fit specific requirements. You can also create entirely new dashboards from scratch.
When customizing dashboards, you can adjust dashboard settings and configurations—such as relabeling node names or changing the minimum interval—to suit your specific analysis needs. Factors like clear labeling, consistent layout, and effective use of color play a significant role in the effectiveness and readability of your dashboards.
With so many options, Grafana makes it easy to visualize data in whichever ways make most sense based on the type of data you're dealing with and your use cases for the data. Plus, as we mentioned above, Grafana lets you display multiple dashboards side-by-side, which is great when you have multiple data sources to monitor and/or if you want to visualize the same data source in multiple ways at once.
Grafana Cloud Integration
Grafana Cloud offers a robust, scalable platform for monitoring Kubernetes clusters, making it easier than ever to manage observability at scale. By integrating your Kubernetes cluster with Grafana Cloud, you unlock access to advanced monitoring features, customizable dashboards, and powerful analytics—all hosted in a secure, managed environment.
Connecting your Kubernetes cluster to Grafana Cloud allows you to centralize monitoring across multiple clusters, streamlining operations and reducing the complexity of managing separate Grafana instances. With built-in support for alerts and notifications, Grafana Cloud ensures that administrators are promptly informed of any issues, enabling rapid response and minimizing downtime.
Grafana Cloud’s intuitive interface and extensive feature set make it an ideal solution for organizations looking to simplify their monitoring setup, reduce operational overhead, and enhance the efficiency of their Kubernetes operations. Whether you’re managing a single cluster or a global fleet, Grafana Cloud provides the tools you need to keep your infrastructure running smoothly.
Large-scale Monitoring
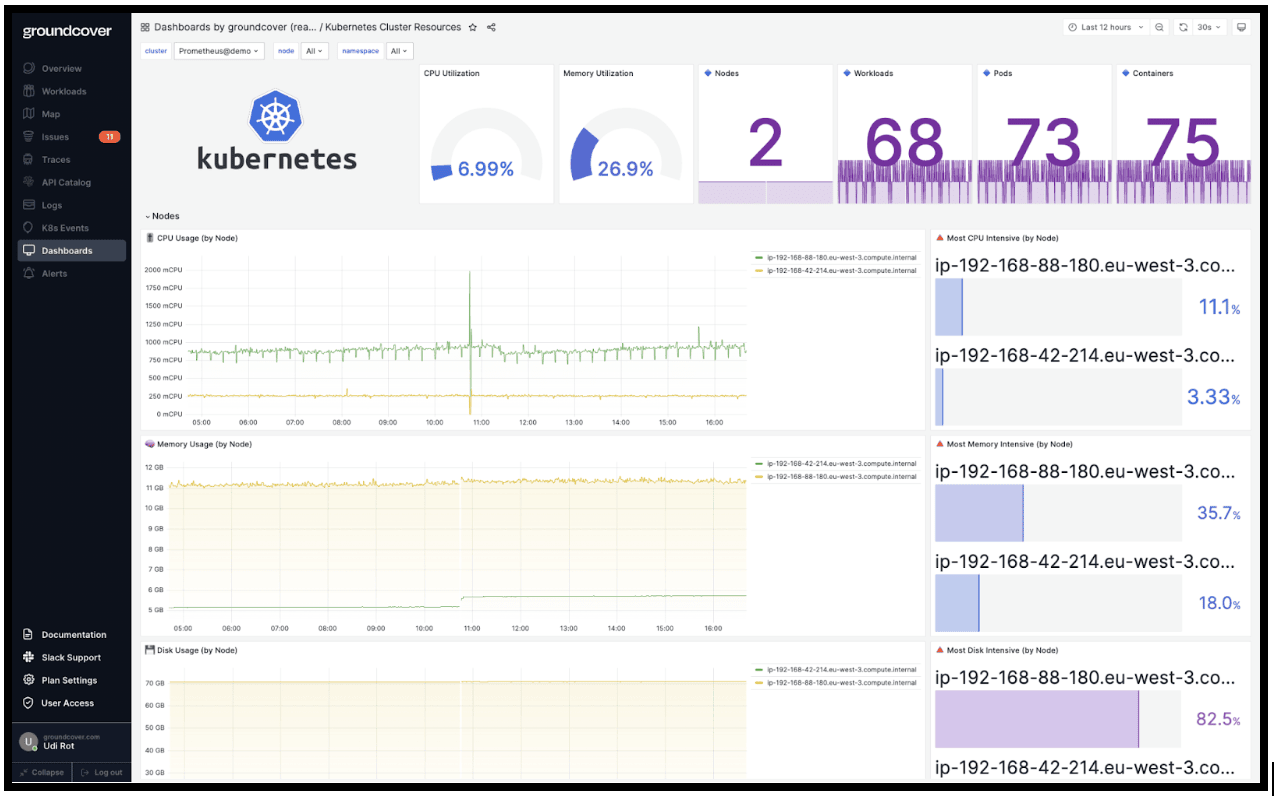
As Kubernetes deployments grow in size and complexity, large-scale monitoring becomes essential for maintaining high availability and optimal performance. Effective large-scale monitoring starts with tracking key metrics such as CPU usage, memory usage, and network utilization, but should also include disk usage and other system-level data to provide a comprehensive view of cluster health.
Tools like Prometheus and Grafana are indispensable for creating a scalable monitoring solution. Prometheus efficiently collects and stores metrics from across your infrastructure, while Grafana enables you to create powerful dashboards that visualize this data in real time. By designing dashboards that highlight critical metrics and trends, administrators can quickly identify and address performance issues, even in the largest environments.
A successful large-scale monitoring setup also depends on robust infrastructure, including scalable data storage and high-performance dashboarding platforms. With the right combination of tools and infrastructure, you can monitor and manage even the most complex Kubernetes deployments, ensuring that your clusters remain reliable, efficient, and ready to support your organization’s needs.
Enterprise Management
Managing Kubernetes clusters at the enterprise level requires a holistic approach that balances monitoring, security, and compliance. Robust monitoring is the foundation, enabling administrators to detect performance issues, optimize resource allocation, and maintain high availability across the organization’s infrastructure.
Enterprise management also involves securing the Kubernetes environment, from the API server to individual nodes and pods. This includes implementing strong access controls, enforcing network policies, and maintaining comprehensive audit logs to ensure compliance with industry standards and regulatory requirements.
By leveraging tools like Grafana and Prometheus, enterprises can create scalable monitoring solutions tailored to their unique needs. These tools provide deep visibility into cluster performance, enabling teams to proactively address issues and maintain operational excellence. With a thorough understanding of Kubernetes components and best practices, administrators can confidently manage large-scale deployments, ensuring security, compliance, and optimal performance at every level.
Using Grafana Kubernetes dashboards for boosting DORA Metrics
Now that we've told you all about what Grafana dashboards are and how to work with them, let's discuss the types of benefits that Grafana dashboards bring to teams who work with Kubernetes.
We'll discuss the benefits in terms of the DORA Metrics – four metrics developed by DevOps Research and Assessment (DORA) to track the success of DevOps teams. Here's a look at each DORA metric and the role that Grafana dashboards play in optimizing it.
Change failure rate
Change failure rate measures how many application deployments result in a failure within a production environment. Grafana dashboards help you track this metric in a Kubernetes cluster by identifying failures, such as Pods that have crashed and restarted or (worse) ended up stuck in a crashloopbackoff. If you attempt to deploy an application or application update by deploying a new Pod, and the Pod doesn't actually start, you'll end up with a lower change failure rate.
In addition to helping to measure your change failure rates, Grafana dashboards can also help to reduce failures by identifying the conditions associated with them. For instance, they might reveal that Pods deployed to certain Kubernetes nodes as part of a DaemonSet are more likely to fail, or that failures correlate with resource limit constraints.
Mean time to recovery
Mean time to recovery, or MTTR, measures how long it takes to fix a problem like a failed application deployment or a performance degradation. The shorter your MTTR, the better the overall experience you're bringing to your end-users.
The role that Grafana dashboards play in minimizing MTTR is making it easy for teams to identify performance issues quickly. A good dashboard and alerting rules will reveal trends like a slowdown in application response time or a Pod that is nearing 100 percent CPU utilization before they turn into critical problems, allowing engineers to respond – and, ultimately, fix the issue – as quickly as possible.
Deployment frequency
Deployment frequency refers to how often DevOps teams deploy new applications or application updates. Organizations typically aim to release as often as possible, so that they can bring new features to users quickly.
Grafana dashboards don't play a direct role in increasing deployment frequency, since the rate at which DevOps teams deploy apps depends mostly on the efficiency of their software delivery lifecycle and Continuous Integration/Continuous Delivery (CI/CD) processes. However, dashboards and alerts can help to detect issues that may slow down deployments, such as lack of sufficient CPU or memory in a Kubernetes cluster to support a new deployment. Dashboards may also help to identify the source of performance problems that could force a team to roll back a deployment (which means reverting a newly deployed app to an earlier version in response to a severe issue in the newer version).
Mean lead time for changes
The mean lead time for changes metric measures how long it takes to move newly written code into production. The faster you can turn code into a production app, the faster new features reach users.
Like deployment frequency, this metric mainly reflects the efficiency of software delivery practices, so Grafana dashboards and alerts from a Kubernetes cluster don't directly impact mean lead time for changes. However, the insights that Kubernetes admins get through Grafana can help to detect bugs or performance issues in one version of an app. They can then feed that information back to developers who are working on a new version so that they'll know where to focus their efforts and work efficiently.
For instance, developers may learn from Grafana alerts that a certain microservice experiences a performance degradation under certain conditions. Knowing this will allow developers to mitigate the issue as part of the next round of application updates, and avoid wasting time writing code that changes other aspects of the app but that is never actually deployed because the performance issue needs to be fixed first. Ultimately, an insight like this would reduce mean lead time for changes.
Monitoring Kubernetes with Grafana alerts
Grafana also gives you a lot of flexibility when it comes to setting up alerts. You can configure a variety of alerting rules from within the Grafana UI.
To create an alert, navigate to Alerting and click Alert rules, then Create alert rule. From there, you'll be asked to give a name to your new alert. You'll then have to choose which data source the alert is based on. You can select Loki or Prometheus (assuming you have both configured as Grafana data sources).
The rest of the alert configuration depends on which data source serves as the basis for your alerts. But to take Prometheus as an example, you'd typically configure fields such as:
- Alert: A name for your alert.
Expr: The data expression that describes a condition that needs to be present for an alert to fire.
For: Defines a duration of time for which an alert's conditions need to be met before an actual alert fires.
Labels: Labels that you define to describe an alert.
You can also set up Alertmanagers, which tell Grafana where to send an alert. Popular Alertmanagers include Slack, Microsoft Teams and Pagerduty, to name just a few.
Best practices for using Grafana with Kubernetes
To maximize the effectiveness of Grafana as part of a Kubernetes monitoring stack, consider these best practices:
- Know what to monitor: Trying to create a Grafana dashboard for every metric that exists in a Kubernetes cluster is not realistic. Even if you set up all those dashboards, you wouldn't be able to monitor them all. Instead, define which metrics and which types of visualizations are most important, then create dashboards accordingly. Typically, creating somewhere between one and two dozen dashboards in total is a good number to target.
- Keep dashboards simple: In general, it's better to build multiple simple dashboards and view them side-by-side than to try to pack complex visualizations into a single dashboard.
- Use one metric per dashboard: Although there may be cases where you want to track multiple metrics (like CPU and memory) together in order to monitor how they correlate, it's a best practice in most cases to create dashboards based on a single metric.
- Use consistent dashboard design: To the extent possible, strive to use the same types of dashboard designs and layouts. This makes it easy to compare dashboards and understand context when monitoring Kubernetes with Grafana.
- Tag dashboards: Although Grafana offers a dashboard search feature that you can use to find dashboards, applying tags to each dashboard makes it easy to navigate between them without having to search.
Security best practices for Grafana and Kubernetes
In addition to the general best practices we just described, there are some specific security considerations to bear in mind when working with Grafana and Kubernetes.
The biggest involves data security. Although the data that Grafana collects and visualizes may seem like purely technical information (such as CPU and memory utilization rates), it can sometimes include information that is sensitive from a security or privacy standpoint (like data about which apps the business runs internally and does not want to expose to external access, but which threat actors might want to attack).
For that reason, it's critical to ensure that data collected and displayed by Grafana is accessible only to people who should be available to view it. You can do this by using Grafana's Role Based Access Control (RBAC) framework to restrict access to data and dashboards.
Other security best practices for Grafana inside a Kubernetes environment include:
- Securing cookies, which reduces the risk of unauthorized access to Grafana resources by threat actors who manage to steal cookies.
- Securing headers, to help protect against cross-site scripting (XSS) attacks involving Grafana dashboards.
- Enabling trusted types, which can also protect against certain types of XSS attacks.
For details on how to implement these security protections, check out the Grafana documentation on security hardening.
Troubleshooting common Grafana dashboard issues
When working with Grafana in Kubernetes, you might run into the following common problems. Here's a look at how to troubleshoot them.
Dashboard is slow to load
If your Grafana dashboard is slow to load initially, it could be linked to lack of adequate resources in your Kubernetes cluster. Make sure you don't have excessive CPU or memory limits in place, and that your cluster has enough overall resources for Grafana.
If you’re confident you don't have a resource issue, check the data sources for dashboards that are slow to load. If you're trying to import a lot of data into Grafana, you may be able to improve performance by applying more aggressive filters or running more restrictive queries.
Issue with the dashboard refresh rate
Sometimes, Grafana dashboards may load in a reasonable time but then perform poorly when refreshing (meaning updating the information displayed in the dashboard based on the latest available data).
One common reason for this is that an admin has configured a refresh rate that is too high. You can configure this setting by changing the Minimum dashboard refresh interval in your Grafana configuration file.
If you've set a reasonable refresh rate but the dashboards still take too long to reload, it's probably a performance issue triggered either by one of the following:
- Lack of available memory and CPU. If Grafana doesn't have enough resources to perform adequately, dashboards may take a while to refresh. Make sure you don't have CPU or memory limits that are constraining Grafana's performance, and check whether you have enough nodes in your cluster to support Grafana.
- Overly complex dashboards. Dashboards that display a lot of information may take a long time to refresh due to the resources needed to revisualize the data. You can mitigate this issue by reducing the amount of data you’re trying to display in the dashboard.
Broken panels
The most common reason why Grafana dashboards "break" – meaning they stop functioning normally even though they worked properly at first – is that you've updated to a new version of Grafana. If that's the case, check the release notes for the new version to see whether they mention any changes that would cause a certain panel to stop working.
You should also verify that the data source hasn't changed. Sometimes, data may have moved to a new location or been deleted, and you'll need to update the dashboard configuration accordingly to fix a broken dashboard.
Logs not showing
If you've set up dashboards to visualize log files but can't see log data, first make sure that the dashboards point to the right log files. Since there are many types of logs in Kubernetes, and because the location of log files may vary between different Kubernetes distributions, resources, and applications, it may simply be the case that you've misconfigured the sources for logs.
If the sources are accurate, make sure Grafana has permissions to view relevant log files. Check the file system permissions using the ls -l command in the CLI for the servers or containers that host the logs. Make sure as well that the logs are accessible via the network.
Finally, check your Grafana filter settings. It's possible you've inadvertently created a filter that tells Grafana to ignore the log files or data you're trying to display.
Kubernetes monitoring made simple with Grafana and groundcover
When it comes to making sense of Kubernetes metrics, it's hard to think of a better tool than Grafana. It's highly flexible and adaptable, it's easy to set up and it makes it a breeze to configure visualization panels and alerts tailored to your needs.
In fact, we think Grafana is so great that we chose to build groundcover's custom dashboard offering based on the Grafana stack. We hope you'll find it just as compelling for meeting your Kubernetes monitoring needs.
By using groundcover, you get all of the benefits of Grafana dashboards for Kubernetes, without having to configure them from scratch. In addition, groundcover delivers benefits like eBPF-based data collection to minimize the performance impact of Kubernetes monitoring – leaving more resources to power your apps, and fewer to waste on monitoring overhead.
In short, groundcover lets you take full advantage of Grafana as a Kubernetes observability solution, without the hassle of conventional dashboard management, while also delivering a plethora of features you won't get from Grafana alone.
.png)
.jpg)


.svg)