Prometheus vs. DataDog: Detailed comparison [2026]
Learn key similarities and differences between Prometheus and Datadog and discover the tips on selecting the right solution for you.

So, what's the difference between Prometheus and Datadog? If you answered that one is open source and the other is a commercial product, you're not wrong. Indeed, the pricing model (or lack thereof) is one of the key distinctions between the two tools.
But Prometheus and Datadog vary in many other ways, too – such as the scope of their features and capabilities, how they collect data, how they handle visualizations, and which level of customization they support. Deciding which tool is best for you requires a careful analysis of all of the nuanced differences between these two monitoring and observability tools.
If you're looking for such a comparison, you've come to the right place. Keep reading for a look at the key similarities and differences between Prometheus and Datadog, along with tips on selecting the right solution for you.
Prometheus overview
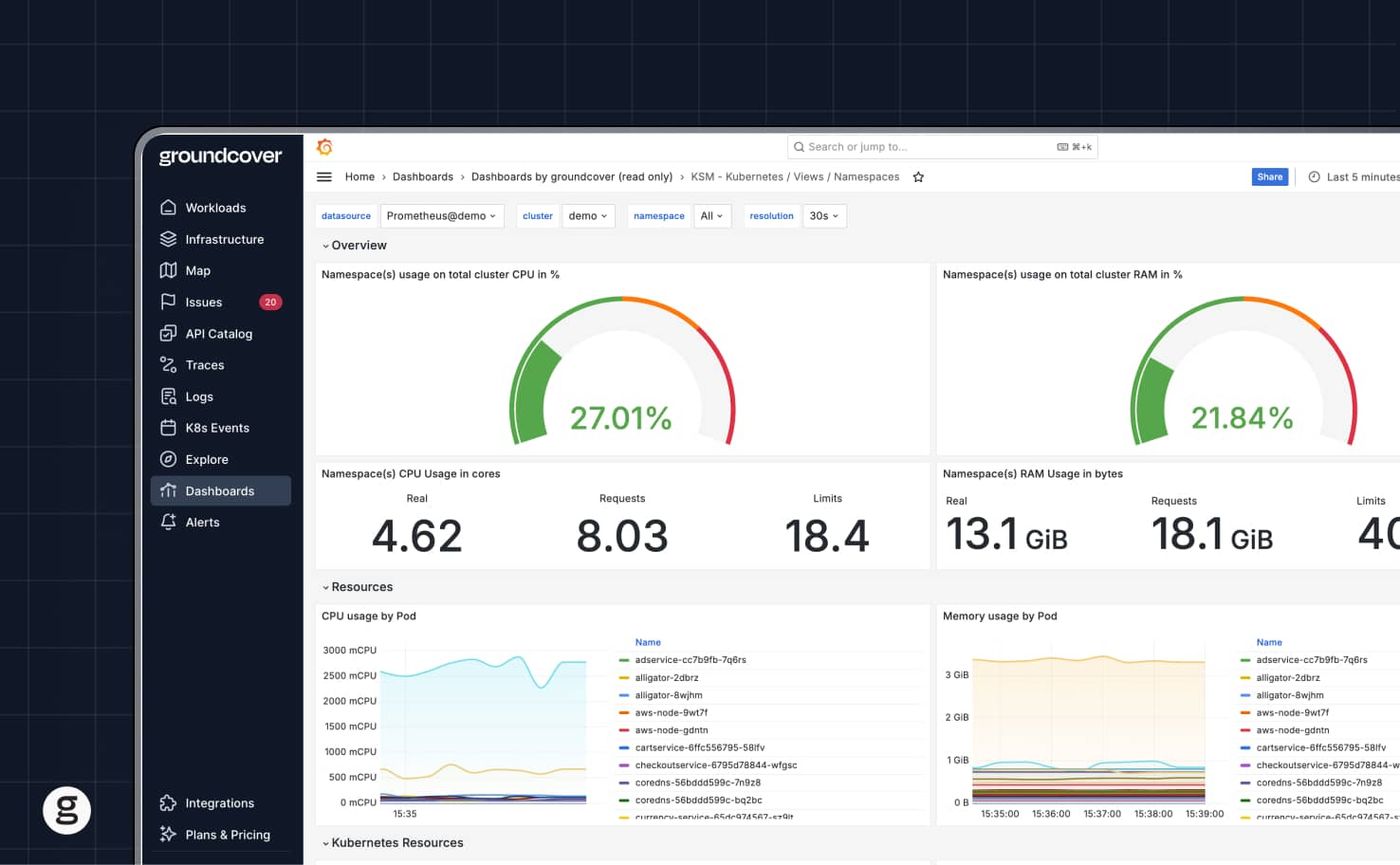
Prometheus is an open source monitoring and observability tool designed especially for cloud-native applications and environments. Prometheus can collect data using HTTP pulls or pushes, and then use the data to drive real-time alerting and visualizations. It supports a multi-dimensional data model.
Prometheus originated as a project inside SoundCloud, an audio streaming company, in 2012. SoundCloud engineers started building Prometheus because they felt that conventional monitoring tools were a poor fit for their needs. Because SoundCloud operated Prometheus as an open source project, engineers outside the company were able to use it as well. Over time, Prometheus gained widespread popularity as a solution for monitoring cloud-native applications of all types, well beyond those used by SoundCloud.
Datadog overview
Datadog is a cloud-based monitoring and analytics platform. It supports metrics and log collection and analysis, as well as distributed tracing, and it unifies metrics, logs, traces, and security monitoring in one platform. It's a commercial product that requires a paid subscription to use (although the company currently offers a free trial).
In many respects, Datadog is similar to most commercial monitoring and observability tools. It lets you collect a wide variety of data, and it offers built-in visualizations and other tools for interpreting the data.
Datadog provides over 600 built-in integrations and also supports custom integrations for less standard sources.
That said, one of the characteristics that helps Datadog stand out in the world of observability is that from the start, Datadog focused on cloud monitoring. The product was launched in 2010 – right as cloud computing was beginning to become central to IT strategies – with the goal of making it easier to collect and analyze performance data from cloud platforms, like Amazon Web Services.
This was important at the time because in the cloud, you don't have access to the underlying infrastructure that hosts your workloads. This means you can't collect data in the same ways you could in an on-prem environment where you control all of the infrastructure. Datadog was conceived, in part, to address this challenge by offering a cloud-centric approach to monitoring, and users typically install the Datadog Agent to collect and forward telemetry data to the Datadog platform.
This focus helped give Datadog an early edge in the cloud and cloud-native monitoring world. Today, Datadog is certainly not the only commercial observability solution that caters to modern environments, but it has become a popular solution, in part because this managed model requires less operational overhead than running monitoring infrastructure yourself.
Datadog as a full observability stack vs. Prometheus in an open source setup
Now that we’ve covered the basics of both Prometheus and Datadog, let’s talk about the key difference between them: The fact that Datadog includes a much broader range of capabilities.
Datadog offers a complete observability stack. It includes full support for collecting and analyzing logs, metrics, and traces – all as part of a single, unified platform.
In contrast, Prometheus is designed only for working with metrics. It’s not a logging or tracing tool, and in that sense it falls short of being a “full stack” observability solution. In addition, although Prometheus offers some basic data visualization capabilities, it’s not a full-scale analytics tool. It focuses mostly on metrics collection, not metrics analysis.
You can pair Prometheus with other open source tools (like Jaeger for tracing or Grafana for advanced visualizations) to build out an observability stack. But on its own, Prometheus doesn’t offer the comprehensive set of observability capabilities you’d get from a platform like Datadog.
Prometheus vs. Datadog’s full-stack solution: Pros and cons
We'll dive into a feature-by-feature comparison of Prometheus and Datadog in a moment. First, let's look at the pros and cons associated with each product from a high level.
Compared to Datadog, the main advantages of Prometheus include:
- The software is free to use and can offer low operational cost, although you should account for associated costs such as hosting and maintenance.
- You get more control over how Prometheus works because it offers more configuration options, making it best suited for organizations that want complete control over their monitoring stack and teams that need highly customizable metric monitoring.
- You can deploy Prometheus anywhere – on-prem, as a solution that you manage yourself in the cloud or by using a Prometheus-as-a-Service offering (in which a vendor hosts Prometheus for you on their infrastructure).
- As an open source solution that can run anywhere, Prometheus is an industry standard that doesn't pose vendor lock-in risks.
On the other hand, Prometheus's drawbacks relative to Datadog include:
- Prometheus can require more effort to set up (although arguably, some aspects of Prometheus, like alert configuration, are actually simpler than in Datadog).
- There is no paid support available if you need help.
- Prometheus has fewer built-in features. For instance, native support for data visualizations and machine learning capabilities in Prometheus are very limited – although you can combine Prometheus with other tools to implement features like these.
Expert Tip: Prometheus vs. Datadog Is a Control-Plane Tradeoff, Not a Feature Checklist

Noam Levy is a founding engineer at groundcover. Over the last 10 years, Noam has been a part of and led development teams focused on microservices-oriented web applications, monitoring complex application pipelines, and system engineering.
The real decision between Prometheus and Datadog is about ownership of observability mechanics versus outsourcing them.
- Prometheus gives you control over data shape, retention, and query cost, but pushes operational burden onto your team
- Datadog abstracts ingestion, storage, and analytics, at the cost of pricing opacity and reduced control
- Pull vs. push matters less than how failures, backpressure, and cardinality are handled
- PromQL enables precise reasoning; Datadog optimizes for speed-to-dashboard
- Lock-in shows up in pricing models and data egress, not APIs
Choose based on how much observability you’re willing to operate yourself.
Prometheus vs. Datadog: Key differences
| Feature | Prometheus | Datadog |
|---|---|---|
| Scope of capabilities and use cases | Mainly metrics collection. | Full-stack observability |
| Data collection | Pull model. | Push model. |
| Metrics generation | Instrumentation libraries. | Instrumentation libraries |
| Metrics collection | Agent-based data scraping or agentless data forwarding. | Agent-based collection. |
| Data interpretation and visualization | Basic built-in analytics features based on PromQL. Integrates with other tools for more advanced analytics and visualizations. | Full suite of built-in analytics and visualization features. |
| Alerting | Basic, rules-based alerting. | Supports rule-based and AI/ML-based alerts. |
| Ecosystem and integrations | Very large ecosystem. | Fairly large ecosystem. |
| Pricing | Free of cost. | Paid product. |
| Security monitoring support | Very basic. | Robust. |
| Deployment | Can run anywhere. | Limited to SaaS deployment model. |
| Ease of use | May feel rough around the edges to new users. | Fairly user-friendly experience. |
Here's a deeper look at the main differences between Prometheus and Datadog, broken down according to different feature areas.
1. Data collection
One of the biggest technical differences between Prometheus and Datadog is that Prometheus uses a pull-based model to collect data, with a central prometheus server scraping target systems, while Datadog relies on a push model. This means that Prometheus can go out and collect monitoring data for you, whereas with Datadog, you configure data sources to export data into Datadog.
Each approach has its pros and cons, and depending on your situation, one may be preferable over the other. The main advantage of Prometheus's pull-based data collection is that it allows you to configure data importation rules from a central location, instead of having to manage them at each data source. It also has a large ecosystem of exporters for specific technologies, plus client libraries for custom applications, and is designed for reliability in dynamic service-oriented environments.
On the other hand, a push approach can make it easier to collect data in real time because the data source can push new data whenever it arises. With a pull approach, you typically collect data at periodic intervals, but Prometheus still supports high-resolution, real time monitoring, while Datadog's managed backend automatically scales for larger data volume needs.
2. Metrics collection and instrumentation
Datadog and Prometheus are pretty similar with regard to the types of infrastructure metrics, application metrics, and log data they can collect and the ease of collecting them. They also both support the collection of custom metrics. But they work a little differently on the backend. Prometheus metrics are commonly collected in Kubernetes and other cloud native environments.
Datadog and Prometheus both provide their own instrumentation libraries, which you can use to collect metrics from applications you want to monitor. Arguably, Prometheus's libraries are more flexible because they're open source, and its client libraries and exporter ecosystem are community-driven, reflecting its role as a core CNCF project. Note, too, that both monitoring tools support OpenTelemetry, so as long as you have instrumentation libraries or data collectors that conform to the OpenTelemetry standards, you'll be able to get the data you want in a standardized way.
3. Data interpretation and visualization
When it comes to data analysis and interpretation, Datadog offers more built-in capabilities. It offers features like Metrics Explorer, RUM Explorer, and Log Explorer, which can help you identify trends in monitoring data and create custom dashboards. Datadog also typically provides a unified dashboard across multiple observability data types, along with strong search capabilities for exploring that data. Datadog also offers native support for generating visualizations based on the data you've collected.
In contrast, Prometheus's data analytics features are limited mostly to using a query language called PromQL to filter and analyze metrics. This means that, in general, you'll need a higher level of skill to analyze data in Prometheus.
As for data visualizations, Prometheus offers limited support via the Prometheus Expression Browser, which is a built in expression browser that can be used to display basic views of Prometheus data inside a Web browser. For broader visualization tools and more advanced custom visualizations, however, you'd typically integrate Prometheus with a tool like Grafana.
One could argue that Prometheus's limited data analytics and visualization capabilities are a feature, not a bug. They give you the flexibility to pair Prometheus with other tools to help interpret data. On balance, we should note that Datadog can integrate with tools like Grafana, too, but Datadog is designed with the assumption that you'll do most of your monitoring and observability work inside Datadog itself, so its native experience is broader for custom visualizations while Prometheus relies more heavily on external visualization tools.
4. Alerting
Prometheus is an open-source monitoring and alerting toolkit with basic rule-based alerts, while Datadog adds more advanced alert management. Prometheus generally relies on Alertmanager for effective alert notifications. In many respects, however, Datadog's alerting capabilities are more powerful, including anomaly detection with machine learning assistance and notification routing to tools like Slack and PagerDuty. In contrast, Prometheus alerts are based primarily on preconfigured rules.
5. Ecosystem and integrations
While Datadog and Prometheus both support a variety of integrations, Prometheus's ecosystem is, on the whole, larger and more dynamic, with a large ecosystem of exporters and integrations for various target environments and other monitoring systems. This makes sense because, as we mentioned, Prometheus is designed to be used in close conjunction with other tools. The fact that it's open source probably also helps encourage the development of more third-party integrations with the tool.
On the other hand, while Datadog's dashboards are proprietary, they're also somewhat easier to deploy and manage because they are built directly into the platform, and Datadog's ecosystem includes many prebuilt integrations while Prometheus often allows more freedom for custom integrations. Prometheus's dashboard tooling is more customizable but comes with a somewhat steeper learning curve.
6. Pricing
Prometheus is free of cost, whereas Datadog uses complex pricing tiers, including enterprise tiers, that you have to pay for. This is a big advantage in the favor of Prometheus if you want to lower monitoring costs.
That said, keep in mind that you will have to pay for the infrastructure that hosts Prometheus and stores your data – so the product is not completely free to deploy; you just don't have to pay licensing fees for the software. With Datadog, hosting costs are built into the product pricing, because Datadog is a SaaS solution, but costs can rise quickly with host count, data retention, and overall data volume. So while Prometheus may have lower software costs, it still carries infrastructure expenses, and Datadog can become prohibitively expensive as usage scales.
7. Support for security monitoring
Datadog and Prometheus can both support security monitoring by collecting data that security analysts can use to discover anomalies and other signs of attack. However, security monitoring is more a product focus for Datadog than it is for Prometheus (which focuses primarily on application performance management – a use case that Datadog also supports). Datadog includes analytics features that cater to security monitoring use cases, whereas Prometheus mainly only collects data. If you want to analyze the data for security purposes, you'll likely need to import it into a different tool.
8. Deployment flexibility
As noted above, you can deploy Prometheus almost anywhere. The Prometheus server can run on your own infrastructure, giving you control over the storage backend. With Datadog, however, you can only operate the product as SaaS, which means Datadog deploys and manages it for you.
Prometheus's deployment flexibility may be an advantage for businesses that want to keep monitoring data on their own servers, or that need to monitor resources that can't easily be exposed to products hosted externally. It can also scale vertically and through federation, so teams often choose it for monitoring infrastructure that must process millions of time series per minute at low operational cost. On the other hand, Datadog's SaaS deployment model reduces management effort, but it keeps deployment tied to the Datadog platform.
9. Ease of use
"Ease of use" is subjective, but if you surveyed Datadog and Prometheus users, you'd likely find that most people say Datadog is somewhat easier to use. This is not surprising given that Datadog is a commercial product whose customers generally expect a smoother setup and administration experience than they would when using a free product.
Note, too, that because Datadog offers professional support services, it's easier to get technical help if you need it. With Prometheus, teams are limited primarily to community support, although paid Prometheus support plans are available from various companies.
Prometheus and Datadog use cases
There is a lot of overlap in the use cases that Prometheus and Datadog support. For the most part, each tool is equally capable of handling modern application performance management needs, although Prometheus is stronger when teams want highly customizable metric monitoring rather than broader observability data like trace data.
That said, Datadog supports additional use cases where Prometheus doesn't excel. The biggest is security monitoring – which, as noted above, Prometheus doesn't really support. Datadog's push data model also makes it a better fit for use cases where collecting, analyzing, and alerting on data in true real time is a priority, and its managed model requires less operational overhead for teams that don't want to maintain their own stack.
Prometheus vs. Datadog: Which solution is better for you?
In general, in the Datadog vs Prometheus decision, you should use Prometheus instead of Datadog if the following are true:
- Your main focus is on metrics collection. Logging and tracing either aren’t important or you plan to use other tools to address those needs.
- You want to minimize observability and monitoring costs.
- You want complete control over the monitoring stack and prefer to run it on your own infrastructure.
- You're familiar with complementary tools, like Grafana, and are prepared to use them alongside Prometheus.
And Datadog is likely to be a better fit under the following conditions:
- You want an all-in-one, full-stack observability platform.
- Ease of use is a top priority.
- Having access to professional support is important.
- You prefer a cloud based monitoring service with less operational overhead, and want an all-in-one product that covers all APM and security monitoring needs without requiring additional tools or integrations.
Alternatives to Prometheus and Datadog: groundcover
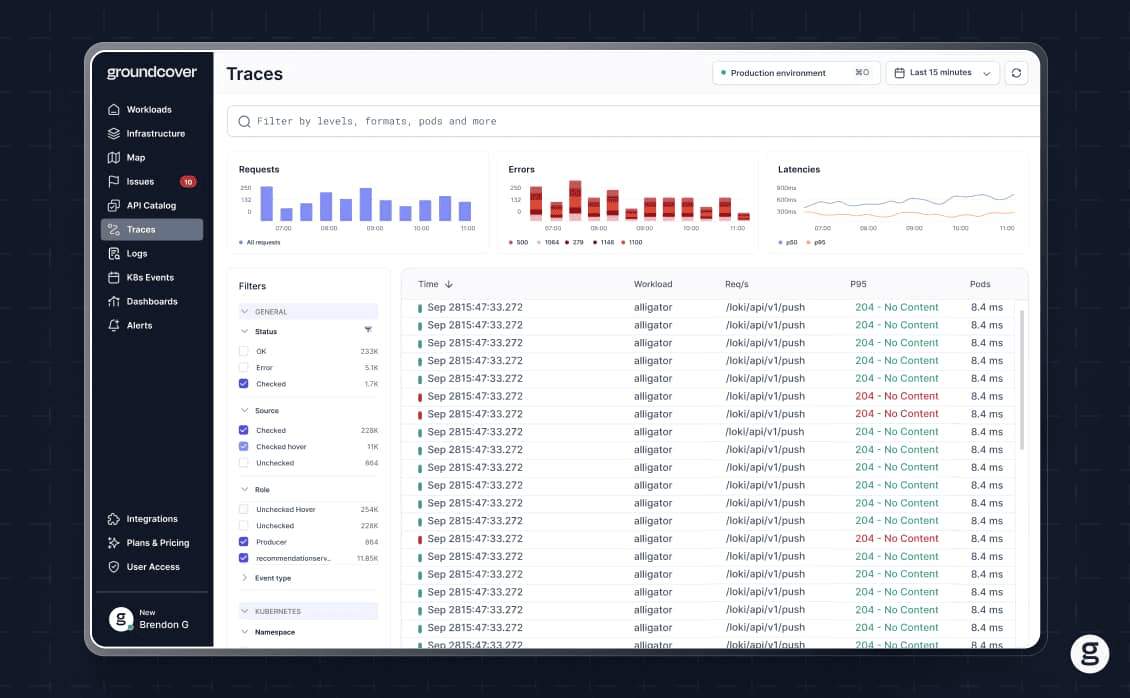
If you can't decide between Prometheus and Datadog, here's a tip: Don't choose. Instead, use groundcover, which offers the flexibility of Prometheus combined with the advanced features and support you get from Datadog.
Like Prometheus, groundcover delivers a very flexible approach to monitoring by using eBPF to collect data. This means you can collect and analyze virtually any type of data, from any system, with minimal cost and overhead. In addition, groundcover integrates beautifully with Grafana and other tools, giving you the flexibility to analyze and visualize data however you wish.
But unlike Prometheus – and like Datadog – groundcover offers a variety of built-in features for data analysis and reporting. You also get paid support. And you can use distributed tracing.
In short, if you want the flexibility and low cost of Prometheus combined with the powerful analytics and distributed tracing features of Datadog, groundcover lets you have it all.
Prometheus, Datadog, and beyond
Prometheus and Datadog are great tools with robust monitoring capabilities, and this detailed comparison shows that each also has distinct limitations. We're biased, but we like to think that groundcover gives you the best of both worlds, without the drawbacks.
But don't just take our word for it. Learn more by reading about how a major cloud services and security provider replaces Datadog with groundcover.
Faqs
Because Prometheus shifts costs from licensing to infrastructure, retention, and operational complexity.
- Long-term metrics retention quickly drives up storage and compaction costs.
- High-cardinality labels (common in Kubernetes) silently explode TSDB size.
- Engineering time spent maintaining exporters, HA setups, and federation is an ongoing “hidden tax.”
Explore ways to optimize observability costs.
Because Datadog optimizes for fast onboarding, not for sustained data growth or deep customization.
- Prebuilt dashboards abstract complexity but limit deep system-level visibility.
- Sampling and aggregation become mandatory as costs grow.
- Data gravity and SaaS lock-in make architectural pivots expensive over time.
Learn more about observability tool trade-offs.
Prometheus excels at metrics snapshots, while Datadog emphasizes correlated signals, but both miss kernel-level root causes.
- Prometheus alerts often fire without context across logs, traces, and nodes.
- Datadog correlation depends on agent health and sampling decisions.
- Neither approach inherently explains why latency, throttling, or drops occurred.
By collecting raw system signals directly from the kernel and correlating them across metrics, logs, and traces without sampling.
- No need to choose between flexibility and full-stack visibility.
- High-cardinality data stays affordable because it’s processed in-cluster.
- Correlation is deterministic, not heuristic or ML-driven guesswork.
Explore how groundcover helps you replace OSS solutions.
Because running observability where the workloads live eliminates egress costs, sampling pressure, and data ownership risk.
- Raw telemetry never leaves your cloud unless you choose.
- Incident response remains possible during network or control-plane failures.
- Costs scale with infrastructure, not with vendor pricing tiers.
Learn more about groundcover’s full coverage of Kubernetes environments.