
LangSmith Alternatives: Best LLM Observability Tools in 2026



LangSmith gives you tracing and evaluation for LLM applications, especially when your stack uses LangChain or LangGraph. It lets you inspect how prompts, model calls, retrieval, tools, and evaluation results shape each run as the application moves toward production.
The tradeoff comes from how LangSmith is packaged and scoped. Self-hosting is reserved for Enterprise customers, while gateway routing, response caching, and infrastructure correlation sit outside its current core workflow. If you need data control, release testing, gateway visibility, or AI traces tied to the rest of your production stack, you need to look for an alternative tool.
This guide compares the best LangSmith alternatives in 2026 based on the workflows they support. It covers all-in-one tracing and evaluation platforms, RAG debugging tools, AI gateways, and full-stack observability platforms.
What Is LangSmith?
LangSmith is an observability and evaluation tool for LLM applications and agents. It records each application run as a trace, showing how a request moves through prompts, retrieval, model calls, tools, and the final response.
It also supports prompt management, datasets, evaluations, feedback, dashboards, alerts, and cost tracking. It integrates directly with LangChain and LangGraph, so applications built with those frameworks can send traces to LangSmith with minimal setup. Other stacks can send trace data through supported integrations, manual instrumentation, or OpenTelemetry ingestion.
LangSmith helps you connect an output back to the steps that produced it. That makes it easier to debug agent behavior, compare prompt changes, review evaluation results, and track performance across production runs.
Why Teams Look for LangSmith Alternatives
Teams look for a LangSmith alternative when it starts limiting how they deploy, test, route, or monitor LLM applications in production.
Key Criteria for Evaluating LangSmith Alternatives
The right LangSmith alternative should help you investigate LLM behavior, test output quality, and keep telemetry under your control. Use these criteria to decide which tool fits your production workflow.
- Tracing depth: A useful trace follows the request from input to output. It should show the prompt, model calls, retrieved context, tool inputs and outputs, agent steps, latency, errors, metadata, and cost in the same execution path.
- Evaluation workflow: Trace review explains what happened in one run. A complete evaluation workflow tests quality across datasets, offline runs, live traffic, human review, LLM-as-judge scoring, regression tests, and CI/CD checks.
- Prompt management: Prompt changes need a clear history. Version tracking, diffs, rollback, staging and production labels, testing, and review workflows make it easier to connect an output change to the prompt edit that caused it.
- RAG and agent debugging: Retrieval and tool use often shape the final answer before the model generates it. A useful alternative should expose retrieval queries, source documents, retrieved chunks, tool inputs and outputs, intermediate steps, and the path an agent followed.
- Deployment and data control: LLM traces often include user inputs, prompts, retrieved documents, and tool outputs. The deployment model should match your data requirements, whether that means managed cloud, self-hosting, hybrid deployment, open source access, data residency, role-based access control, single sign-on, or a realistic path to operating the tool.
- Gateway and runtime controls: Some tools only record requests after they happen, while gateway tools control requests as they move through the system. Routing, model fallback, response caching, rate limits, redaction, spend limits, and request-level policies matter when the observability layer also sits in the request path.
- OpenTelemetry and portability: OpenTelemetry support is useful when telemetry remains reusable outside one product. Check whether the tool supports OTLP ingestion, GenAI semantic conventions, trace export, and compatibility with the observability stack you already use.
- Full stack correlation: Not every AI failure starts in the LLM layer. A production-ready observability setup should connect AI traces with logs, metrics, APM traces, service latency, Kubernetes pod health, CPU, memory, and network behavior.
- Cost and usage visibility: Production traffic turns small model choices into recurring costs. Token usage, model cost, latency, trace volume, retention, user-level breakdowns, project-level breakdowns, and spend limits help you see where that cost is coming from before it grows.
Best LangSmith Alternatives by Use Case
Now that you know what to look for, let’s see how the best LangSmith alternatives compare.
1. Langfuse - Best for Open-Source Self-Hosting and Data Sovereignty
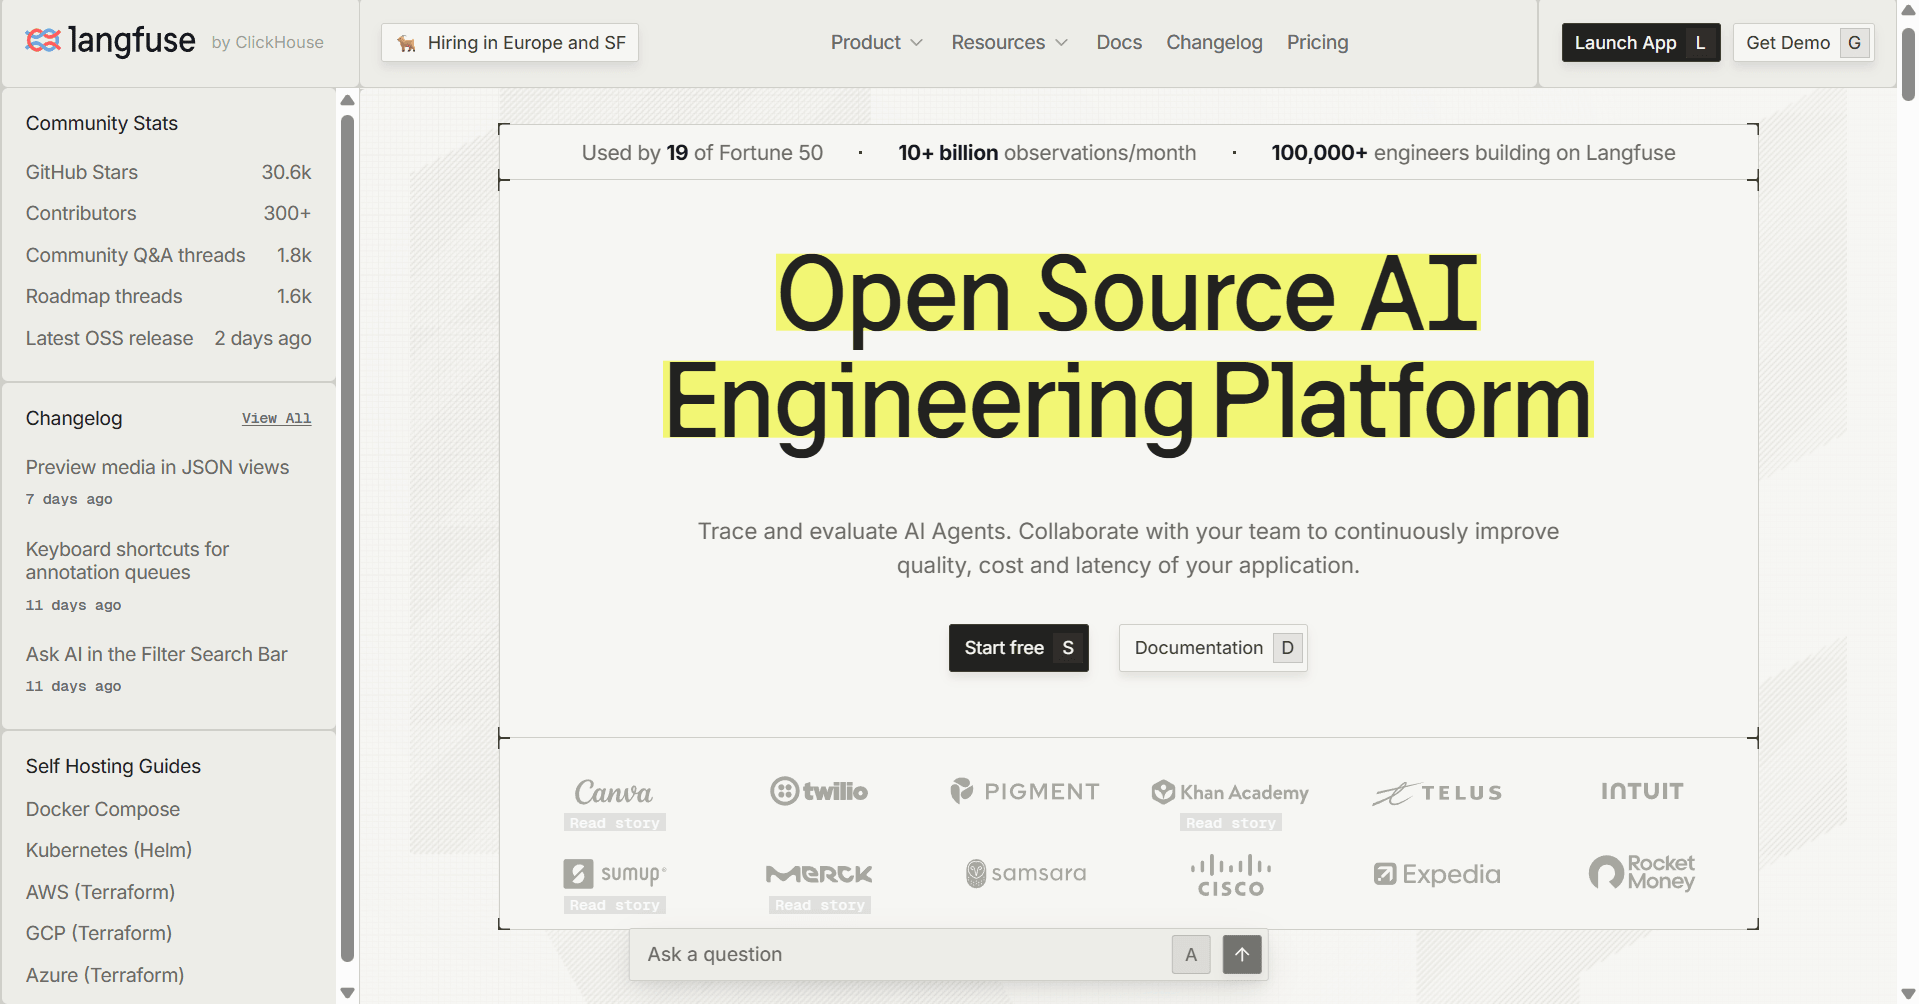
Langfuse is an open-source LLM engineering platform for tracing, prompt management, and evaluation. It covers the same core workflow as LangSmith, including trace capture, prompt management, dataset creation, and output evaluation. The difference is that you can use Langfuse Cloud or self-host the open-source version without losing the core platform features.
Key Features
- Traces LLM and non-LLM steps, including retrieval, embeddings, API calls, multi-turn sessions, user activity, and agent graphs.
- Supports native Python and JavaScript SDKs, more than 100 framework integrations, direct OpenTelemetry, and proxy-based logging through LiteLLM.
- Includes prompt management with prompt versions, deployments, Playground testing, and experiments tied to datasets.
- Supports LLM-as-judge, code evaluators, user feedback, manual annotation queues, and custom evaluation pipelines.
- Runs evaluations on production traces for online evaluation and datasets for offline testing.
- Includes token and cost tracking on every tier.
- Offers Langfuse Cloud, free open-source self-hosting, and paid Enterprise self-hosting with management APIs, project-level role-based access control, retention policies, and audit logs.
Main Limitations
- Langfuse is not a native AI gateway. It supports proxy-based logging through LiteLLM, but routing, caching, and fallback across providers require a separate gateway layer.
- Enterprise governance features, including SSO enforcement, fine-grained role-based access control, audit logs, SCIM, and custom rate limits, require Enterprise Cloud or the paid self-hosted Enterprise tier.
Pricing
Free cloud and self-hosted plans are available, with paid Cloud plans starting at $29 per month.
2. Braintrust - Best for Eval-to-Production CI/CD Pipelines
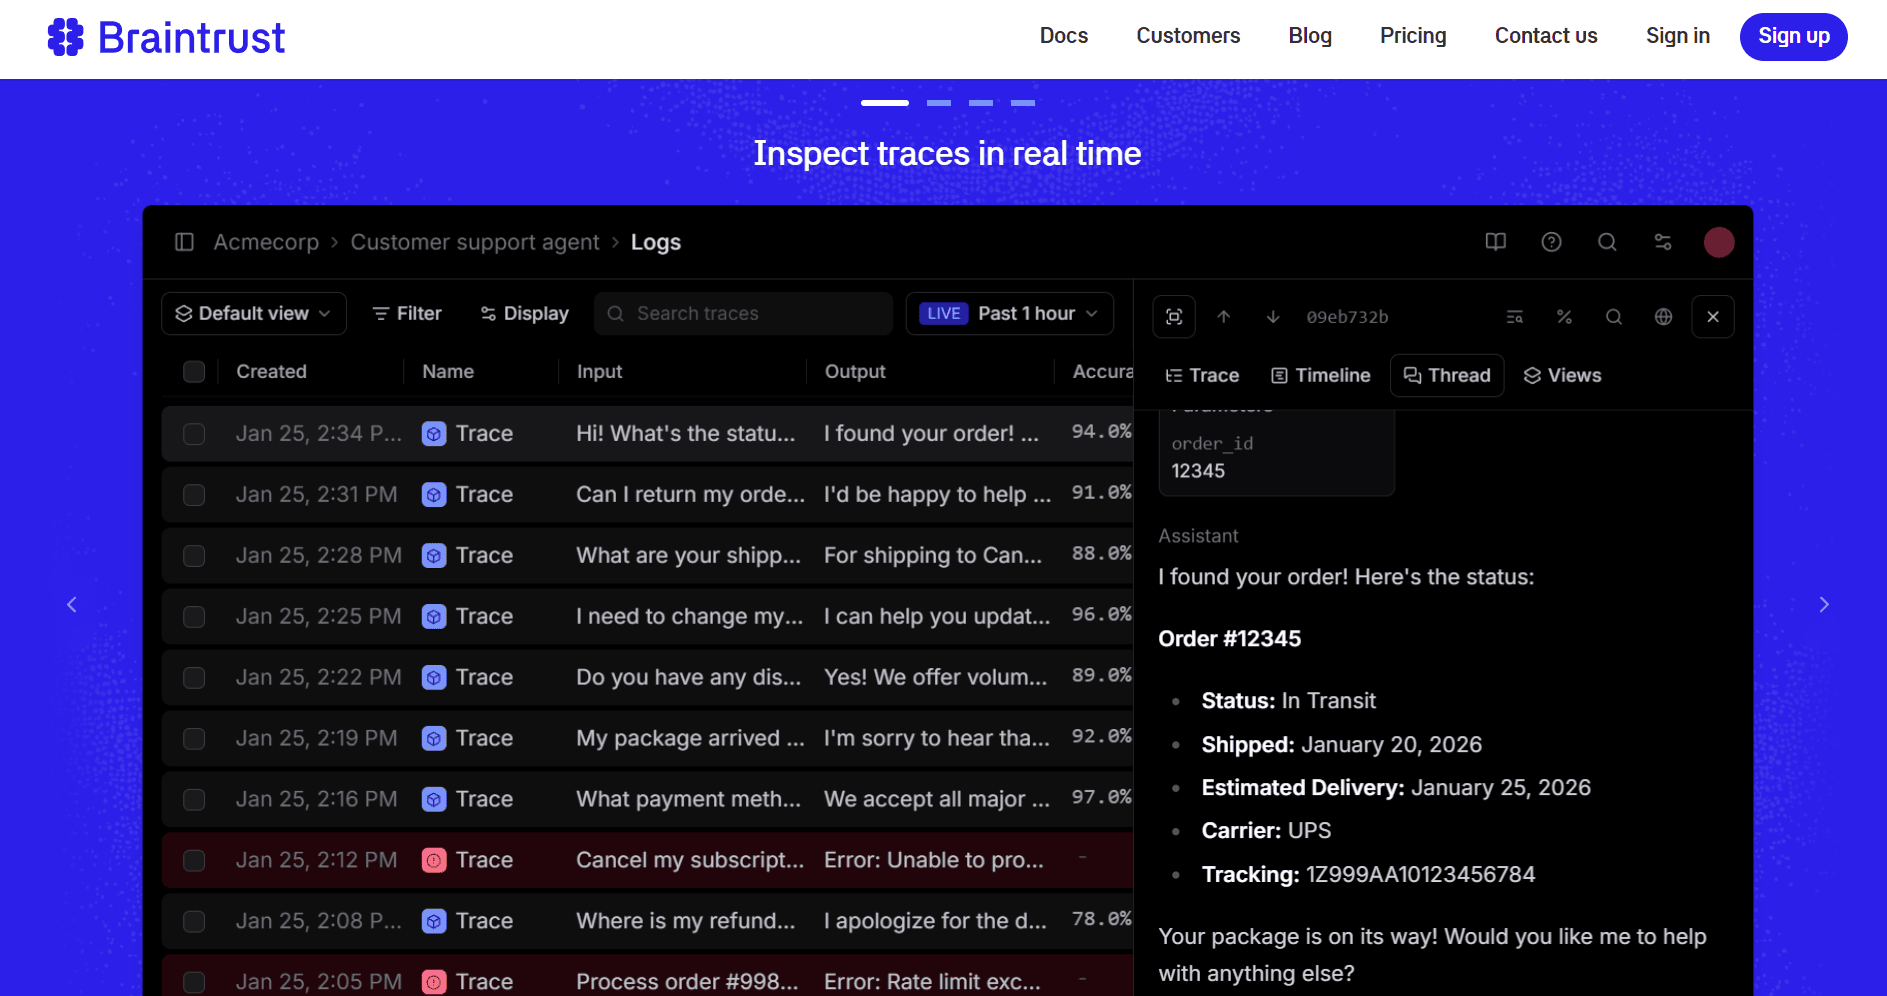
Braintrust is an AI observability platform built around evaluation. It connects production traces, annotations, datasets, experiments, and online scoring. That lets you test prompt, model, and agent changes against real examples before and after release.
Key Features
- Captures traces for LLM calls, application logic, retrieval, tool calls, inputs, outputs, latency, token usage, cost, errors, and custom metadata.
- Uses the same trace structure for production logs and experiments, so production data can become evaluation datasets.
- Supports datasets, experiments, custom scorers, Autoevals, human review, LLM-as-judge scoring, and online scoring for production traces.
- Includes Playgrounds for testing prompts, models, scorers, and agent code against real inputs.
- Supports CI/CD evaluation workflows for catching regressions before release.
- Provides a multi-provider gateway with a unified API, automatic caching, observability, and access to providers such as OpenAI, Anthropic, Google, and AWS.
- Offers SaaS, bring-your-own-cloud, and self-hosted deployment options for Enterprise customers.
Main Limitations
- Braintrust self-hosting keeps the data plane in your infrastructure, while the control plane, including the web UI, authentication, and user management, remains hosted by Braintrust.
- Bring-your-own-cloud and self-hosted deployment are Enterprise features, not options on Starter or Pro.
- Starter and Pro have short retention windows and usage limits, which may not suit high-volume production workloads.
Pricing
Braintrust has a free Starter plan, Pro starts at $249 per month, and Enterprise uses custom pricing.
3. Helicone - Best for Proxy-Based Drop-In Observability
Helicone is an open-source AI gateway and observability platform for LLM traffic. Applications send model requests through its OpenAI-compatible endpoint. The gateway handles routing, failover, caching, rate limits, and redaction, while Helicone tracks cost, latency, users, sessions, and custom properties for each request.
Key Features
- Provides an OpenAI-compatible AI gateway for routing requests across more than 100 models and providers.
- Supports automatic failover, caching, custom rate limits, redaction, and gateway-level request controls.
- Logs model requests with cost, latency, user analytics, custom properties, and session tracking.
- Includes HQL for querying logged request data on paid plans.
- Supports prompt storage and Playground testing.
- Offers datasets and scores for evaluation-related workflows.
- Uses an Apache-2.0 licensed open-source repository, with hosted and self-hosted deployment paths.
Main Limitations
- Helicone focuses on request-level gateway logs, so it is not the best choice if you need full run-tree tracing across retrievers, tools, and multi-step agent execution.
- Its dedicated Experiments workflow has been deprecated, so side-by-side prompt testing with evaluators is no longer part of the product.
- On-prem deployment, SAML SSO, and custom agreements require Enterprise.
- Hosted retention is limited on lower tiers, with 7 days on Hobby, 1 month on Pro, and 3 months on Team.
Pricing
Helicone has a free Hobby plan, with paid plans starting at $79 per month.
4. Arize Phoenix - Best for RAG Pipelines and Embedding Visualization
Arize Phoenix is an open-source AI observability and evaluation tool built on OpenTelemetry and OpenInference. It gives you a local-first way to trace model calls, retrieval, tool use, custom logic, prompts, datasets, and experiments without starting with a managed cloud product.
Key Features
- Captures model calls, retrieval steps, tool use, and custom logic in a single trace.
- Accepts traces over OTLP and supports OpenTelemetry-based instrumentation.
- Provides auto-instrumentation for LlamaIndex, LangChain, DSPy, Mastra, Vercel AI SDK, OpenAI, Bedrock, and Anthropic.
- Supports Python, TypeScript, and Java instrumentation paths.
- Includes LLM-as-judge and custom evaluators for scoring outputs and checking regressions.
- Supports prompt iteration, model comparison, and prompt versioning against production examples.
- Includes datasets and experiments for repeatable testing.
- Provides PXI, a built-in agent for debugging traces and iterating on prompts in context.
Main Limitations
- Phoenix is local-first and self-managed. Managed hosting, enterprise security, and dedicated support are handled through Arize AX, not the open-source Phoenix project.
- Arize AX Free and Pro are SaaS-only. Self-hosted AX deployment is available on Enterprise.
Pricing
Phoenix is free and self-hosted, while Arize AX has a free SaaS tier and paid plans starting at $50 per month.
5. MLflow - Best for Multi-Framework Enterprise Teams
MLflow is an open-source platform for tracing, evaluation, and prompt management in LLM and agent applications. It fits teams that want LLM observability alongside broader machine learning workflows, including experiment tracking, prompt versioning, evaluation datasets, and model lifecycle management.
Key Features
- Captures inputs, outputs, metadata, and intermediate steps for LLM and agent requests.
- Supports OpenTelemetry-compatible tracing, including GenAI semantic conventions for trace export and ingestion.
- Provides auto-instrumentation for OpenAI, LangChain, DSPy, Vercel AI SDK, and other frameworks.
- Supports manual instrumentation through the Python SDK.
- Includes trace sessions for grouping related requests.
- Supports prompt versioning through the Prompt Registry.
- Connects prompt evaluation with datasets and model comparisons.
- Runs as a free, self-hosted, open-source platform, with managed enterprise features available through Databricks.
Main Limitations
- Open-source MLflow is self-managed, so you need to host and operate it yourself.
- Managed MLflow is tied to Databricks rather than a standalone MLflow Cloud product.
- Databricks governance features, such as Unity Catalog, audit logs, and on-behalf-of-user authentication, are not part of open-source MLflow.
Pricing
Open-source MLflow is free and self-hosted, while managed MLflow is billed through Databricks platform pricing.
6. SigNoz - Best for Unified LLM and Full-Stack Observability
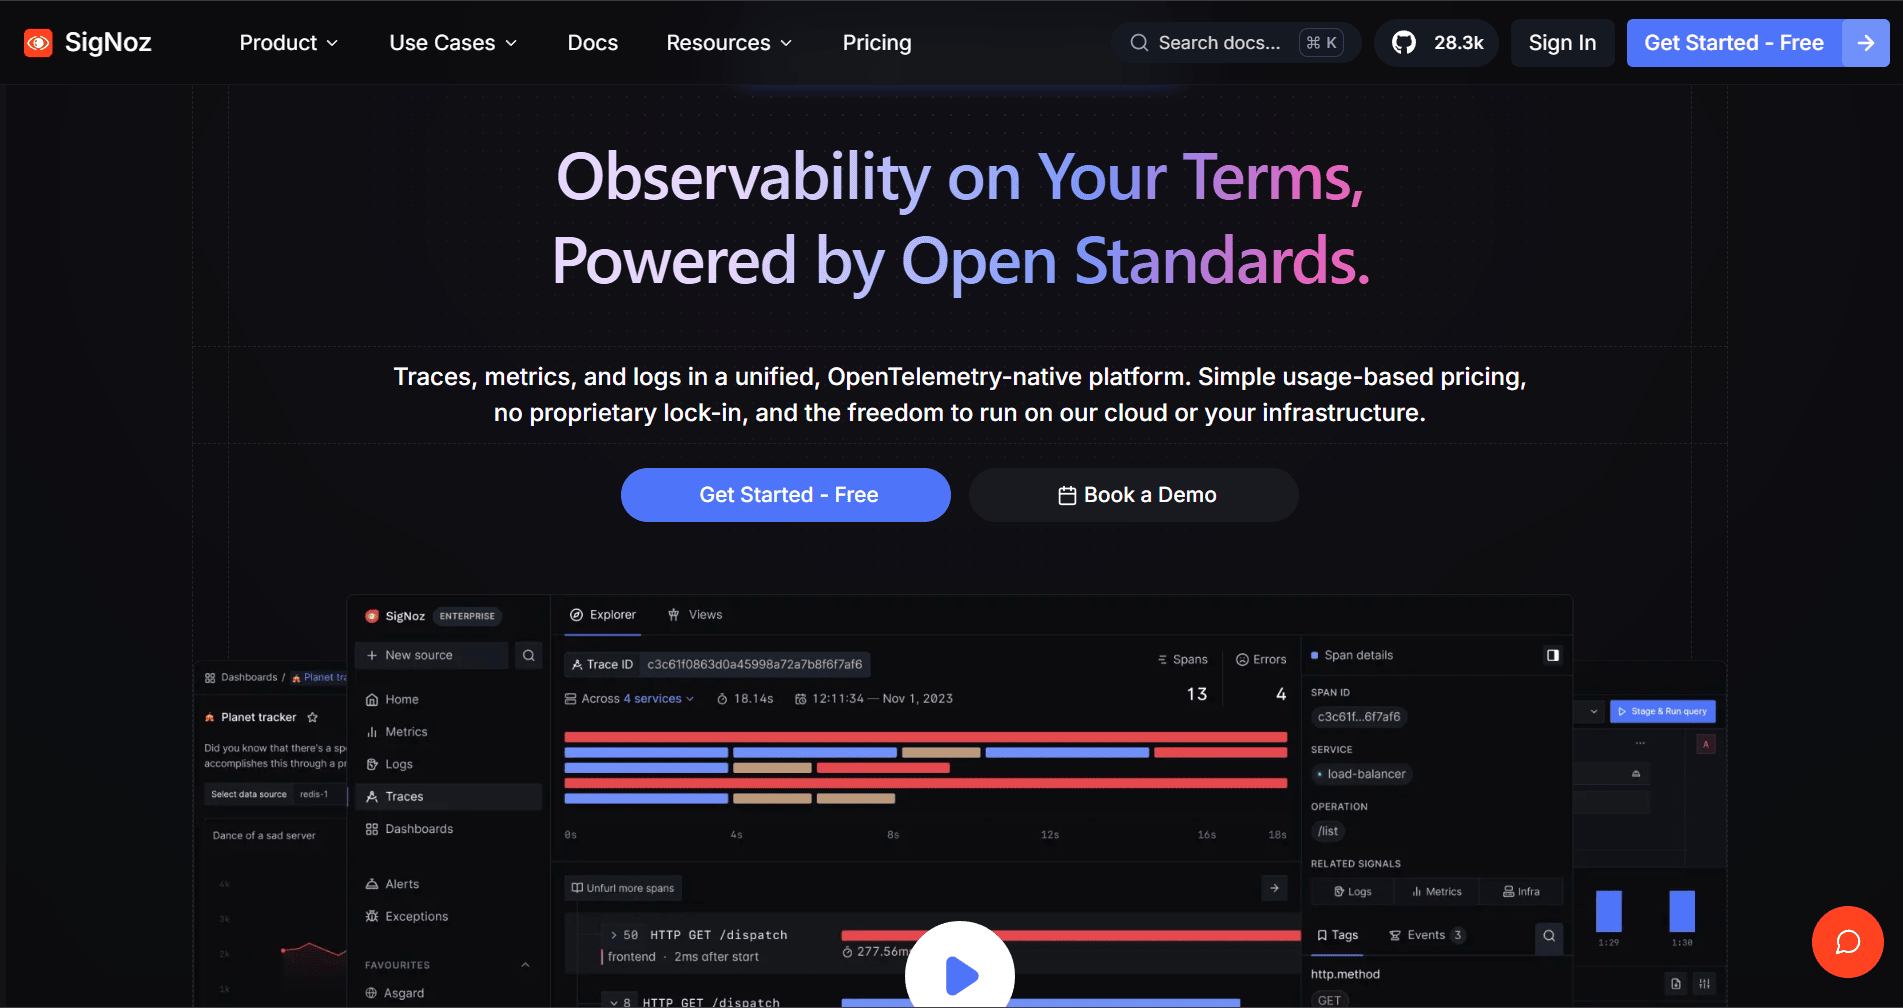
SigNoz is an open-source, OpenTelemetry-native observability platform with LLM observability built into the same environment as traces, logs, metrics, infrastructure monitoring, and alerts. It connects AI traces with the services, databases, containers, and Kubernetes workloads that support them.
Key Features
- Connects LLM traces with logs and infrastructure metrics in the same observability platform.
- Shows model calls, tool invocations, and reasoning steps in distributed traces.
- Tracks token usage and cost by model, operation, and user.
- Supports budget alerts and alerting on trace or metric attributes.
- Includes Kubernetes, Docker, host, and database monitoring alongside LLM traces.
- Provides integrations for LangChain, LlamaIndex, CrewAI, Haystack, AutoGen, Pipecat, and other LLM frameworks.
- Runs as a free, open-source, self-hosted platform, with Cloud and Enterprise deployment options.
Main Limitations
- Prompt management is handled through integrations rather than as a native SigNoz workflow.
- LLM evaluation and scoring rely on upstream tools. This is because SigNoz does not provide native datasets, prompt experiments, or LLM-as-judge workflows.
Pricing
SigNoz has a free self-hosted Community Edition, with Cloud pricing starting at about $49 per month.
7. Datadog LLM Observability - Best for Teams Already on Datadog
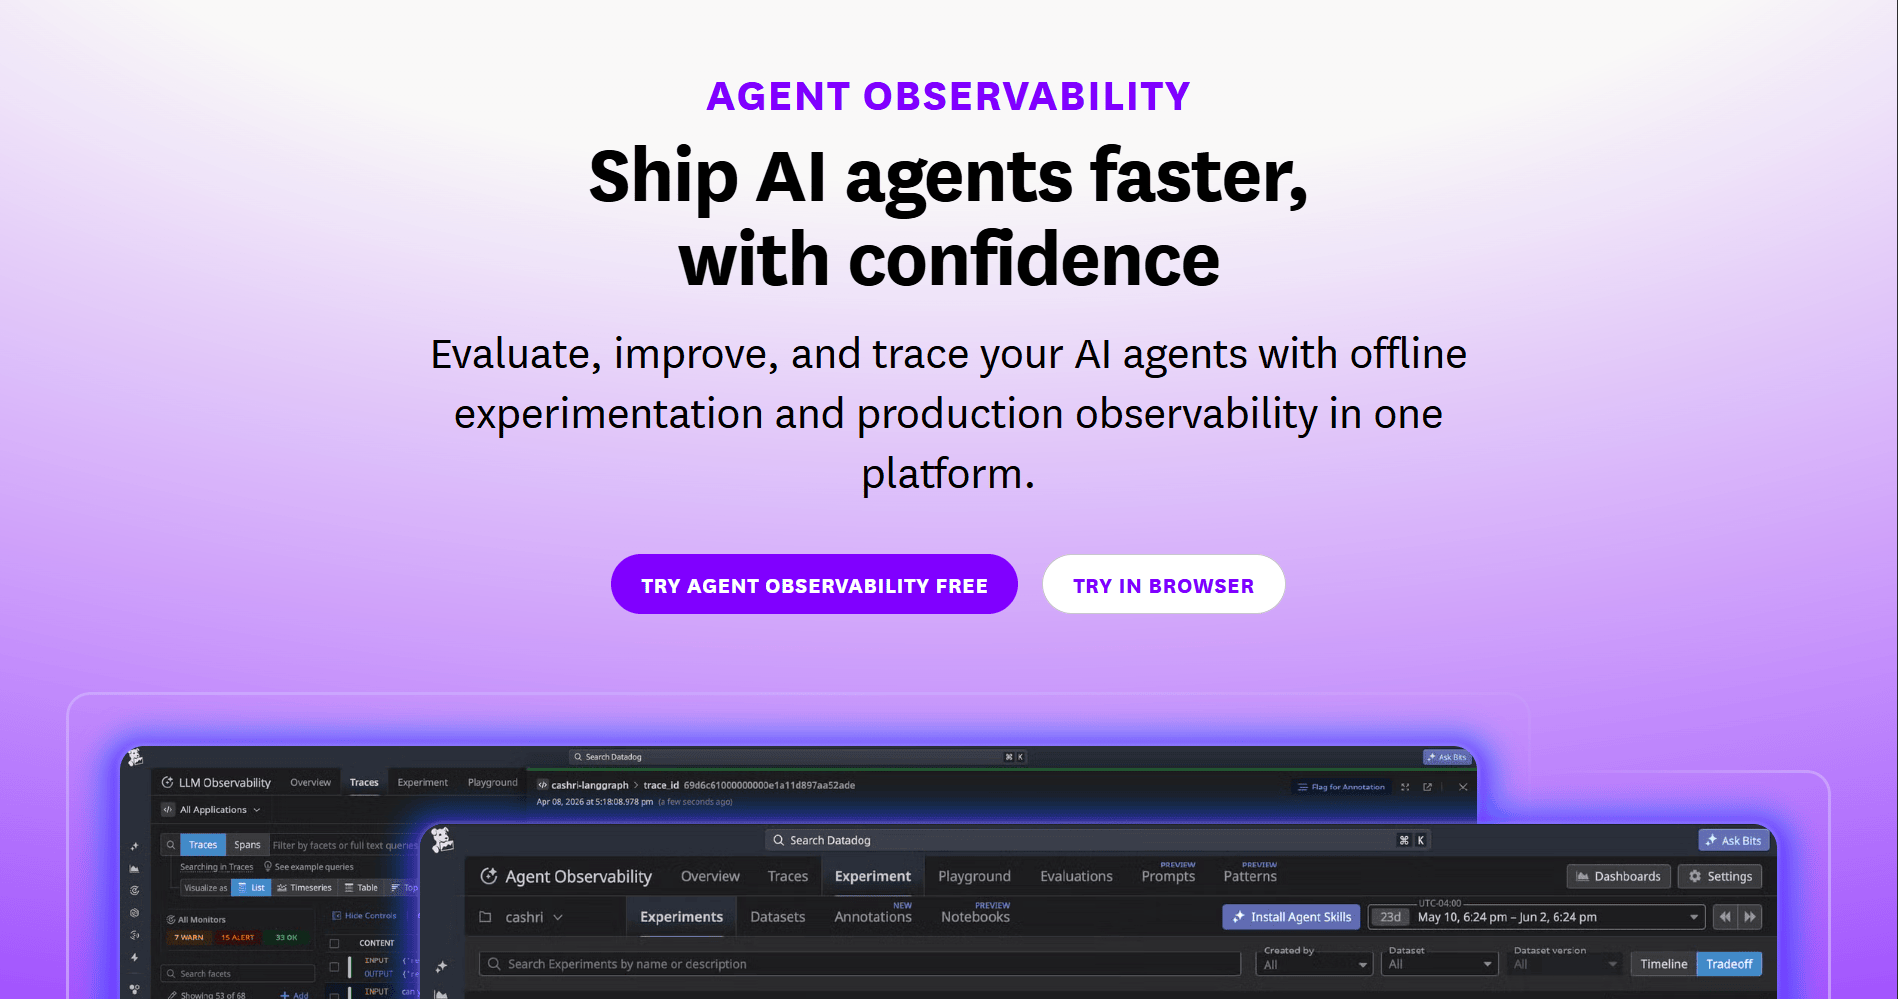
Datadog LLM Observability monitors LLM-powered applications inside the broader Datadog platform. It places AI traces beside APM, infrastructure monitoring, logs, and security signals, so each request can be reviewed with the production context around it. Each request is represented as a trace, with spans for model calls, tool calls, and agent decisions.
Key Features
- Represents each LLM application request as a trace with spans for model calls, tool calls, and agent decisions.
- Shows chain steps, calls, and dynamic agent workflows for root-cause analysis.
- Estimates LLM cost from provider pricing and token counts, with support for custom rates.
- Breaks down cost by model, request, provider, application, and model version.
- Includes evaluations, experiments, prompt tracking, and agent monitoring.
- Uses Patterns to cluster production traffic and surface common user topics or quality trends.
- Connects LLM traces with Datadog APM, infrastructure monitoring, logs, and related production signals.
Main Limitations
- Datadog does not offer a self-hosted or bring-your-own-cloud deployment path for the platform itself.
- Using Datadog LLM Observability usually means adopting Datadog’s broader platform, setup, and billing model.
Pricing
Datadog Agent Observability has a free tier with up to 40,000 LLM spans per month, while Pro starts at $160 per month.
LangSmith Alternatives Compared: Overview
Here’s a quick snapshot of the LangSmith alternatives covered above, based on how each one is deployed, where it is strongest, pricing, and the use case it supports best.
How to Migrate From LangSmith Without Rewriting Your Instrumentation
Migrating from LangSmith without rewriting instrumentation means preserving the code that creates traces, then changing where those traces are sent. Start with the trace entry point, test the new destination in parallel where possible, and cut over only after the new tool shows the same execution path as LangSmith.
Step 1: Identify the Current Trace Entry Point
Check whether LangSmith receives traces through LangChain, LangGraph, OpenTelemetry, or LangSmith-specific calls such as `@traceable`, context managers, or RunTree. This decides the migration path. Framework and OpenTelemetry tracing usually require configuration changes, while LangSmith-specific wrappers require a smaller code remap around the tracing layer.
Step 2: Redirect OpenTelemetry Traces First
If your app already emits OpenTelemetry traces, point the exporter to the new OTLP endpoint and update the required headers. The same spans can reach another backend without changing the application functions that created them. During testing, an OpenTelemetry Collector can send the same spans to LangSmith and the replacement tool so you can compare both outputs.
Step 3: Swap Framework Integrations Before Changing Logic
For LangChain and LangGraph apps, keep the chain, graph, retriever, tool, and model logic unchanged. Replace the LangSmith tracing setup with the new tool’s framework integration, then run the same requests again. The new trace should still show model calls, retriever steps, tool calls, agent steps, errors, token fields, and cost fields.
Step 4: Remap LangSmith-Specific Wrappers Only if Needed
If the app uses `@traceable`, RunTree, or LangSmith context managers directly, remap those calls only after checking whether a framework or OpenTelemetry path is enough. When remapping is required, change the tracing wrapper to the new tool’s decorator, span API, or OpenTelemetry span. The retrieval logic, tool code, and model-call flow should stay where they are.
Step 5: Validate Trace Parity Before Cutover
Do not turn off LangSmith as soon as traces appear in the new tool. Compare the same request in both systems and check span count, nesting, retriever spans, tool calls, model calls, token fields, cost fields, and errors. If the new tool flattens steps that LangSmith showed separately, fix the trace mapping before cutting over.
Infrastructure Observability Alongside LLM Tracing: Closing the Visibility Gap with groundcover
LLM tracing shows how prompts, retrieval, model calls, tools, and agent steps produced a result, but it does not show the Kubernetes, service, log, metric, trace, and infrastructure signals around that workflow. groundcover adds that runtime context, so production debugging can include both AI behavior and the system running it.
Runtime Context for the System Behind the AI Workflow
A slow model call, failed tool step, or retrieval issue may appear first in an LLM trace. groundcover connects that behavior with Kubernetes workloads, service traffic, logs, metrics, traces, and infrastructure events. You can then check pod restarts, node pressure, database latency, service failures, and configuration changes without separating the AI trace from the system running it.
eBPF-Based AI API Capture Without SDK Code
groundcover uses eBPF to detect supported AI API calls from workloads running on monitored nodes. It captures model names, latency, token usage, cost, prompts, and responses without adding SDK code for each call. The same eBPF path also supports service-level visibility by reconstructing traffic such as HTTP requests, responses, and SQL queries.
OpenTelemetry for the Full Agent Workflow
eBPF shows the individual AI call. OpenTelemetry adds the workflow around that call, including agent spans, tool execution chains, conversation context, tool arguments, and tool results. That means you can start with automatic per-call LLM visibility, then add instrumentation when you need the full path across an agent workflow.
Kubernetes, APM, Logs, and Metrics Around LLM Apps
LLM applications still depend on production infrastructure. groundcover monitors clusters, nodes, pods, containers, workloads, services, logs, metrics, traces, APM signals, pod lifecycle events, OOM kills, crashes, and configuration changes. Those signals help you see whether the issue came from the AI workflow or from the services and infrastructure supporting it.
AI-Assisted Investigation Using Agent Mode
Agent Mode lets you @mention` groundcover’s AI assistant from the product, Slack, or Linear while you investigate the system around an LLM app. It queries the same logs, metrics, traces, and events that groundcover uses for runtime context, so you can ask what changed, which dependency slowed down, or why a workload is behaving differently. The output can become gcQL queries, dashboards, monitors, or OTTL pipelines, keeping infrastructure investigation beside LLM tracing instead of moving it into a separate tool.
Data Control for Sensitive AI Payloads
AI telemetry can include prompts, responses, user inputs, retrieved context, and internal tool output. groundcover’s bring-your-own-cloud model keeps captured data in the customer environment. Its AI Observability privacy controls also support content stripping for prompts and responses, with the docs describing prompt and response stripping as best-effort.
Conclusion
LangSmith combines tracing, prompt management, and evaluation in one platform. It has native support for LangChain and LangGraph, direct integrations for other frameworks, and OpenTelemetry for broader instrumentation. The right alternative depends on what you need to change first: deployment control, evaluation workflow, gateway visibility, RAG debugging, OpenTelemetry support, or full-stack production context.
LLM tracing should not be the only view once an application runs in production. It explains the prompt, model, retriever, tool, and agent path, but infrastructure observability explains the services, pods, logs, metrics, traces, and runtime events around that path. A reliable setup gives you both views, so debugging can move from AI behavior to the system running it without losing context.














.svg)