Kubernetes Latency: Causes, Metrics & How to Reduce It


You’ve carefully designed a Kubernetes cluster. You’ve ensured that it has an adequate number of nodes, and sufficient amounts of storage, CPU, and memory, to support your workloads. You’ve used requests and limits to help optimize resource allocations. You’ve configured replica sets to boost reliability. You’ve optimized your application logic to supercharge performance.
Despite all of this, you find that your cluster is experiencing high rates of Kubernetes legacy, meaning that it is slow to respond to requests. This is a common scenario because even the best-designed clusters can run into latency issues. It’s also, unfortunately, not always a simple issue to solve, due to the many factors that can cause Kubernetes latency.
But with the right observability strategy and data, it is possible to conquer Kubernetes latency challenges, as we explain below.
What is Kubernetes latency, and why does it matter?
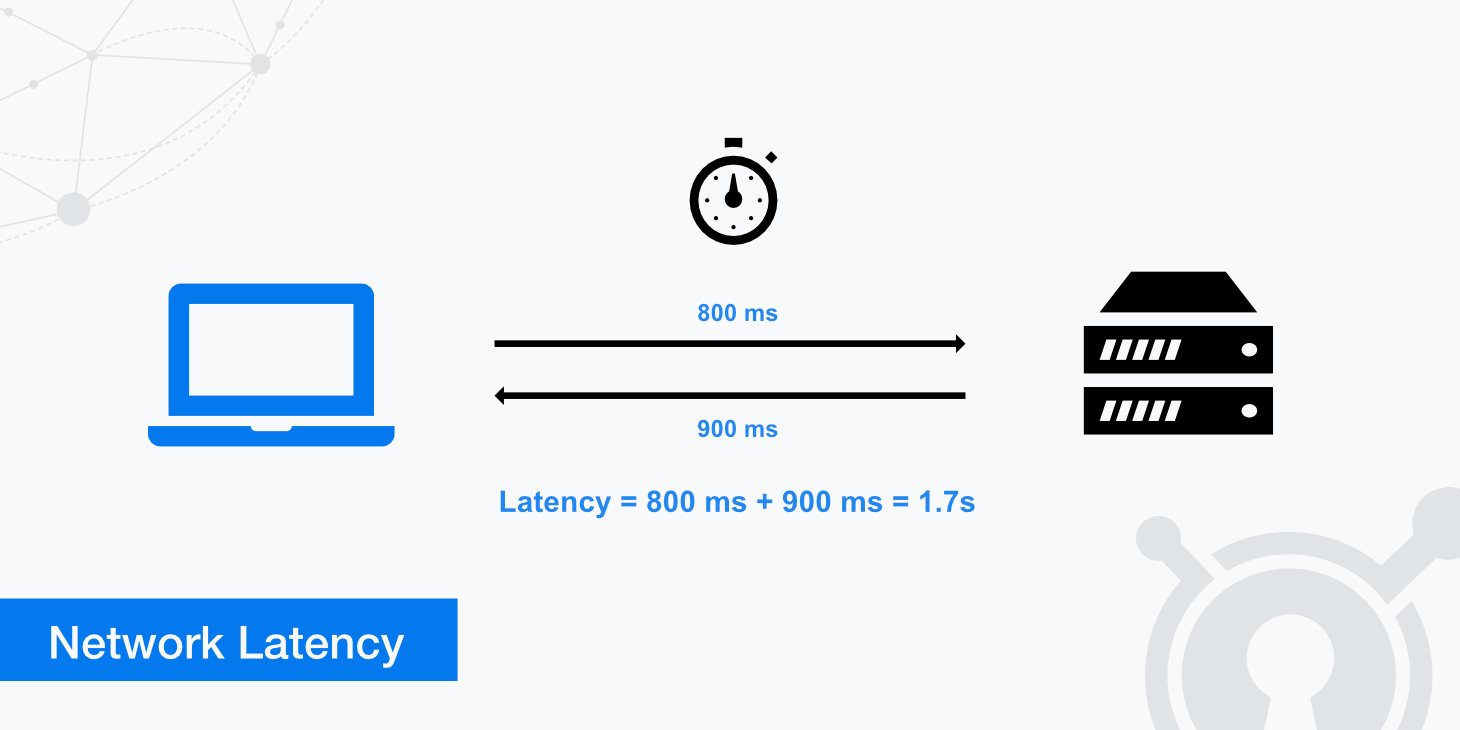
Kubernetes latency refers to delays in the time between when a cluster, application, or service receives a request and when it sends the response back.
For example, imagine that you have a Web application running as a Pod in your Kubernetes cluster. Every time a user opens up a new page in the app, the Pod has to process a request to render the data on the new page. If it takes 100 milliseconds for the Pod to generate this data and send it back to the user, the Pod’s latency rate would be 100 milliseconds.
Latency - which is usually measured in milliseconds (meaning thousands of a second) - is important because high latency metrics cause poorer performance. The longer users have to wait for a response to their requests, the poorer their experience is likely to be.
In addition, from a resource-efficiency standpoint, latency is important because one cause of high latency can be poor resource utilization, such as an application that takes a long time to process requests due to the need for a high amount of CPU time to handle each request. In this sense, identifying and mitigating latency issues can help to improve the overall resource efficiency of a Kubernetes cluster.
Importantly, latency is never zero. Some degree of latency is inevitable because there is always a delay in the time it takes data to move over the network, or even within the same local system. But typically, teams aim to keep latency rates under about 100 milliseconds. Some types of workloads (like real-time data processing operations that help guide autonomous vehicles, or high-frequency financial trading) might require latency rates that are extremely low - under 1 millisecond in some cases.
Common causes of Kubernetes latency in production
As we mentioned, there are many potential reasons why a Kubernetes cluster or workload might experience high latency rates. Common culprits include:
- Insufficient resources: If a cluster lacks enough CPU or memory to enable efficient processing of a request, or if a resource limit is in place that restricts how many resources a particular workload can consume, it may take a long time to handle requests, leading to high latency.
- Slow Pod startup: Delays in the Pod startup process (such as Pods becoming stuck in the pending state) can trigger high latency rates because Pods can’t fulfill requests until they are fully up and running.
- CPU throttling: Sometimes, Kubernetes will restrict workloads’ access to CPU resources through a feature known as CPU throttling, which is designed to prevent systems from crashing during periods of high CPU utilization. While throttling does help maintain stability, it often comes at the expense of higher latency rates, since less CPU availability can create performance bottlenecks and slow down request processing.
- Network errors and inefficiencies: Networking problems, such as unreliable networking equipment, Kubernetes DNS failures, inefficient routing, or high rates of packet loss, can cause Kubernetes latency because they create network bottlenecks and slow down the rate at which data can flow successfully over the network.
- Application bugs: Buggy or poorly written code inside containers may cause problems like memory leaks or inefficient use of CPU resources, leading to delays in request processing.
- Slow storage I/O: For stateful applications that need to read and write data to disk when processing a request, slow input/output (I/O) rates (which usually result from limitations in the underlying storage hardware) can contribute to high latency.
Network-related sources of Kubernetes latency
We touched on how networking problems can contribute to Kubernetes latency above. But this topic merits its own sections, since there are multiple types of networking issues that could cause high latency in Kubernetes:
- Absent or poorly configured load balancing and ingress: Load balancers and ingress controllers (like the NGINX ingress controller) can distribute requests across application instances in a way that optimizes the use of application resources. If you don’t set up a load balancer and ingress, or if you implement traffic management rules that fail to distribute requests efficiently, you might end up with high latency because some of your application instances are overwhelmed with requests while others sit idle.
- DNS problems: Kubernetes uses an internal DNS system to enable applications and services to discover and talk to each other over the network. If DNS operations become slow, which may happen due to issues like the DNS service becoming overwhelmed with requests or connectivity problems, they can slow down the processing of requests that require resources to interact with each other.
- Limited network bandwidth: Latency can increase if the network infrastructure that connects internal Kubernetes resources, or the networks that connect a cluster to external endpoints, is limited in bandwidth. This leads to network congestion because there’s not enough bandwidth to handle all requests, causing some to be delayed or dropped.
- Packet loss: Packet loss happens when data on a network fails to reach its destination. There are multiple potential causes, including limited network bandwidth, networking hardware failures, and buggy application code, but they all have the effect of contributing to high latency.
Kubernetes control plane latency and its impact
So far, we’ve looked mostly at latency issues associated with Kubernetes workloads and the way they are configured.
Another important aspect of Kubernetes latency is the control plane, meaning the software responsible for managing Kubernetes itself. While control plane latency is typically not an issue in healthy, well-configured clusters, it can become a problem under scenarios like the following:
- Insufficient resources on control plane nodes: The control plane software is hosted on special nodes. If those nodes lack enough CPU or memory to support cluster operations, the control plane may slow down.
- Overloaded API server: The Kubernetes API server is responsible for issuing instructions to worker nodes and the workloads running on them. If the API server becomes flooded with requests, or can’t process requests quickly enough due to limited CPU or memory availability, performance bottlenecks and latency will occur.
- Etcd performance issues: The Kubernetes control plane uses a key-value store called Etcd to store configuration data. If Etcd becomes slow due to problems like not having enough resources or having corrupted configuration data, control plane operations may slow down.
- Control plane connectivity issues: Control plane latency may occur if control plane nodes can’t connect reliably to the rest of the cluster. This leads to situations such as an inability to schedule Pods or manage resource allocations effectively.
When control plane latency issues like these arise, they can impact all workloads because the longer it takes the control plane to process requests and manage the cluster’s state, the slower overall workload performance is likely to become. So, while it’s important to monitor and manage latency for individual Pods and services, you also want to pay attention to control plane latency.
Application and dependency-driven Kubernetes latency
Sometimes, most workloads within a cluster are performing fine from a latency perspective, but a certain application is experiencing latency issues.
This usually results from either:
- Issues with the application code, such as inefficient data processing algorithms. To fix this issue, you typically need to update the application logic.
- Problems with the configuration for the Pod or containers that host the application. For example, resource limit settings may be too low, or an admin might have assigned containers to run on a specific node when that node doesn’t have enough resources to support them. The solution in this case is to modify the workload configuration.
Key metrics for measuring Kubernetes latency
At a high level, the main metric you need to track to measure Kubernetes latency is just that: Latency. Latency is a metric unto itself that you can measure by monitoring the time between when a request is sent and when it is received.
But to be more granular, there are specific types of latency-related metrics that you’ll want to track from across various parts of your Kubernetes cluster, including:
- API request duration: You can track apiserver_request_duration_seconds data to monitor how long control plane API requests take to process.
- Etcd throughput: Monitoring read/write duration for Etcd provides insight into whether Etcd problems are triggering cluster-wide latency issues.
- Network transit times: Track the time between when an endpoint sends data and when it’s received by the destination to measure the effectiveness of Kubernetes network performance.
- DNS lookup times: Monitoring how long it takes to look up records in the Kubernetes DNS service will provide an indication of whether DNS problems may be causing Kubernetes latency.
- Application latency: Application latency (sometimes also called request duration) measures how long it takes individual applications to respond to requests.
- Application request rate: Request rate isn’t a direct measure of latency, but it provides important context by measuring how many requests an application receives per second or minute. You may notice that latency spikes when request rates are high, which often means that the application lacks enough resources to perform well under heavy load.
- Resource usage: CPU and memory utilization metrics also provide important context for helping to understand latency patterns in Kubernetes.
How to monitor Kubernetes latency effectively
There are two key steps to effective Kubernetes latency monitoring.
The first is to ensure that you’re comprehensively collecting relevant latency data. As we explained in the preceding section, this means tracking a variety of performance metrics that monitor and contextualize latency rates across all parts of your cluster. It’s not enough to measure just certain latency metrics (like application request latency), since this doesn’t provide the holistic context you need to track latency effectively.
The other key element of latency monitoring in Kubernetes is having the contextual data necessary to investigate and correlate latency issues. For instance, knowing whether latency spikes correlate with higher rates of CPU utilization is important for determining whether latency issues stem from limited CPU availability, or from a separate problem (like network bandwidth and network congestion limitations).
Kubernetes latency in multi-zone clusters
Some special considerations apply to managing Kubernetes latency in clusters that include multiple zones, meaning geographically distinct regions. Multi-zone clusters are relatively unusual, but organizations might deploy them if they have servers located in different data centers or cloud regions that they want to manage using a single control plane.
In this type of cluster, the main latency challenge is the time it takes to move data across the network between geographically distant areas. Usually, network transit times are much slower when data has to move over the Internet than they are on a local network. With a multi-zone cluster, you’ll typically need to rely on the Internet for your control plane to talk to the various zones within the cluster, since they won’t be on the same local network as the nodes.
There’s no easy way to mitigate this challenge, but monitoring the network to detect latency issues is important. It may also be possible to reduce inter-zone latency using interconnect services, which provide dedicated connections between cloud regions or data centers that are faster than the generic Internet - although these also come with a higher cost.
The other solution is to avoid multi-zone clusters altogether and operate a separate cluster for each location in your IT estate. This prevents the convenience of centralized management, but it will typically result in better Kubernetes latency.
Kubernetes latency introduced by service meshes
Service meshes, which manage communications between services within a Kubernetes cluster, may increase latency. This is mainly because every time services need to talk to each other, they have to send data through the service mesh first, which increases the amount of processing that needs to happen to serve each request.
On a well-configured service mesh, latency overhead should be minimal. But if you think your service is contributing to high latency, consider boosting the amount of resources available to the mesh (which can speed processing). You can also allow certain services to communicate directly with each other, rather than through a service mesh, as a way of bypassing mesh-related latency problems.
Best practices for preventing and reducing Kubernetes latency
Given that there are many potential causes of Kubernetes latency, there is no “one simple trick” for fixing latency issues. But the following practices tend to help:
- Ensure adequate resource availability: Provide nodes and applications with enough CPU and memory to ensure adequate performance. Consider using autoscaling to keep resource allocations aligned with requirements.
- Simplify network design: In general, simpler network architectures lead to lower latency because they reduce the number of hops that data needs to pass through to reach its destination.
- Use DNS caching: It’s possible to deploy DNS caching agents on each node. This reduces the number of DNS requests that need to travel across the network. The downside is that the local cache could become outdated if network configuration data changes frequently.
- Use service meshes strategically: Although service meshes may increase latency, they can also reduce it in many cases by allowing services to identify each other more efficiently, which reduces the rate of request delays related to failed network lookups.
- Optimize application code: Optimizations to internal application logic can speed the processing of requests at the application level.
- Deploy multiple control plane nodes: Having redundant control plane nodes can reduce the risk of latency caused by the control plane becoming overwhelmed.
Troubleshooting Kubernetes latency issues
To troubleshoot Kubernetes latency problems, work through the following steps:
- Identify the affected components: Start by determining which parts of your cluster the latency issues impact. Is it just a particular workload, for example? Or is it a cluster-wide issue?
- Inspect relevant metrics: Once you know the scope of the failure, analyze performance metrics for the affected component. For example, if it’s just one Pod that is experiencing high latency, look at the request rate and resource utilization data for that Pod.
- Infer the cause: By correlating relevant metric data, form a hypothesis about what the cause of the problem is. For instance, if latency surges when a Pod’s memory is being maxed out, you can infer that a lack of memory is causing the latency.
- Mitigate the issue: Finally, address the root cause of the problem to improve latency. If limited memory is the issue, for example, you’d increase the memory limits for the Pod or (if your cluster’s total memory is being maxed out) add more memory by adding nodes to the cluster.
Real-time Kubernetes latency visibility with groundcover
When it comes to collecting the comprehensive, holistic data admins need to detect and troubleshoot Kubernetes latency effectively, groundcover has the answer. groundcover continuously tracks a broad range of latency-related metrics, in addition to relevant contextual information.
.png)
The result is the ability to get to the root of latency issues fast, no matter which part of the cluster they impact or what the underlying cause is.
Laying Kubernetes latency issues to rest
Latency issues are one of the fastest ways to ensure that end-users have a bad experience, which is why monitoring for Kubernetes latency problems and taking steps to reduce latency risks is such an important part of a Kubernetes admin’s job. With the right observability data and tools on your side, you can squelch latency before it ruins your users’ days.


.svg)