Autonomous infrastructure starts with better data
Autonomous infrastructure optimization depends on data as much as on good predictive algorithms. To lower requests safely, a system has to see how every workload on a node behaves, at a resolution fine enough to capture short bursts and over a history long enough to capture patterns. Most monitoring stacks cannot provide that data at an acceptable cost. This post explains how groundcover's eBPF sensor and BYOC architecture produce high-resolution time series, uses CPU monitoring as an example of what lower-resolution data misses, and explains why that data makes node-level Autonomous Infrastructure possible.

Autonomous infrastructure optimization depends on data as much as on good predictive algorithms. To lower requests safely, a system has to see how every workload on a node behaves, at a resolution fine enough to capture short bursts and over a history long enough to capture patterns. Most monitoring stacks cannot provide that data at an acceptable cost. This post explains how groundcover's eBPF sensor and BYOC architecture produce high-resolution time series, uses CPU monitoring as an example of what lower-resolution data misses, and explains why that data makes node-level Autonomous Infrastructure possible.
What eBPF and BYOC give groundcover
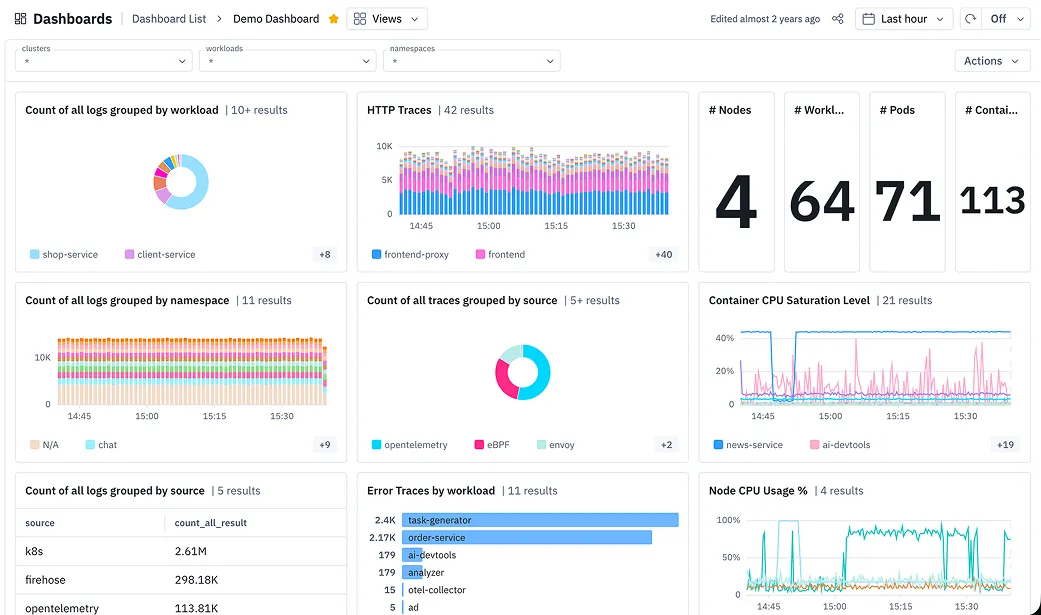
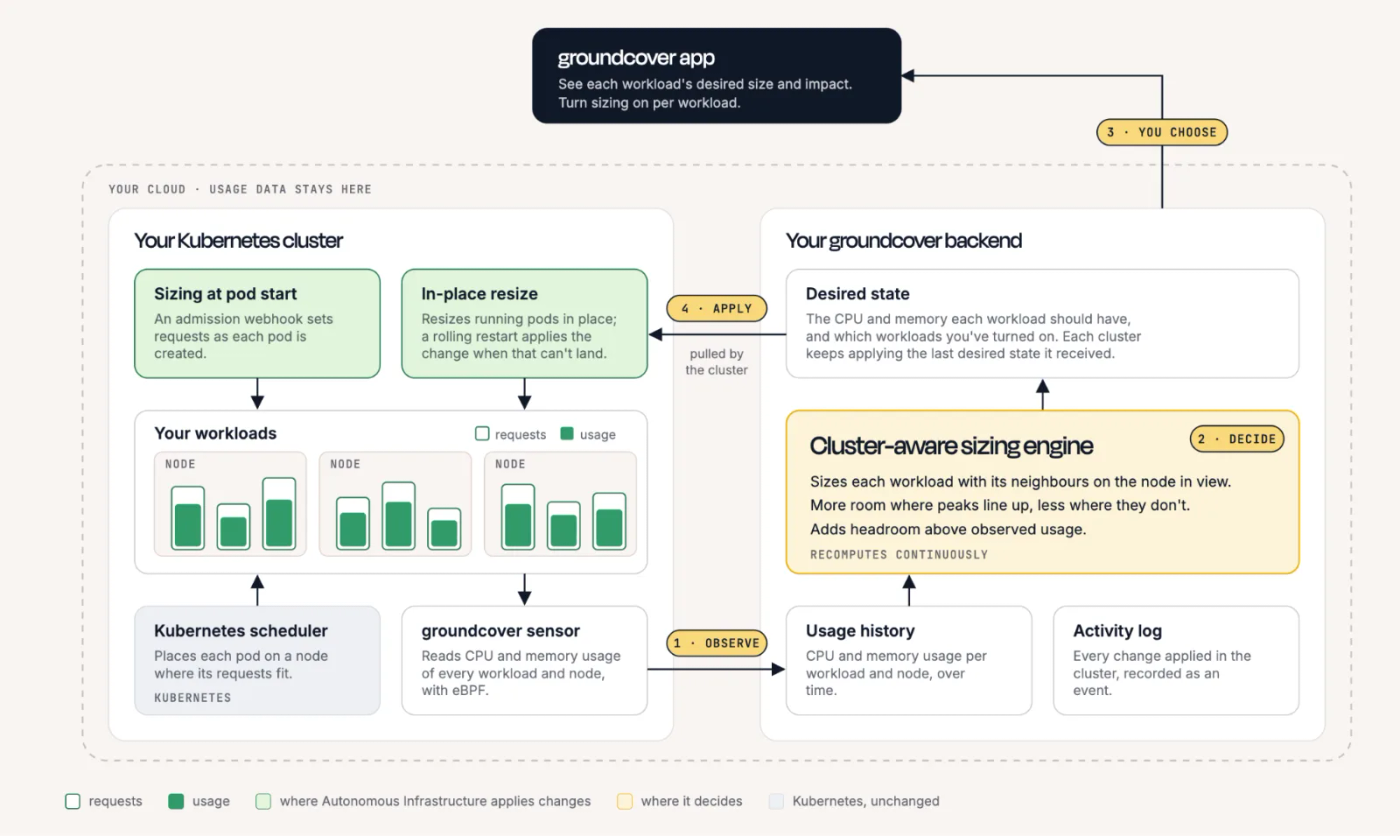
groundcover's data starts at the Linux kernel. The groundcover sensor runs as a DaemonSet on every node and uses eBPF to collect resource usage, process and network data directly from the kernel, without application code changes, SDKs or exporters. Because every container on a node is measured from the same source, its usage can be correlated with the usage of its neighbors at the same moment. groundcover collects resource data at 5-second intervals, three times the granularity of a typical 15-second scrape! Most Prometheus setups settle on 15 seconds or longer because every scrape costs CPU and network on both the exporters and the monitoring backend, and that load grows with every container and series. groundcover's sensor reads the data from the kernel with eBPF on the node itself, without a scrape round trip to each exporter, so a shorter interval does not carry the same overhead. Collecting Pressure Stall Information (PSI) for every container, which shows how long workloads waited for CPU, memory and I/O, not only how much they used, is on groundcover's roadmap.
High resolution is only useful if it can be retained, and BYOC (bring your own cloud) addresses retention. groundcover stores data in the customer's own cloud account, so storage cost follows the customer's infrastructure cost rather than the classic per-metric or per-GB pricing which teams typically need to lengthen scrape intervals, downsample older data or keep only aggregates to control cost. With BYOC, keeping high-resolution history for every container for weeks becomes affordable. The value of that combination is clearest in how CPU usage is usually measured.
What a 15-second slope hides
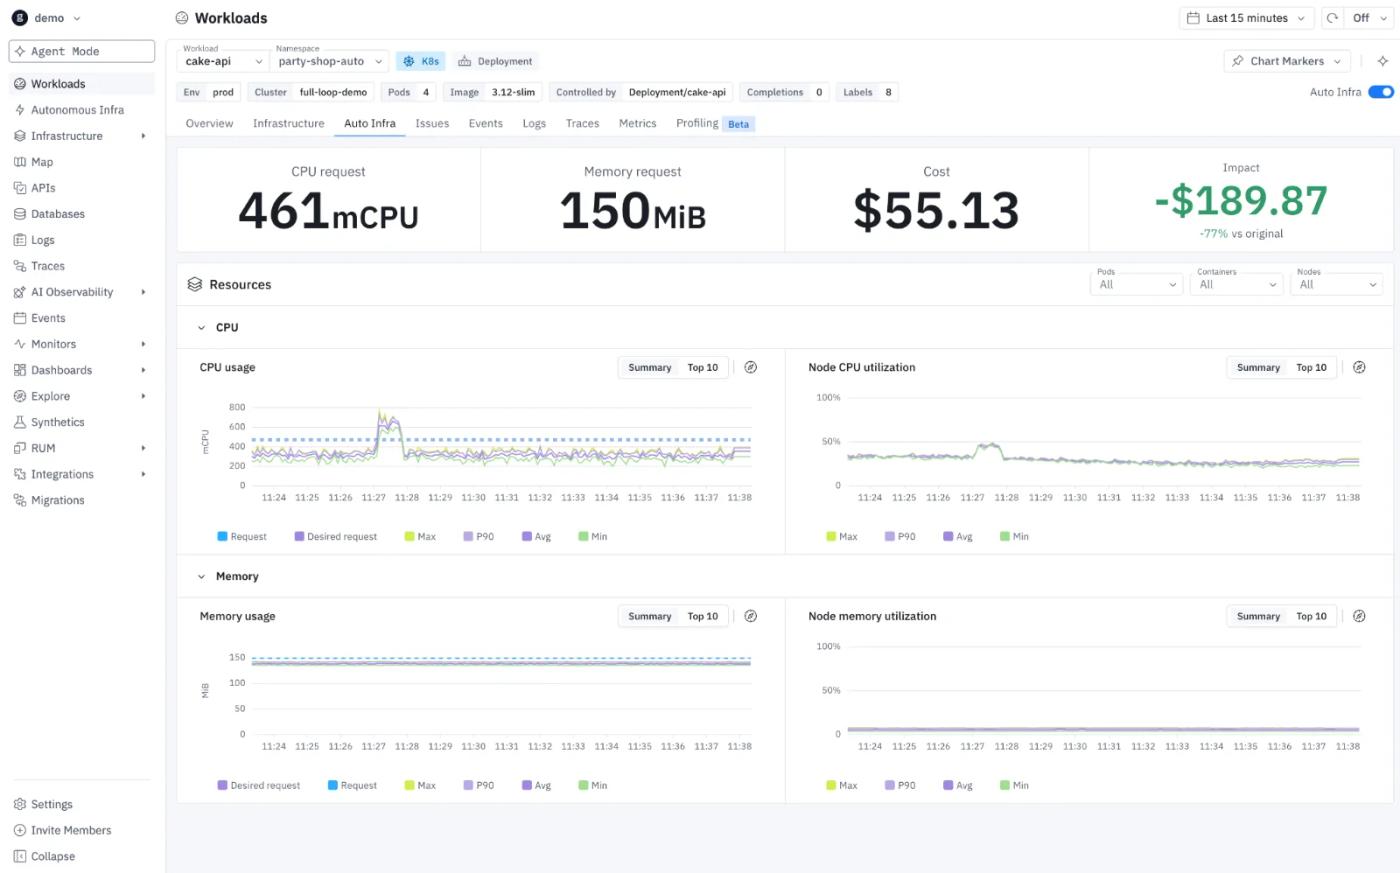
Linux does not report CPU usage as a percentage. For each cgroup, the kernel keeps a cumulative counter of consumed CPU time (usage_usec in the cgroup v2 cpu.stat file). The kubelet’s embedded cAdvisor collects this every 10 seconds and exposes that counter as container_cpu_usage_seconds_total, a monitoring system scrapes it, commonly every 15 seconds, and a query such as rate(container_cpu_usage_seconds_total[1m]) calculates the slope between samples. Every point on the resulting graph is therefore an average rate across an interval, not a measurement of what happened inside it.
Consider a checkout service container that uses 0.5 cores at baseline and runs a 3-second burst at 4 cores. Over one 15-second interval, the counter increases by 18 CPU-seconds, so the calculated rate is 1.2 cores, and a one-minute rate window reports about 0.7 cores. The graph shows a modest increase, while for 3 seconds the service's threads compete for CPU with every other workload on the node. A sizing tool that reads 1.2 cores as peak usage can recommend a request near 1.2 cores. That recommendation appears to reduce cost, and it lowers the service's CPU weight during the seconds when the service needs CPU most. Data that hides bursts turns automated cost reduction into a stability risk.
Why high-resolution, per-container data makes node-level Autonomous Infrastructure possible
The checkout burst matters most in relation to the workloads around it. If the workloads on its node burst at different times, they can share headroom, and their requests can be lowered safely. If they burst at the same time, the node needs headroom for the combined peak. Telling those two cases apart requires per-container data for every workload on the node, at a resolution that preserves short bursts, kept long enough to show whether the overlaps recur.
That is the dataset groundcover's architecture produces, and it is the foundation Autonomous Infrastructure is built on. Autonomous Infrastructure lowers requests where co-located workloads leave room, which produces the cost savings, and raises them where bursts and overlapping peaks need capacity, which assures stability. Once added, PSI will add a direct measurement of whether workloads are waiting, so the effect of each change on contention is visible, not only its effect on averages. Node-level sizing was not practical while the data was too coarse or too expensive to keep, and eBPF and BYOC removed both constraints.
Learn more
Our four-part series on Kubernetes resource management covers the problems this data addresses: noisy neighbors, in-place Pod resize, and scaling fragmentation. To see how Autonomous Infrastructure applies to your clusters, join our community Slack and ask any questions you may have, or try groundcover in our playground.