Utilization shows how busy a node is. PSI shows which workloads are waiting.
CPU or memory usage data does not show whether any workload is delayed because it cannot get CPU, memory or I/O when it needs it, and that delay is what users experience as latency and failed requests. Pressure Stall Information (PSI) measures the delay directly, and as of Kubernetes 1.36 the kubelet exposes it as a stable feature.

Every previous post in this series relied on utilization and request data. That data shows how much of a node's CPU and memory is in use. It does not show whether any workload is delayed because it cannot get CPU, memory or I/O when it needs it, and that delay is what users experience as latency and failed requests. Pressure Stall Information (PSI) measures the delay directly, and as of Kubernetes 1.36 the kubelet exposes it as a stable feature.
This post uses two examples. The first is the checkout service from the previous post, running on a node at 60% average CPU utilization while its p99 latency rises, and it shows contention that average utilization does not reveal. The second is the service from the first two posts that uses 1Gi of memory most of the day and 4Gi at its 9am peak, and it shows the memory stalls that occur before an OOM kill. Using those examples, the post explains why utilization does not measure contention, what PSI is, why it depends on cgroup v2, how Kubernetes exposes it, what Kubernetes does not do with it and how groundcover approaches the signal. PSI matters to this series because it is the measurement that shows whether a cost reduction has reduced stability.
Why utilization does not measure contention
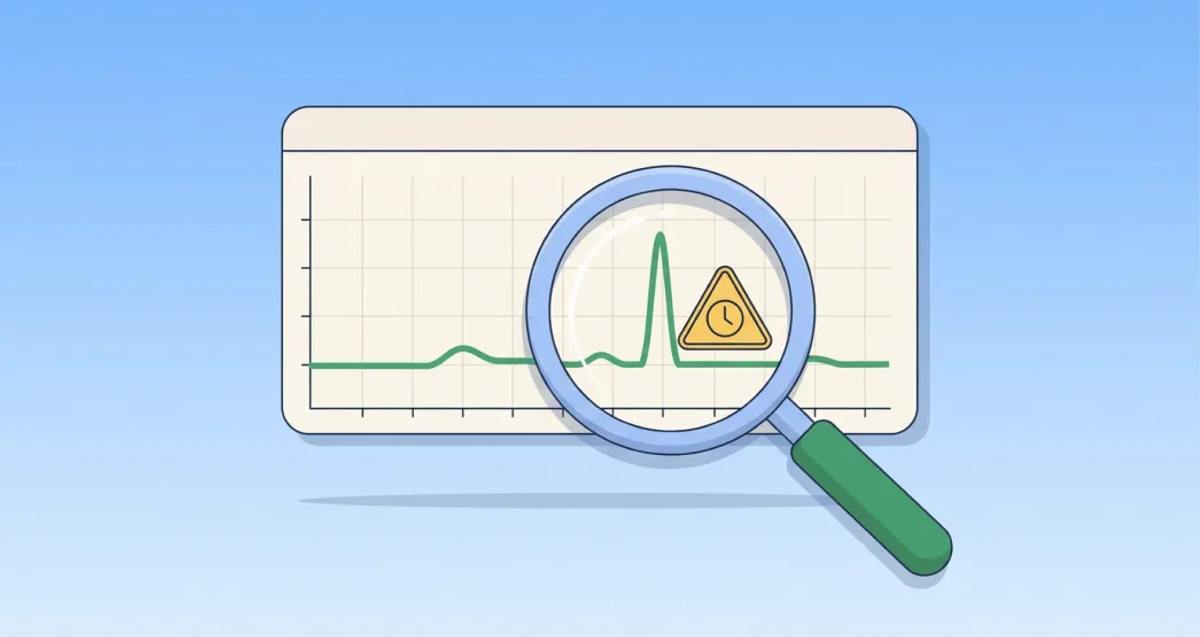
Utilization reports how much of a resource is in use over an interval, not whether any task had to wait for it, and three gaps follow from that definition. First, averages hide bursts. The checkout service's node reports 60% average CPU utilization over a minute, but that minute can include several seconds at 100%, during which the service's runnable threads wait in the CPU run queue and requests take longer to complete.
Second, a busy resource is not necessarily a contended one. A batch job at 100% CPU with no other task waiting is using the node efficiently, while a latency-sensitive service at 50% whose threads wait for CPU time is degraded. Third, memory utilization shows how much memory is in use, not what it cost to obtain it. Before the kernel OOM-kills a process, it tries to reclaim memory, for example by evicting page cache, and tasks stall while reclaim runs. A metric that measures waiting directly closes all three gaps, and that metric is PSI.
What PSI is
PSI is a Linux kernel feature, available since kernel 4.20 in 2018, that measures the share of time tasks are stalled waiting for CPU, memory or I/O. It reports two measures for each resource:
- some: the share of time at least one task was stalled on the resource.
- full: the share of time all non-idle tasks were stalled on the resource at once, so no productive work happened.
Each measure is reported as moving averages over 10, 60 and 300 seconds (avg10, avg60 and avg300), which separate short spikes from sustained pressure, and as a cumulative total of stall time in microseconds.
At the 9am peak, the memory.pressure file for the 1Gi/4Gi service's container might read as follows:
These values mean that over the last 10 seconds, at least one of the container's tasks was stalled waiting for memory 18.42% of the time, and all of its tasks were stalled at once 6.03% of the time. The 300-second averages are much lower, which shows that the pressure started recently. Utilization would show only that the container is using close to 4Gi, while PSI shows that the container is already losing time to memory reclaim before any OOM kill occurs. Reading these values for each container separately depends on cgroup v2.
Why PSI depends on cgroup v2
cgroup v2 organizes all resource controllers in a single unified hierarchy and exposes three pressure files in each cgroup: cpu.pressure, memory.pressure and io.pressure. Because each Pod and container has its own cgroup, the kernel reports PSI separately for each one, which is what makes per-Pod and per-container pressure available. cgroup v1 does not provide these files. Kubernetes 1.35 disabled cgroup v1 by default, so the kubelet no longer starts on a cgroup v1 node unless failCgroupV1 is explicitly set to false. PSI is therefore available on most current nodes, with exceptions such as AWS Fargate, which still uses cgroup v1. On nodes that meet the requirements, the kubelet now reads these files and exposes them through the Kubernetes API.
How Kubernetes exposes PSI
Kubernetes added PSI to the kubelet through KEP-4205. The feature was introduced as alpha in 1.33, graduated to beta in 1.34 and reached GA in 1.36, where the KubeletPSI feature gate is locked on. The kubelet reports CPU, memory and I/O pressure at the node, Pod and container levels through two interfaces: the Summary API and the /metrics/cadvisor Prometheus endpoint. Nodes must run Linux kernel 4.20 or later, use cgroup v2 and have PSI enabled in the kernel, which means CONFIG_PSI=y and no psi=0 boot parameter. PSI is not available on Windows nodes.
In 1.36, the kubelet also checks whether the operating system supports PSI before reporting it. Earlier versions emitted zero values on nodes without PSI support, which monitoring systems could misread as an absence of pressure. The following query, from the Kubernetes GA announcement, returns one container's PSI from the Summary API:
With this query, the checkout service's CPU pressure becomes visible during the seconds when its node's average utilization shows nothing unusual. The signal is now available at every level of the cluster, but Kubernetes itself does not act on it.
What Kubernetes does not do with PSI
KEP-4205 states that the kubelet's PSI metrics are for monitoring and are not used by Kubernetes itself to make workload lifecycle decisions. The scheduler places Pods by requests, as the first post in this series described. HPA scales on utilization relative to requests, as the previous post described. The kubelet evicts Pods based on resource thresholds such as memory.available, not on how long tasks have stalled. Kubernetes now measures contention directly, and it leaves acting on that measurement to other tools.
What PSI does not show by itself
PSI identifies which workload is stalled, but not which workload caused the stall. When the checkout service's CPU pressure rises, the cause can be a co-located workload that exceeded its request, a batch job that started on the same node, or a traffic increase that exceeds what the service's request entitles it to under contention. Distinguishing among these causes requires the usage of every other workload on the same node over the same interval.
Interpreting PSI also requires choosing the right measure and keeping enough history. some is the appropriate signal for latency-sensitive services, because even one stalled task can delay a request, while full indicates lost throughput. Acting on PSI requires per-container time series retained long enough to separate short spikes from sustained pressure, and linked to deployments, resize events and co-located workloads. Without that context, PSI is an alert without an explanation.
How groundcover approaches it
groundcover's sensor supplies the context that PSI lacks on its own. The sensor runs as a DaemonSet on every node and uses eBPF to collect data directly from the Linux kernel, so resource usage, process and network data is captured automatically, without application code changes, SDKs or exporters. Because the data for every container on a node comes from the same kernel-level source, at high resolution, it can be correlated by node, workload and time. PSI is not part of that data today, and collecting it for every container from its cgroup pressure files is on groundcover's roadmap. Once it is collected, each container's stall time will sit in the same dataset as its own usage and the usage of its neighbors. That correlation is what connects one workload's stall to the co-located workloads that caused it.
Autonomous Infrastructure is built to act where Kubernetes does not. It uses node-level usage data to lower requests where the peaks of co-located workloads leave room, which produces the cost savings, and to raise requests where workloads need more capacity, which assures stability. Autonomous Infrastructure does not use PSI today, and adding it is on the roadmap. A contention signal like PSI is what would verify each change: if contention stays flat after a request reduction, the saving did not reduce stability, and if contention rises, the request needs to increase. Using per-contianer PSI, collected by the eBPF sensor, as that contention signal is on our roadmap. The groundcover investigator can use the same data during an incident to test a noisy-neighbor hypothesis, citing which workloads overlapped on which node and at what time. With BYOC, that high-resolution history stays in the customer's own cloud account, where retaining all of it is affordable.
Four posts, one goal: cost savings with assured stability
This series started with a node at 40% CPU utilization on which checkout latency still doubled, and each post added one part of the explanation. Requests, not limits, determine how contention is resolved. In-place resize makes those requests adjustable on running Pods. The vertical, horizontal and cluster scaling layers need one shared view of the cluster, and PSI measures whether workloads are actually stalled. Autonomous Infrastructure brings these parts into one system, built on kernel-level data that groundcover collects with eBPF, so that platform teams can reduce cost while assuring stability, with evidence for both.