Unlock Deeper Observability with groundcover's New External Telemetry Enrichment OpenTelemetry Data Enrichment
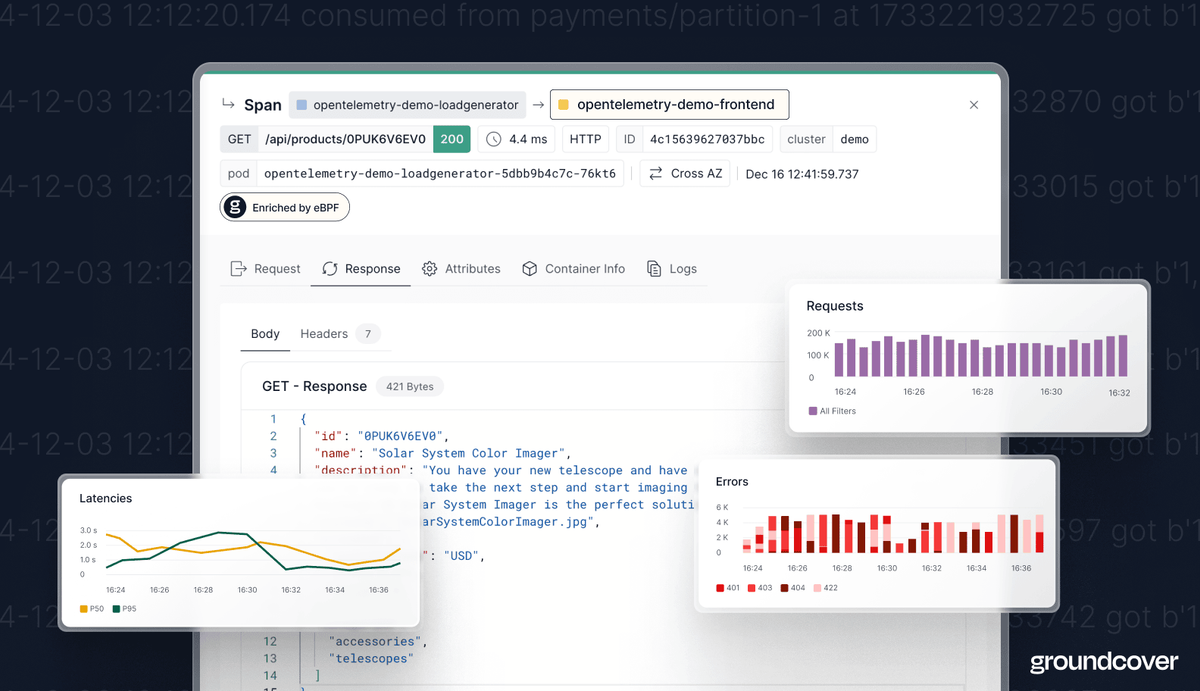
Tl;dr - groundcover just released the first in market OpenTelemetry data enrichment powered by our eBPF sensor, automatically displaying Payloads and Headers of HTTP requests and responses, query parameters, and enriched attributes, including cross-AZ indicators and PII status.

Last Updated on: July 26, 2026
At groundcover, we are always looking for ways to enhance the observability experience for DevOps and platform teams. Today, we're excited to announce a major milestone: external telemetry enrichment, an OpenTelemetry data enrichment system powered by eBPF that enhances raw telemetry data with relevant context—telemetry being the operational data automatically collected from systems, applications, devices, or networks. It automatically captures full payloads, HTTP headers, query parameters, and enriched attributes such as cross-AZ indicators and PII status, giving teams deeper visibility into performance, user behavior, and error detection across modern cloud-native architectures while improving data quality by filling missing fields and updating stale context.
OpenTelemetry + eBPF: The Perfect Combination
OpenTelemetry is one of the most popular open-source projects for distributed tracing, allowing organizations to generate, process, and collect traces across complex, distributed systems in a standardized way. However, OpenTelemetry on its own is limited to the application-level spans and metadata that are manually instrumented by engineers. OpenTelemetry commonly uses resource detection processors to automatically identify resource attributes, which can include the pod name, namespace, and deployment name. It cannot capture critical details such as full payloads, HTTP headers, or low-level network and kernel interactions.
That's where groundcover's eBPF sensor redefines observability. Kubernetes metadata enrichment also enhances telemetry with pod information for stronger infrastructure context. By operating directly at the kernel level, our sensor automatically collects the granular data that OpenTelemetry cannot—full payloads, headers of HTTP requests and responses, query parameters, and enriched attributes like cross-AZ indicators and PII data identification. Our users gain unparalleled visibility into their cloud-based architectures through our eBPF sensor, providing them with deep insights straight from the Linux kernel. This next-level visibility gives teams unprecedented insight into their cloud-native architectures, closing the gaps left by traditional OpenTelemetry implementations and eliminating the complexity of manual instrumentation.
Why This Integration Matters: Key Use Cases
By combining the power of OpenTelemetry's distributed tracing with the unparalleled observability provided by groundcover's eBPF sensor, we deliver a comprehensive solution that eliminates blind spots and provides teams with complete, real-time visibility into their applications and infrastructure, improving operational efficiency in monitoring.
With this new data enrichment, engineers no longer need to toggle between separate tools and dashboards to piece together the full picture. Here's how groundcover makes this seamless:
- Distributed Tracing with OpenTelemetry: Map the flow and hierarchy of requests across your system, understanding which services are communicating and how they perform.
- Deep Context from eBPF: Go beyond basic trace data. Our eBPF sensor automatically enriches traces with critical context—such as the user ID associated with a request, the device they used, full HTTP payloads, headers and error messages.. This richer additional context improves anomaly detection and filtering, and by adding contextual metadata to raw application logs, it speeds troubleshooting and reduces mean time to resolution. It can also connect technical events to business context, like a customer or service, for better analysis. This level of detail has historically required multiple tools or extensive custom instrumentation. Now, it's effortlessly available through groundcover's intuitive UI.
What This Means for You: How to Enrich Logs
With groundcover's OpenTelemetry + eBPF enrichment, your engineering teams can now:
- Capture critical data unavailable in traditional OpenTelemetry setups: Automatically collect full payloads, HTTP headers, query parameters, and enriched metadata like user IDs and PII status without manual instrumentation.
- Achieve deeper observability with minimal effort: Seamlessly integrate kernel-level insights from eBPF with distributed tracing, eliminating blind spots and reducing operational complexity.
- Streamline your troubleshooting workflow: Access comprehensive trace data and granular context in one intuitive platform, without toggling between tools or relying on custom agents. Filtering can remove unnecessary logs based on criteria before they create noise, which reduces alert fatigue by excluding irrelevant events.
Standardize observability across your stack: Leverage the best of open standards (OpenTelemetry) with advanced data enrichment, providing unparalleled visibility from infrastructure to application layers; the transform processor can modify log attributes based on conditions to add clearer context, and metrics can use exemplars to correlate with trace data.
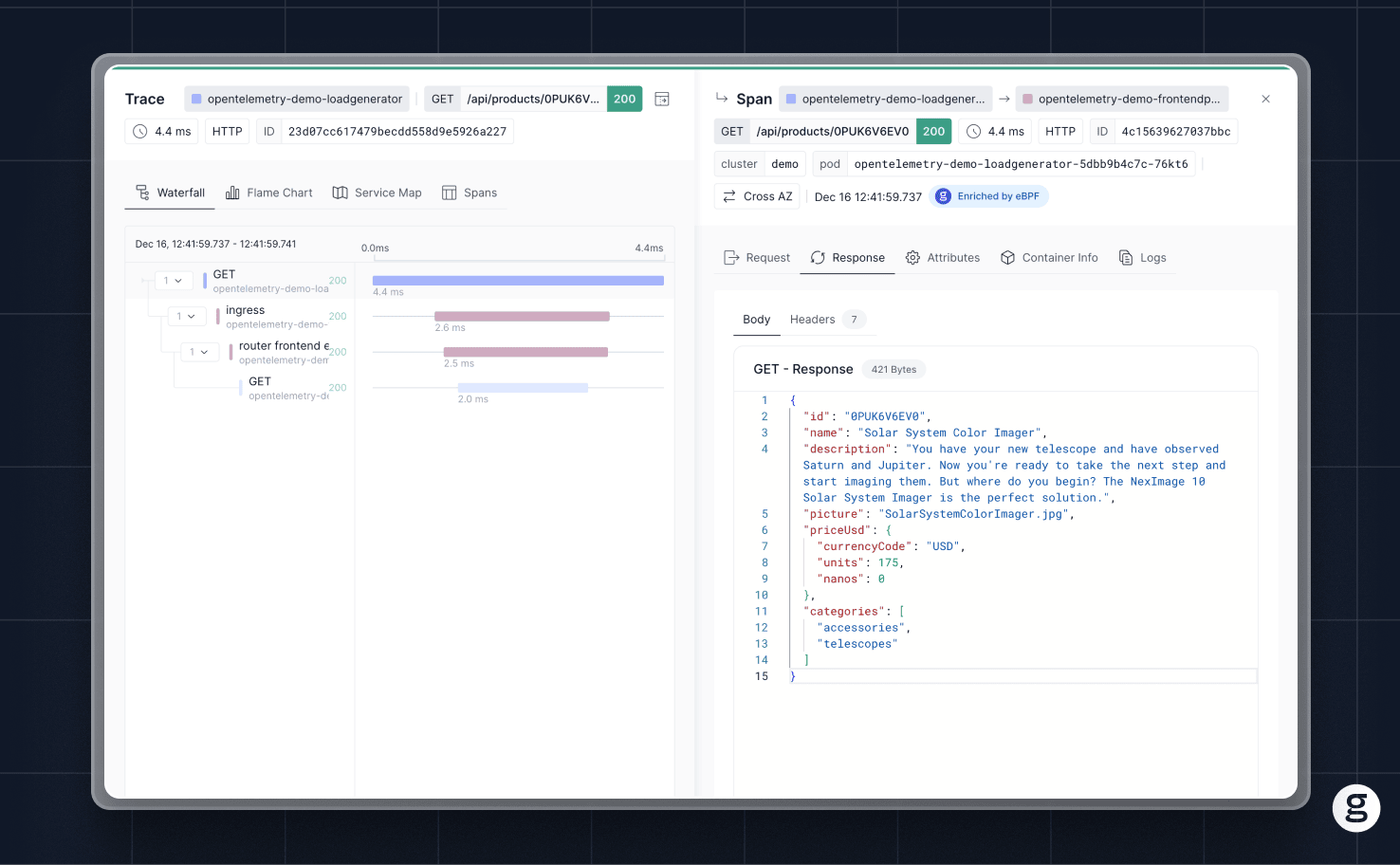
This screenshot shows an OpenTelemetry trace enriched with eBPF-powered data. One of the spans has been enhanced to display the full HTTP response, along with additional metadata enrichments, providing deeper insights and context.
A Seamless, Powerful Observability Experience with Kubernetes Metadata
We believe this enrichment is a game-changer for teams building modern cloud-native applications. It combines the power of OpenTelemetry's distributed tracing with the depth of eBPF-driven observability, all in a seamless, unified experience. With the opentelemetry collector, the k8sattributes processor can automatically enrich logs with kubernetes metadata. That metadata can include pod names, container names, and namespaces, and it helps link infrastructure metrics to logs, while Prometheus adds the same context as kubernetes labels to kubernetes metrics automatically. Contextual information may also include geographic data, threat intelligence, or other infrastructure metadata, and dynamic contextualization keeps that context updated in real time without manual intervention. Engineers can now access the best of both worlds—instant, uber granular observability with deep, trace-level insights—in a single, easy-to-use interface.
Stay tuned for more updates as we continue to innovate and make observability even more powerful, intuitive, and accessible for teams to confidently monitor applications, detect issues faster, reduce data ingestion and storage cost by filtering low-value data before storage, and turn raw logs into enriched data that supports security operations with more actionable intelligence and improved threat detection.