Cluster Autoscaler Not Scaling Down: Insights & Best Practices

The cluster autoscaler's scale-down logic is notoriously finicky, and when it decides not to remove nodes, it's like a slippery eel. Just when you think you've pinned it down, it slides away.
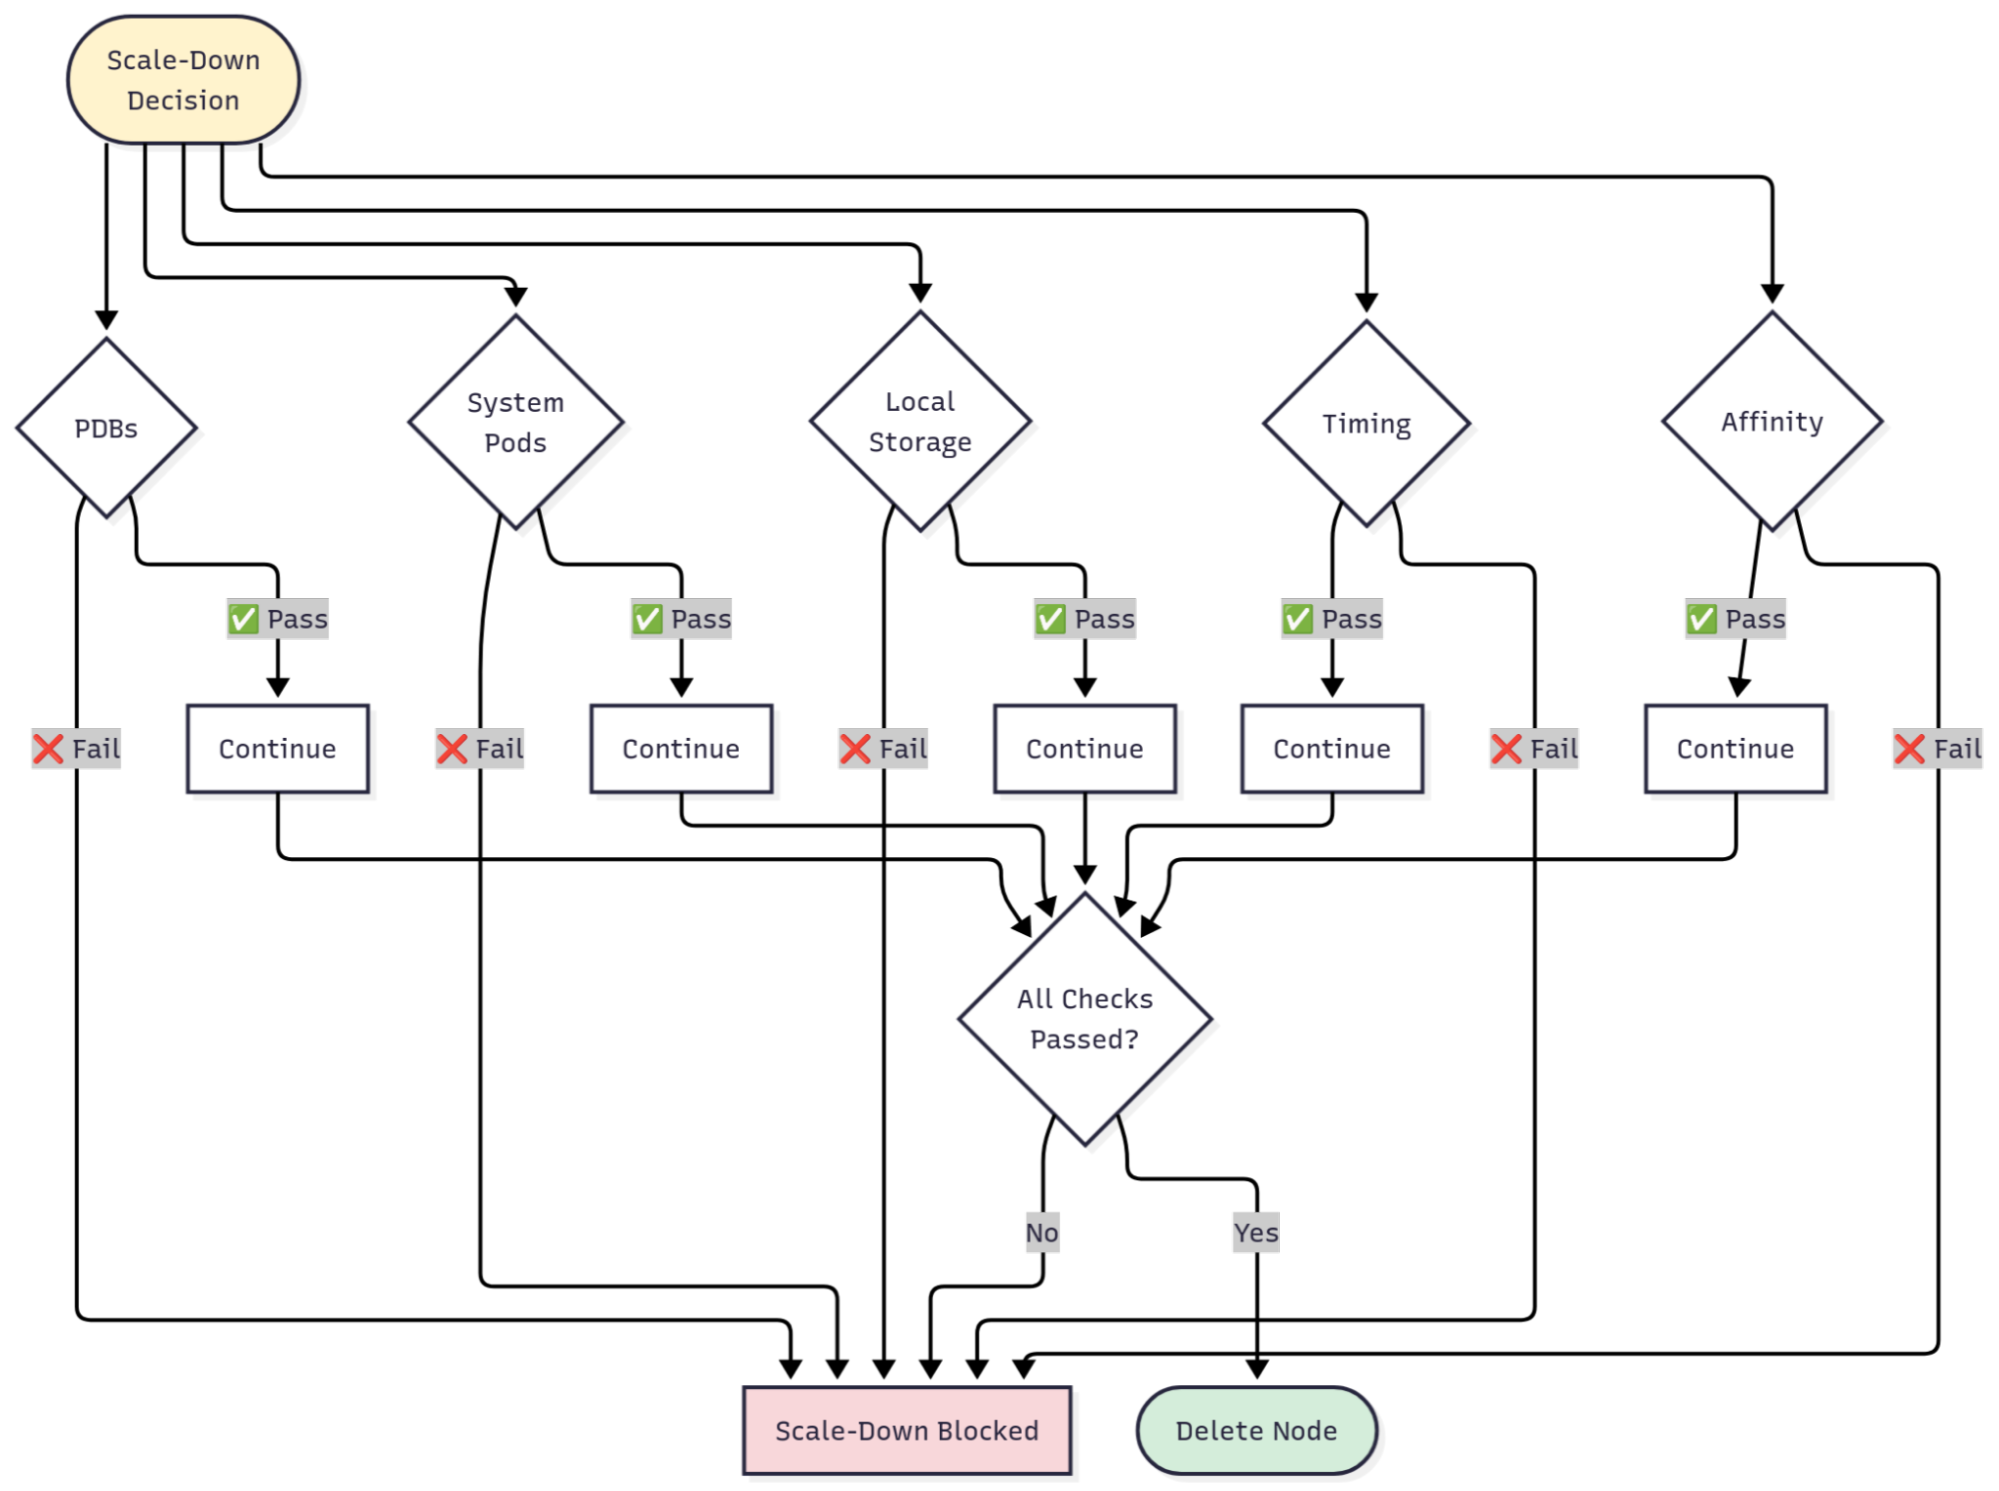
The autoscaler evaluates multiple pod- and node-level conditions before deciding whether a node can safely be removed. A single misconfigured PodDisruptionBudget, non-evictable system pod, or pod using local storage can keep a node running far longer than expected.
This article breaks down exactly why your cluster autoscaler is not scaling down, how to troubleshoot it systematically, and what you can do to ensure efficient scale-down behavior without disrupting workloads. Regardless of where you're dealing with stubborn nodes (AWS EKS, GCP GKE, or Azure AKS), we'll walk through the common culprits and give you the commands, configurations, and best practices to fix them.
Understanding the Cluster Autoscaler
Before we dive into why things break, let's quickly establish how the autoscaler actually works. The cluster autoscaler adjusts cluster size by adding nodes when pods can't schedule and removing underutilized nodes to save costs. Simple enough, right?
Well, not exactly. The autoscaler treats scale-up and scale-down very differently. Scale-up is low risk and fast; scale-down is high risk and cautious. Here's why:
Common Reasons Why the Cluster Autoscaler is Not Scaling Down
When your cluster autoscaler refuses to scale down nodes, it's usually one of these culprits, or a combination of them. We've ordered them by how often we see them in the wild, so start at the top and work your way down.

But here's something critical to understand first. The autoscaler bases its scale-down decisions on CPU and memory requests, not real-time usage metrics from the metrics server. A node running pods that request 80% of resources but only use 20% will NOT scale down, no matter how idle it appears in your monitoring dashboards. Keep this in mind as you troubleshoot.
1. PodDisruptionBudgets (PDBs) Blocking Eviction
This is the number one reason nodes don't scale down. PodDisruptionBudgets protect availability during voluntary disruptions, but conservative settings block scale-down. The most common mistake is setting maxUnavailable: 0, which prevents the autoscaler from evicting any pods.
How to Detect This Issue
Run this command to see all your PDBs:
Look for PDBs with maxUnavailable: 0, minAvailable equal to total replicas, or ALLOWED DISRUPTIONS: 0. Any of these will block scale-down.
How to Fix It
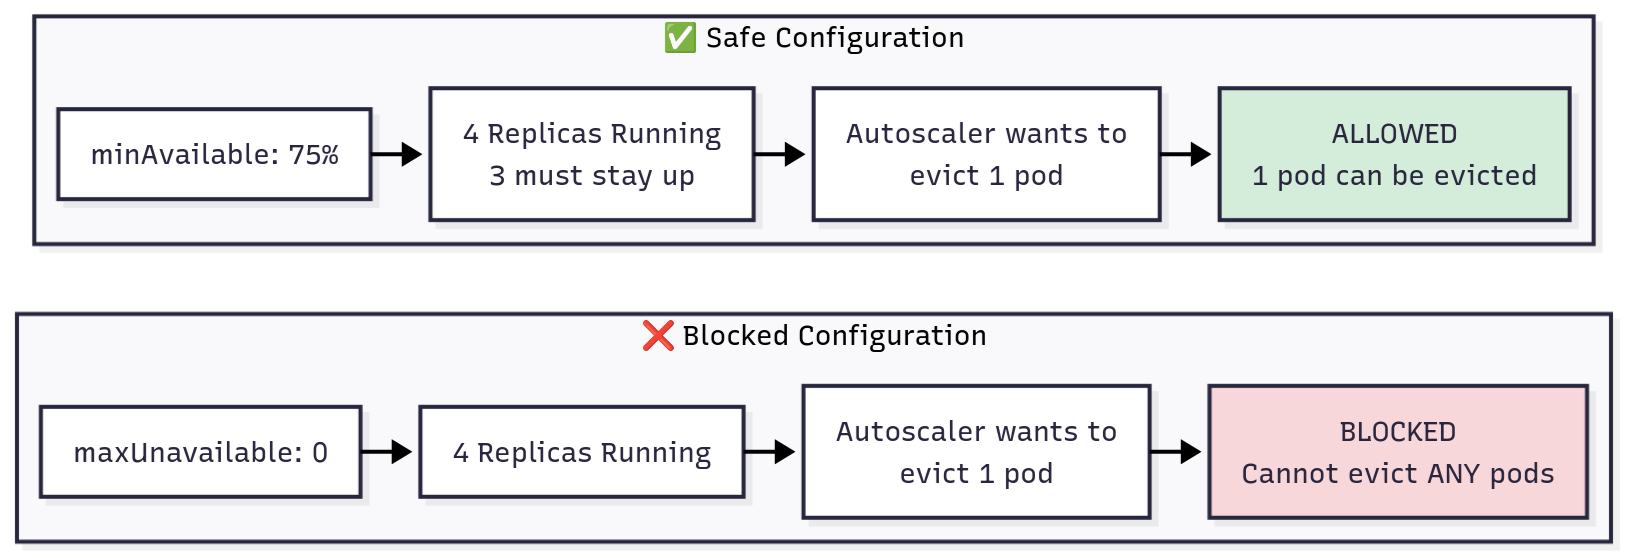
Here's what a problematic configuration looks like:
DON'T DO THIS: Blocks all scale-down
Instead, use percentage-based PDBs that allow controlled disruptions:
DO THIS: Allows controlled scale-down
With this configuration, your PDB scales naturally with your deployment. Four replicas? Three must stay up, one can be evicted. Eight replicas? Six must stay up, two can be evicted. The autoscaler can drain nodes as long as your pod distribution allows it.
2. System Pods Without Proper Configuration
Many system-level pods, such as kube-proxy, `node-exporter`, and CNI plugins, run as DaemonSets. However, not all system pods follow this pattern (e.g., CoreDNS). By default, the Cluster Autoscaler does not remove nodes that run pods which it can’t safely evict—this often includes DaemonSet or system pods unless you explicitly tell it otherwise.
This makes sense at first glance, but here's the thing: most system pods can be safely rescheduled to other nodes. They're designed for it. The autoscaler just doesn't know that unless you tell it.
Important nuance:
The autoscaler ignores DaemonSet pods when calculating node utilization, but it still needs to evict them before removing a node. Without the proper annotation or flag, these pods can silently block scale-down.
How to Detect This Issue
First, see what's running on your stuck node:
If the annotation is missing or set to false, that's your blocker.
How to Fix It
You have two options here. First, you can update your cluster autoscaler deployment to allow system pod eviction globally:
Also, you could be more selective and annotate specific DaemonSets as safe to evict(recommended for fine-grained control):
Both approaches work. The first is simpler if most of your system pods can be rescheduled. The second gives you finer control if you have some truly critical DaemonSets that shouldn't move.
3. Pods with Local Storage
Pods using `emptyDir` or `hostPath` volumes pose a unique problem. If you drain the node, the data stored in those volumes is lost forever. It's not backed up, it's not replicated, it's just gone. So by default, the autoscaler refuses to evict these pods unless you explicitly allow it.
This is a safety feature, but it also means temporary data like caches can prevent scale-down. You need to decide whether the data is truly important or just temporary scratch space.
Check for pods with local storage (Requires jq to be installed):
If the data is temporary (caches, temp files, build artifacts), you can safely allow local storage eviction by setting --skip-nodes-with-local-storage=false in your autoscaler deployment.
⚠️ Caution: Only enable this if you’re sure the data isn’t important. For stateful workloads that need their data to survive, use `PersistentVolumes` instead of `emptyDir`.
Also note that some managed providers (like GKE or AKS) may treat local-storage pods differently depending on version or configuration. Always check your provider’s autoscaler documentation before changing this flag.
4. Node Affinity and Scheduling Constraints
Complex scheduling constraints can prevent pods from being rescheduled elsewhere. If nodeSelector or nodeAffinity rules match only the current node, or podAntiAffinity prevents co-location, scale-down fails.
Check pod scheduling constraints like this:
The fix is usually to use preferredDuringScheduling instead of requiredDuringScheduling when possible. This gives the scheduler flexibility while still expressing your preferences. The pod will try to honor your constraints but won't be completely stuck if they can't be met.
5. Recent Scale-Up Events and Timing Delays
The autoscaler delays scale-down after scale-up events (default 10 minutes) to prevent thrashing. If you just scaled up, nodes won't immediately scale down even if underutilized. When multiple issues combine, fix all blockers before scale-down succeeds - the autoscaler won't partially drain nodes.
Troubleshooting Scale-Down Issues
When scale-down isn't working, don't just randomly check settings and hope something sticks. Here's a systematic approach that will get you to the root cause faster.
Step 1: Verify Autoscaler Health and Identify Stuck Nodes
Verify the autoscaler is running and healthy before investigating the configuration:
Look for authentication failures, cloud API errors, or rate limiting. If the autoscaler isn't running properly, nothing else matters. Fix that first.
Once you know the autoscaler is healthy, identify which nodes should be scaling down but aren't:
The autoscaler logs will explicitly say which nodes it considers underutilized. Make note of those node names.
Step 2: Determine What's Blocking Scale-Down
Now that you know which nodes are stuck, check for common blockers:
The autoscaler logs will often tell you exactly what's blocking. Look for messages like this:
You'll see specific reasons: "node has non-daemonset pods", "pod prevents scale down", "node has local storage pods". These messages point directly to the fix you need.
Step 3: Review Autoscaler Configuration
If you've ruled out pod-level blockers, the issue might be in the autoscaler configuration itself. Check your deployment:
Verify these critical flags are set correctly:
If skip-nodes-with-system-pods is set to true, that's almost certainly your issue. Change it to false unless you have a specific reason not to.
Reading Autoscaler Logs
Good signs (scale-down working):
Warning signs (blockers present):
Filter logs for your specific node to see its history:
Best Practices and Advanced Configuration
Once you've fixed immediate issues, these practices will help prevent problems from recurring and optimize your scale-down behavior.
Design and Configuration Practices
- Set realistic PDBs that allow at least some disruptions. Use minAvailable: N-1 or percentage-based values like 75%, never maxUnavailable: 0. This allows controlled evictions during scale-down while still protecting your availability.
- Configure system pods correctly by setting skip-nodes-with-system-pods=false in your autoscaler deployment, or annotate specific DaemonSets as safe to evict. Most system pods can be safely rescheduled to other nodes.
- Set accurate resource requests on your pods. Remember, the autoscaler makes decisions based on requests, not actual usage. Inflated requests waste money because nodes look full when they're not. Too-low requests cause instability because pods might not get the resources they actually need.
Tuning Scale-Down Parameters
If you need tighter cost control or have specific requirements, you can tune the autoscaler's behavior. Here's how conservative and aggressive configurations compare:
Start conservative, measure actual traffic patterns for two weeks, then adjust incrementally based on what you observe. Never change multiple parameters at once, else you won't know which change caused issues if something breaks.
Cloud Provider-Specific Configurations
Cloud providers have unique requirements: AWS requires correct ASG tags (k8s.io/cluster-autoscaler/<cluster-name>: owned), GCP needs proper IAM permissions, and Azure requires automatic upgrade policies. Check provider documentation if scale-down fails after verifying pod-level configurations.
Monitoring Autoscaler Behavior with groundcover
Troubleshooting autoscaler issues manually is tedious. You’re parsing logs, checking resources across namespaces, and correlating events across time windows. There's a better way.
groundcover provides real-time autoscaler observability that highlights which pods or PDBs are blocking scale-down and correlates them with resource usage impact, without needing manual log checks.
Unlike agent-based monitoring that adds node overhead, groundcover’s eBPF-based data collection captures relevant Kubernetes telemetry with near-zero performance impact. You get complete visibility into autoscaler decisions, node utilization, and pod eviction attempts, all without adding overhead to your already-constrained cluster. That kind of visibility turns troubleshooting from an art into a science. You're not guessing what might be wrong based on incomplete log snippets. You're seeing the full picture in real-time.
Conclusion
The cluster autoscaler's scale-down logic is deliberately conservative. When nodes refuse to scale down despite low utilization, you're paying for capacity you don't need.
Fix the most common culprits systematically. Check PDBs first, verify autoscaler flags, then work through node-specific blockers using logs and kubectl commands. Balance cost savings with stability by starting with defaults, monitoring behavior, then tuning incrementally.
With the right configuration, systematic troubleshooting, and proper observability, your cluster autoscaler can save costs without compromising reliability. The nodes will scale down when they should, and your cloud bill will reflect actual usage, not misconfiguration.
FAQs
Which configuration flags most often block scale-down, and how should I tune them?
- The two most common blockers are --skip-nodes-with-system-pods=true and --skip-nodes-with-local-storage=true.
- For most clusters, setting these to false allows the autoscaler to safely drain more nodes — but do this only after verifying:
- System pods are replicated and can reschedule automatically (e.g., CoreDNS, kube-proxy).
- Local storage data is non-critical and can be lost on eviction.
Always test changes in a staging environment before applying them to production clusters.
How do PDBs and non-evictable pods stop nodes from scaling down safely?
PodDisruptionBudgets define how many pods can be unavailable during voluntary disruptions like node draining. If a PDB sets maxUnavailable: 0, Kubernetes cannot evict any pods from that deployment. Since scale-down requires draining all pods from a node, one PDB with zero disruptions allowed blocks the entire node from scaling down. Check your PDBs with kubectl get pdb --all-namespaces and adjust to allow at least one unavailable pod.
How can groundcover pinpoint the exact pods, policies, or metrics preventing scale-down?
- groundcover provides real-time visibility into autoscaler decisions without requiring manual log parsing.
- It shows you which specific pods are blocking scale-down, which PDBs are preventing eviction, and correlates these blockers with cost impact over time.
- Using eBPF, groundcover collects this data without adding agent overhead to your nodes, giving you instant answers instead of spending 30 minutes troubleshooting with kubectl commands.
How long does it take for nodes to scale down after becoming unneeded?
By default, nodes must be underutilized for 10 minutes (scale-down-unneeded-time) before the autoscaler attempts removal. Additional delays apply: 10 minutes after adding a node (scale-down-delay-after-add) and 3 minutes after a failed scale-down attempt (scale-down-delay-after-failure). Total time from "unneeded" to "deleted" is typically 10-20 minutes, not instant. These delays are intentional to prevent thrashing.
Why do my nodes show as "unneeded" in logs but never actually delete?
There's a gap between marking a node unneeded and successfully deleting it.
- The autoscaler might identify an underutilized node but fail to drain it due to PodDisruptionBudgets blocking eviction, pods without controllers that can't be rescheduled, or pods exceeding graceful termination timeouts.
- Check logs for drain failures with kubectl logs -n kube-system deployment/cluster-autoscaler | grep "scale down failed" to identify the specific cause.


.svg)