Datadog AI Observability: Features, Limits, and When to Consider Alternatives



Imagine you’re an engineer tasked with understanding and optimizing the performance of your organization’s AI systems. You already use Datadog for conventional observability needs, so you turn to Datadog AI observability to cover AI infrastructure and tools as well.
This approach may work well enough in the short term. But eventually, you realize that Datadog’s AI monitoring capabilities are limited in areas like eBPF sensor coverage, complex pricing, and the ability to keep sensitive telemetry data private – and you join the many organizations that seek out alternatives to Datadog.
Below, we take a close look at how Datadog’s AI monitoring capabilities work, how to set them up, what they can and can’t do, and why they’re not always enough to meet the AI observability requirements of modern teams.
What is Datadog AI observability?
Datadog AI observability is a set of capabilities within the Datadog platform designed to help observe and troubleshoot AI applications. It works alongside Datadog’s classic application performance management (APM) features.
Datadog AI observability is designed to provide insight into all layers and facets of AI-based applications. It supports end-to-end tracing of prompts and agentic workflows (like those that use the Model Context Protocol, or MCP). It can also evaluate LLM responses for accuracy and quality, as well as trace token costs.
How Datadog AI observability works
Here’s a more detailed look at how Datadog’s AI observability capabilities work.
LLM call tracing and span collection
Datadog represents LLM activity as traces and spans, with each span corresponding to an operation such as an individual model inference. The spans can capture information including latency, errors, model and provider details, token usage, and inputs and outputs, giving teams a way to inspect individual calls as well as the broader request.
For more complex applications, multiple spans can be nested into workflow or AI agent traces so engineers can follow an LLM request across its complete execution path.
Token usage and cost tracking per request
By tracking token counts on LLM spans and using them to calculate estimated costs based on a model provider's public pricing, Datadog helps teams manage LLM spending. The feature works at both the individual LLM-call level and across an entire trace.
It’s also possible to supply custom pricing data for unsupported or self-hosted AI models, while token and cost metrics can be used in dashboards and monitors to track spending over time.
Prompt and response capture
Datadog can capture the inputs and outputs associated with LLM calls, allowing engineers to examine what prompted a response and what the model generated when investigating an issue. Prompt Tracking additionally connects prompt templates and versions to LLM calls, making it possible to compare versions by call volume, latency, token consumption and cost, and then jump directly from a prompt version to the traces that used it.
Hallucination and quality evaluation
LLM evaluations within the Datadog platform can assess LLM output quality and safety, including managed evaluations and custom LLM-as-a-judge evaluations for criteria such as factuality, helpfulness, and relevance. Evaluations can be attached to individual spans or performed at the trace level when judging an entire workflow, while human feedback and external evaluation results can also be incorporated into Agent Observability.
Agent workflow tracing across multi-step pipelines
For agentic applications, Datadog builds traces that represent the broader execution of an agent, with nested spans for LLM calls, tools, retrieval, embeddings, tasks, and workflows. This lets engineers follow how an agent moved through multiple steps and identify where latency, errors, or unexpected behavior entered the workflow. Trace-level evaluations can also assess outcomes that depend on the interaction between several steps, such as whether an agent selected tools in the correct sequence or how multiple agents interact to achieve an outcome.
Key features of Datadog AI observability
Datadog’s key features for observing LLMs and AI applications include:
- End-to-end LLM tracing: Datadog represents individual LLM calls, workflows and agent executions as traces and spans, allowing teams to follow requests across model calls, tools and other workflow steps.
- Performance and cost monitoring: Teams can track request volume, latency, errors, token consumption and model usage to identify performance bottlenecks and manage LLM spending.
- Prompt and response visibility: Datadog captures inputs, outputs and related metadata, helping engineers investigate unexpected responses and understand how changes to prompts affect application behavior.
- Quality and safety evaluation: Built-in and custom evaluations can assess response quality while safety capabilities help identify issues such as prompt injection and sensitive data exposure.
- Agent and workflow monitoring: Datadog traces multi-step agent workflows, including tool calls and individual execution steps, helping teams diagnose failures and understand complex agent behavior.
- APM and OpenTelemetry integration: Agent Observability can correlate with Datadog APM and ingest OpenTelemetry GenAI traces, allowing LLM telemetry to be analyzed alongside broader application and infrastructure signals.
Setting up Datadog AI observability
Implementing Datadog’s observability capabilities for AI involves the following basic steps (assuming you already have access to the Datadog platform).
#1. Instrumenting LLM applications with the Datadog SDK
The process starts by adding Datadog’s Agent Observability SDK to the application and configuring the Datadog API key, site, and ML application name. Datadog supports SDK-based instrumentation for Python, Node.js and Java, with automatic instrumentation available for supported LLM frameworks and providers so teams can capture calls without manually creating spans for every operation. The SDK can collect prompts and completions, token usage, latency, errors, and model metadata.
Manual instrumentation can be added for custom AI stacks or unsupported libraries.
#2. Connecting to OpenAI, Anthropic and other LLM providers
Next, connect each LLM provider through Datadog's supported integrations and SDK instrumentation so model activity can be associated with application traces and provider-specific telemetry.
Datadog supports automatic tracing for providers including OpenAI and Anthropic, capturing information such as inputs and outputs, latency, errors, and token usage. Unsupported providers can be monitored through manual SDK instrumentation, the Agent Observability HTTP API or OpenTelemetry GenAI spans.
#3. Configuring dashboards and monitors for AI workloads
Once telemetry is flowing, use Datadog's built-in dashboards and monitoring capabilities to track metrics such as request volume, latency, errors and token consumption across models, applications and endpoints. Teams can build dashboards around the operational and cost signals that matter most, then create monitors to detect abnormal latency, error rates or usage patterns; Agent Observability can also be correlated with Datadog APM to connect LLM-specific problems with broader application performance issues.
Where Datadog AI observability tends to fall short in practice
Datadog is a useful observability platform, including for organizations that need to manage AI applications. However, it’s subject to certain limitations and potential pitfalls:
- Complex instrumentation: The instrumentation process can be complicated, especially if you need to monitor unsupported model providers or support local LLMs.
- No data isolation: No matter how you configure Datadog, it will send your telemetry data to Datadog’s servers. This can present a challenge when monitoring AI systems that produce sensitive data; for example, compliance issues may arise if you send prompt output that contains PII to Datadog and you are subject to rules that require you to keep such data on-prem or to manage it in specific ways.
- Built-in assumptions: In a bid to make it easy to evaluate LLM output and quality, Datadog includes built-in assessments. However, what defines “good” in this context can be subjective, and the way Datadog assesses quality may differ from the way an organization wishes to do so.
- Potentially high costs: Datadog’s AI features can be costly, especially at scale. That’s due not just to the core pricing, but also to the fact that Datadog requires telemetry data to move into its SaaS platform – which also means that the data needs to leave customers’ clouds. This can trigger high data egress costs.
Datadog AI observability pricing: What to expect at scale
Datadog prices its AI observability capabilities primarily based on the number of LLM spans you retain. Datadog's public pricing lists the following rates:
Datadog's pricing page shows the first 100,000 spans at $160/month on the listed base tier, with additional volume charged incrementally. Longer retention is priced separately.
For example, at the base listed rate, 1 million LLM spans would be approximately $475/month before any applicable retention charges: $160 for the first 100,000 plus 90 × $3.50 for the remaining 900,000 spans.
Note, however, that the actual bill will depend on your Datadog plan, included allotments, and contract terms. In addition, if you’re trying to correlate AI performance with the performance of underlying infrastructure, you’ll pay separate costs for Datadog’s conventional infrastructure monitoring features.
Note, too, that these figures don’t include data egress costs – which can become steep if you need to move lots of LLM telemetry data out of your cloud and into Datadog’s SaaS platform.
When and why teams start looking for Datadog AI observability alternatives
Datadog’s established brand has made it a popular solution for organizations in need of AI observability. However, some find that it’s not the best fit, due to issues like limited configurability and data privacy.
Teams seeking a different AI observability solution have two options. One is to use open source AI observability, like Langfuse or OpenLIT. This is doable, but many of these offerings are still maturing, and they also don’t always cover AI observability needs end-to-end.
The other option is to choose an alternative enterprise-ready AI observability platform, like groundcover AI Observability (more on that in a moment).
Your AI observability data doesn’t have to leave the cloud
One of groundcover’s key benefits over Datadog’s AI monitoring features is that groundcover doesn’t require you to send telemetry data to third-party servers. You can keep it on your own infrastructure using groundcover’s on-prem and air-gapped solutions.
In contrast, Datadog AI observability routes all LLM telemetry through Datadog's SaaS infrastructure. For teams with data sovereignty requirements, regulated AI workloads or cost concerns, this is a structural constraint rather than a configuration option.
AI observability inside your own cloud with groundcover
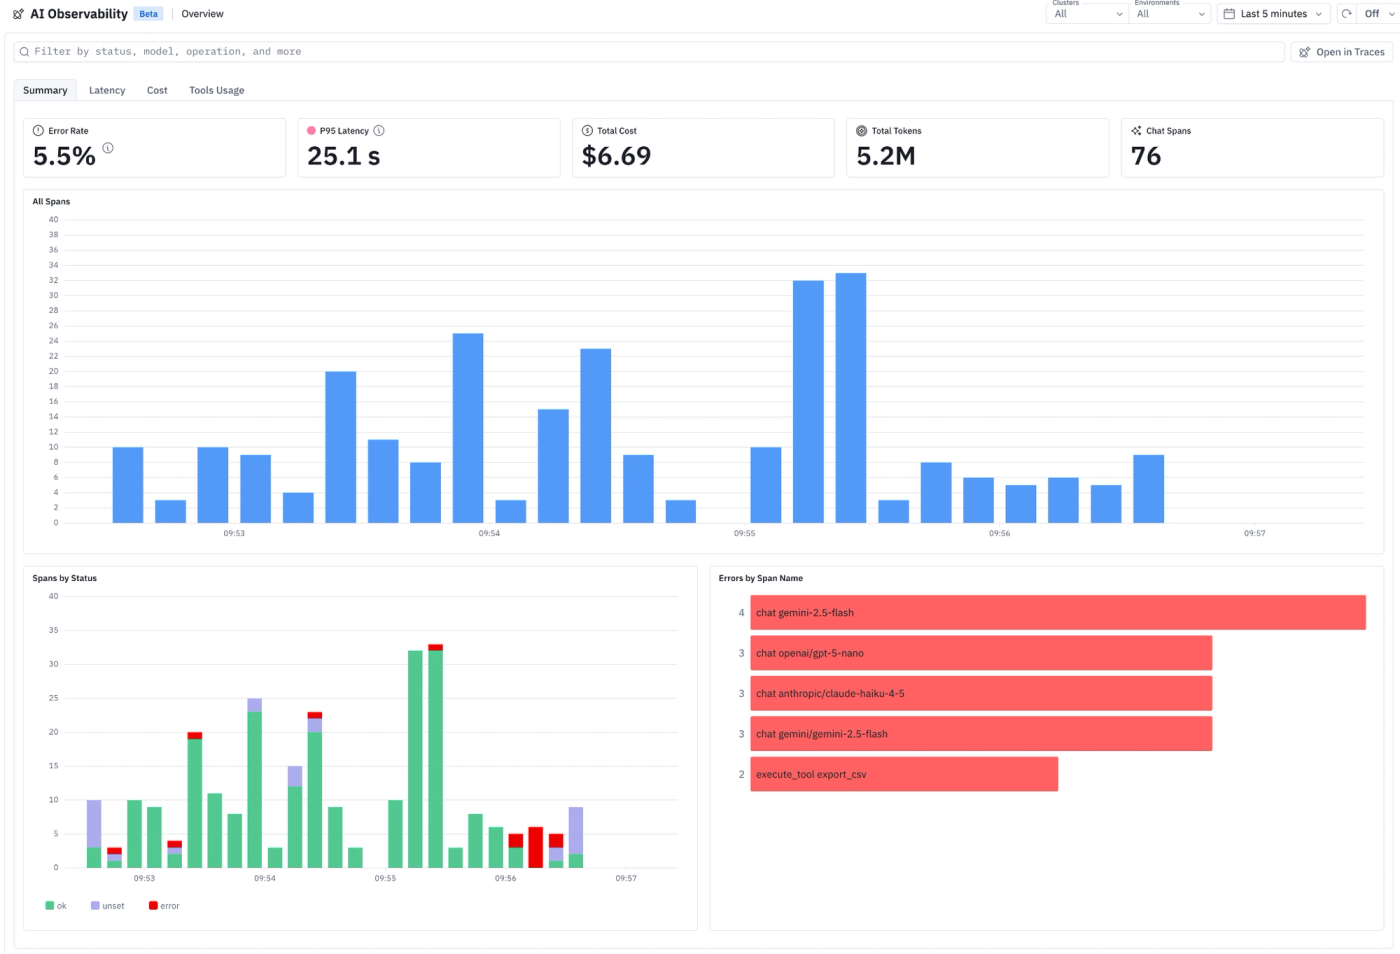
Groundcover's Bring Your Own Cloud (BYOC) architecture keeps every AI observability signal, LLM call trace, token cost, agent pipeline data, and prompt content inside the customer's own cloud – all available through a single product SKU and with no data egress, 100% fidelity, no sampling, and no surprise bills tied to ingestion volume.
Even better, groundcover offers simple instrumentation and hyper-efficient, eBPF-based data collection, making it just as easy and scalable to observe AI applications as it is to manage traditional apps and infrastructure.
A grounded perspective on Datadog AI observability
Datadog AI observability has clear pros and cons. For organizations already deeply committed to the broader Datadog platform, the company’s AI features are easy to deploy.
However, potentially high egress fees, limited customizability, and the inability to avoid sending sensitive data to a remote SaaS platform can become showstoppers in certain cases, which is why it’s good to know that alternatives to Datadog LLM observability and agentic monitoring exist.
FAQs
Yes, you can observe self-hosted or open source LLMs with Datadog. However, doing so requires using custom instrumentation rather than out-of-the-box integrations. Datadog AI observability works most seamlessly with commercial AI models from major vendors like OpenAI or Anthropic.
Datadog provides access controls for sensitive Agent Observability data, and its Sensitive Data Scanner can detect and optionally redact or hash PII and other sensitive information in telemetry. However, you still have to send the data to Datadog’s servers, so any PII that you don’t filter out could be exposed to third parties.
Groundcover supports “Bring Your Own Cloud” data residency, meaning telemetry remains in the customer's environment. It also includes AI observability without a separate usage-based SKU, and it uses eBPF for zero-instrumentation collection.
In contrast, Datadog relies on a SaaS model that requires data to leave the customer’s cloud. It also bills separately for AI observability.