LLM Observability: How to Monitor and Debug AI Systems in Production



Imagine that you’ve gone all-in on vibecoding by using LLMs to help generate application source code. It’s going great until you realize that your token costs greatly exceed your expectations.
Getting to the root cause of the issue requires understanding exactly how your LLMs are operating. You need to track relevant metrics like token consumption per session and trace requests as they move between you (the human), AI agents you’ve deployed to help with the coding process, and LLMs.
Gaining this insight is where LLM observability comes in. By helping teams to understand how LLMs process requests and what actually happens internally when they respond to user prompts, LLM observability plays a key role not just in keeping costs in check (as in the example above), but also in optimizing LLM performance, security, and more.
For details, keep reading as we explain what LLM observability means, how it works, how to implement it, and best practices for getting the most from observability tools to supercharge LLM outcomes.
What is LLM observability?
LLM observability is the practice of tracking and analyzing LLM behavior and LLM outputs.
The purpose of LLM observability is to provide insights into how LLMs are operating – which is critical because by default, LLMs are relatively opaque. They will happily respond to prompts by generating output, but they provide little, if any, details about how they arrived at the output. Nor do they offer insights such as how long it took them to perform each of the various steps required to respond to a prompt, or how each step in the process contributes to total token costs.
LLM observability vs. traditional APM
In some senses, LLM observability builds on conventional application performance management (APM). Like APM, the main goal of LLM observability is to help teams pinpoint the root cause of performance issues, financial waste, and (to some extent) security risks.
That said, observability for LLMs is also fundamentally distinct in certain ways. One key difference is that unlike traditional applications, LLMs are non-deterministic. This means that the same LLM input won’t always produce the same output. By extension, performance or cost trends for LLMs can be harder to predict, due to the variability in LLM behavior.
LLM observability also requires distinct tooling. Conventional monitoring software isn’t designed to measure LLM performance metrics, trace the processing of prompts or detect security risks in LLMs. These capabilities require tools that are capable of integrating with LLMs in ways that expose their internal data flows.
Exactly how visibility into LLM operations works depends on how the LLM in question is designed and which software stack (such as LangChain or LlamaIndex) the LLM uses. The extent to which LLMs observe can vary, but most support at least some level of observability.
LLM observability & LLM monitoring: Why both matter
LLM observability is also distinct from LLM monitoring. The latter term refers to tracking basic LLM metrics, like response latency rates and token costs. LLM observability goes deeper by also assessing the quality of LLM outputs, the way LLMs leverage internal and external data sources to generate responses, and the frequency with which LLMs hallucinate.
Both practices – LLM monitoring and observability – play important roles in optimizing LLM performance, cost and security. This is because monitoring provides basic, but fundamental, insights into the state and health of LLMs, while observability makes it possible to go deeper and gain context on more complex issues. Hence the importance of using monitoring and observability practices in conjunction to get the most out of LLMs.
The three layers of LLM observability
The LLM observability process can be broken down in terms of “layers.” Each layer represents a separate category of information and provides different types of insights to help optimize LLM outcomes.
Here’s a look at each layer and what it entails.
Computational layer: Latency, token cost, and throughput
The computational layer focuses on the operational performance of an LLM. It measures how efficiently models process requests.
Key metrics include:
- Latency: Tracks how long models take to generate responses
- Token usage and cost: Help teams understand the resources consumed by prompts and outputs.
- Throughput: Measures how many requests or tokens a system can process over time.
Monitoring these metrics helps teams identify performance bottlenecks, control inference costs and determine whether infrastructure can support growing workloads.
Semantic layer: Hallucination detection, relevance, and output quality
The semantic layer assesses whether an LLM produces accurate, relevant and useful responses rather than simply measuring how quickly or cheaply it generates them. Observability at this layer (which is sometimes referred to as LLM evaluation) can track hallucinations, factual consistency, relevance to the user's request, adherence to instructions and other measures of output quality.
These signals help identify model developers to identify model regressions, problematic prompts or retrieval failures. They also help determine whether changes to models or application logic are improving the quality of responses.
Due to the subjective nature of LLM response quality, LLM evaluation metrics are often qualitative in nature. They can be assessed based on manual user feedback that evaluates the quality of responses; however, it’s possible to standardize and scale analyses using methods like BERTScore and semantic similarity comparisons.
Agentic layer: Multi-step reasoning, tool selection, and memory retention
The agentic layer focuses on applications where LLMs perform multi-step tasks, interact with external tools (which means the models become part of agentic AI workflows) and/or maintain information across interactions.
At this layer, observability tracks how agents progress through individual steps, which tools they select, whether those tools produce useful results, and how effectively the agent retains and uses relevant context or memory.
Monitoring these behaviors helps teams identify inefficient reasoning loops, incorrect tool calls, failures between workflow steps, and memory-related problems that may not be visible when observing individual LLM requests in isolation.
How LLM observability works in practice
The specific way that teams implement LLM observability depends on factors like which aspects of LLM behavior they want to analyze, the architecture of their LLMs, and the software stacks used to create the LLMs.
In general, however, the LLM observability process boils down to the following key practices.
Instrumentation: SDK vs. proxy approaches
Instrumentation provides the telemetry needed to observe LLM applications, with SDK-based and proxy-based approaches offering different levels of visibility and control.
SDK instrumentation integrates directly into application code, making it possible to capture detailed context such as prompts, model parameters, tool calls, and application-specific metadata.
In contrast, proxy instrumentation sits between the application and the model provider, making it easier to monitor requests across multiple applications or models without modifying each application.
Choosing the right approach affects the depth, consistency, and coverage of the telemetry available for troubleshooting and performance analysis.
Distributed tracing across LLM calls and agent pipelines
Distributed tracing connects individual LLM calls to the broader application workflow, allowing teams to follow a request as it moves through prompts, model invocations, tool calls, APIs and other services.
Tracing is particularly important for agentic workflows, where a single user request can trigger many dependent operations. By correlating these steps into a trace, teams can identify which operation introduced latency, consumed excessive tokens, or caused an agent workflow to fail.
RAG observability: Tracing the retrieval-generation dependency chain
Retrieval-augmented generation (RAG) observability tracks the complete path from a user's query through document retrieval, ranking, context construction and final LLM generation. This helps teams determine whether poor responses originate from the model itself or from problems earlier in the retrieval pipeline, such as missing documents, irrelevant search results or excessive context.
Monitoring retrieval latency, retrieved content, ranking behavior, and the relationship between retrieved context and generated output provides the visibility needed to diagnose RAG quality and performance issues.
Safety and security signals: PII detection and prompt injection monitoring
Safety and security signals extend LLM observability beyond performance and quality by monitoring potentially harmful or unauthorized interactions with models. Personally identifiable information (PII) detection can identify sensitive information entering prompts or appearing in outputs, while prompt injection monitoring can flag attempts to manipulate model instructions or bypass application controls.
Tracking these signals alongside traces and application telemetry helps security and engineering teams understand where risks occur, investigate incidents, and identify recurring attack patterns or unsafe model behavior.
Why LLM observability is harder to ignore than it looks
For organizations that have adopted LLMs (or AI agents, which depend on LLMs), it can be easy at first to ignore the importance of LLM observability. Most LLMs do what they’re supposed to do, most of the time.
The problem, though, is that getting the most from LLMs requires the ability to optimize how they operate – and that requires observability. For example, observability insights might reveal that an LLM’s token costs are higher than they should be due to issues like poorly formulated prompts or inefficient prompt processing by the LLM. Or, it could show that output quality is poor, which may mean that an organization might want to invest in additional RAG resources to improve LLM accuracy or context.
To put this another way, you wouldn’t typically settle for a Web app that is merely “good enough” from a performance, cost, or security standpoint. You would monitor and observe it to find ways to optimize it. Similarly, you should leverage LLM observability to identify opportunities for getting more out of your LLMs, while also reducing the risks associated with deploying LLMs in a business environment.
Common challenges teams face when implementing LLM observability
Appreciating the value of LLM observability is one thing. Implementing it in an efficient, scalable way is another due to challenges such as:
- High-cardinality and sensitive telemetry: LLM applications can generate very large volumes of prompts, responses, tokens, traces and metadata. Analyzing all of that data efficiently can be challenging, especially for organizations that don’t know exactly what to prioritize.
- Sensitive telemetry data: LLMs may also create output that contains sensitive information, which makes data collection, storage and redaction more difficult to manage due to data privacy requirements and risks.
- Fragmented multi-provider environments: Applications may use multiple models, APIs and AI providers, each exposing different metrics and telemetry formats, making it difficult to establish consistent observability across the stack.
- Limited visibility into complex agent workflows: Multi-step agents can involve repeated LLM calls, tool invocations, retrieval operations and memory lookups, making it challenging to reconstruct the full execution path and identify where failures originate.
- Measuring output quality consistently: Latency and token usage are relatively straightforward to measure, but evaluating relevance, factual accuracy, hallucinations, and overall response quality often requires application-specific evaluation methods and additional context.
LLM observability tools and platforms worth knowing
The LLM observability ecosystem remains new, and tooling continues to evolve. Still, effective solutions exist that can help to track and analyze LLM behavior. Here’s a look at a few popular open source options.
Langfuse
Langfuse is a general-purpose open-source choice for LLM observability and LLM engineering. It provides tracing for LLM calls, retrieval operations, tool executions and agent workflows, along with token and cost tracking, evaluations, prompt management and experiments. Its core platform is MIT-licensed and can be self-hosted using Docker, Kubernetes or Terraform, making it particularly attractive for teams that want to keep telemetry inside their own infrastructure.
Phoenix
Arize Phoenix is an open-source platform focused heavily on tracing, evaluation, and troubleshooting AI applications. It uses OpenTelemetry-based instrumentation and supports LLM calls, retrieval workflows and agent frameworks, while also providing evaluation capabilities for areas such as response and retrieval quality. Phoenix can run locally, in containers or on Kubernetes, making it a useful option for teams that want an observability platform without depending on a hosted service.
OpenLIT
OpenLIT takes an OpenTelemetry-native approach to AI observability and is particularly interesting for teams that want visibility beyond LLM calls. It can trace LLMs, agents, vector databases, and GPU activity while tracking metrics such as latency, token usage, and cost, and it also includes evaluations and prompt management. OpenLIT is Apache 2.0-licensed and can be self-hosted without licensing fees, making it a good fit for teams building an observability stack around OpenTelemetry.
Best practices: What high-performing teams do differently with LLM observability
To get the very most out of LLM observability solutions, high-performing teams adopt best practices like the following:
- Instrument the entire LLM workflow: Capturing telemetry across prompts, model calls, retrieval, tool invocations and application services is critical for allowing teams to trace a request all the way from initial input to final output.
- Monitor both performance and quality: Track latency, token usage, cost and throughput alongside metrics for relevance, hallucinations, accuracy and response quality to understand both operational and user-facing performance.
- Protect sensitive telemetry: Detect and redact PII, credentials and other sensitive information before storing prompts, responses and traces, while applying appropriate access controls and retention policies.
- Establish baselines and continuous evaluation: Define expected performance and quality levels, monitor changes over time and regularly evaluate models, prompts and agent workflows to detect regressions before they affect users.
LLM observability without a separate stack: groundcover’s AI observability in your own cloud
In an ideal world, teams shouldn’t have to deploy and operate separate observability tools to support conventional APM needs and LLM observability needs.
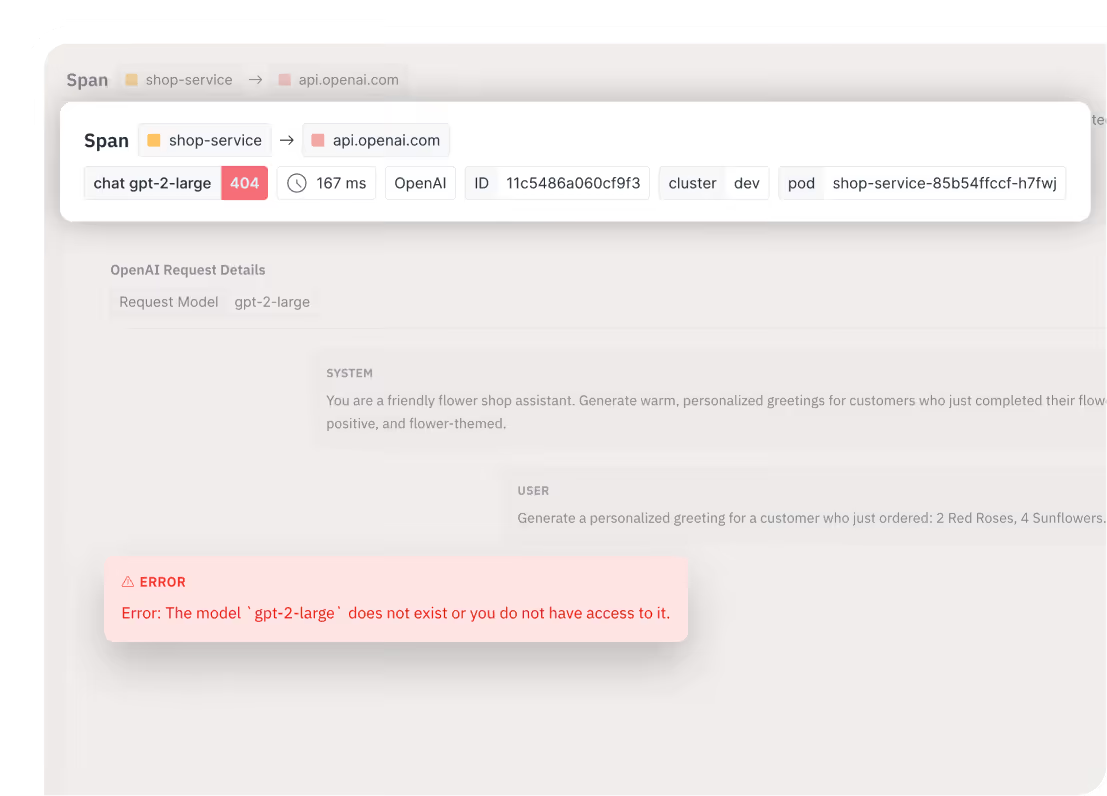
That’s why we built groundcover AI observability, which extends the groundcover platform to provide rich insights into LLM and AI agent behavior. The solution makes it possible to understand exactly what’s happening in complex AI workflows, which in turn means you can optimize for performance, cost, and data privacy.
The icing on the cake is that – like the traditional groundcover platform – AI observability doesn't require complex instrumentation. It also uses eBPF to deliver a hyper-efficient, minimal-overhead approach to LLM visibility.
Conquering the art of LLM observability
In short, it’s no longer enough to gain visibility into traditional applications. As AI becomes a core element of software that powers business operations, teams must also be able to observe the LLMs that are at the heart of AI-powered workflows – which is where AI observability solutions like groundcover come in.
FAQs
LLM observability continuously monitors the runtime behavior and performance of an application. In contrast, LLM evaluation assesses output quality (LLM evaluation can be thought of as a step in the broader LLM observability process, but some people treat them as distinct practices). Both are useful together when teams need to understand not only whether an LLM system is operating efficiently but also whether it is producing reliable results.
Use lightweight, asynchronous instrumentation (like the eBPF-based solution available from groundcover) to capture essential telemetry in the background, sample high-volume traces, and avoid blocking the request path while telemetry is processed or exported.
groundcover can correlate application and LLM telemetry with Kubernetes, infrastructure, and network signals in a unified observability environment, helping teams connect model latency and token consumption with the underlying resource utilization metrics or service behavior.