How eBPF Enriches OTel–A payment service quietly regressing after an unsuccessful migration
Explore how eBPF payload capture and Kubernetes config diffs reveal payment service regressions and failed migrations that traditional APM tracing misses.


In the previous blog post, we learned about what eBPF is and showcased the first example in a series of 4 examples for why eBPF should be used along OTel to provide observability with zero downtime, full application coverage, and no-code instrumentation.
This series of posts will walk through four failures:
- A slow SQL query caused by one user with a million rows.
- A missing database table.
- A Postgres index rebuild strangling everything around it.
- A payment service quietly regressing after an unsuccessful migration.
And this post will focus on the third example. By the end of this series I hope you walk a way with a more centered and practical understanding of why eBPF it feels magical. If you prefer to learn through watching videos you can watch the corresponding webinar here.
Example four: the payment payload that OTel wouldn't log
The last failure is the most layered, and it's where OTel and eBPF are most obviously doing different jobs in the same trace. Before we get to it, a short detour, because the payment example leans on infrastructure views that also come free with the sensor.
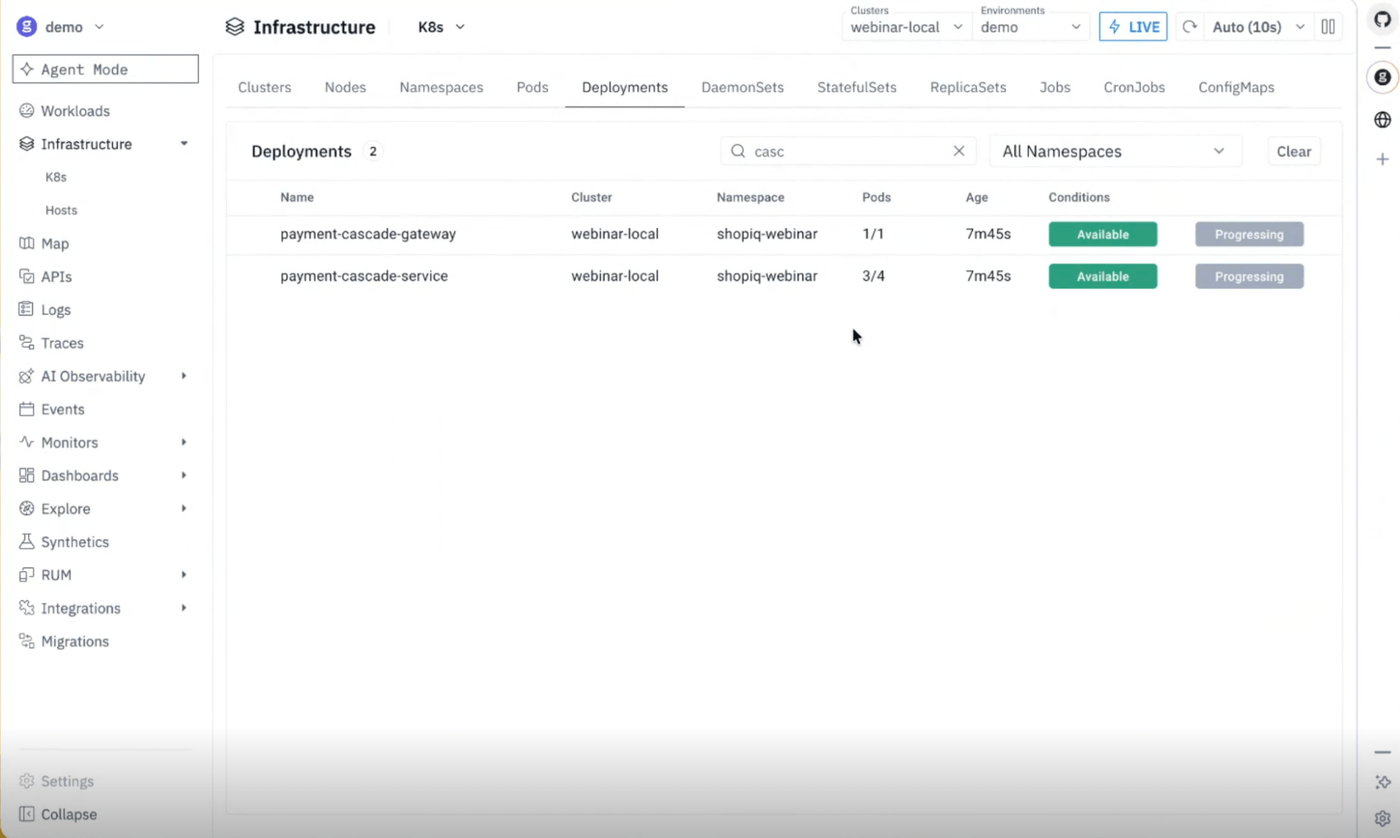
Deploy the sensor to a cluster and the entire Kubernetes object model shows up alongside your traces — clusters, nodes, namespaces, pods, deployments, DaemonSets, StatefulSets, ReplicaSets, jobs, CronJobs, ConfigMaps.
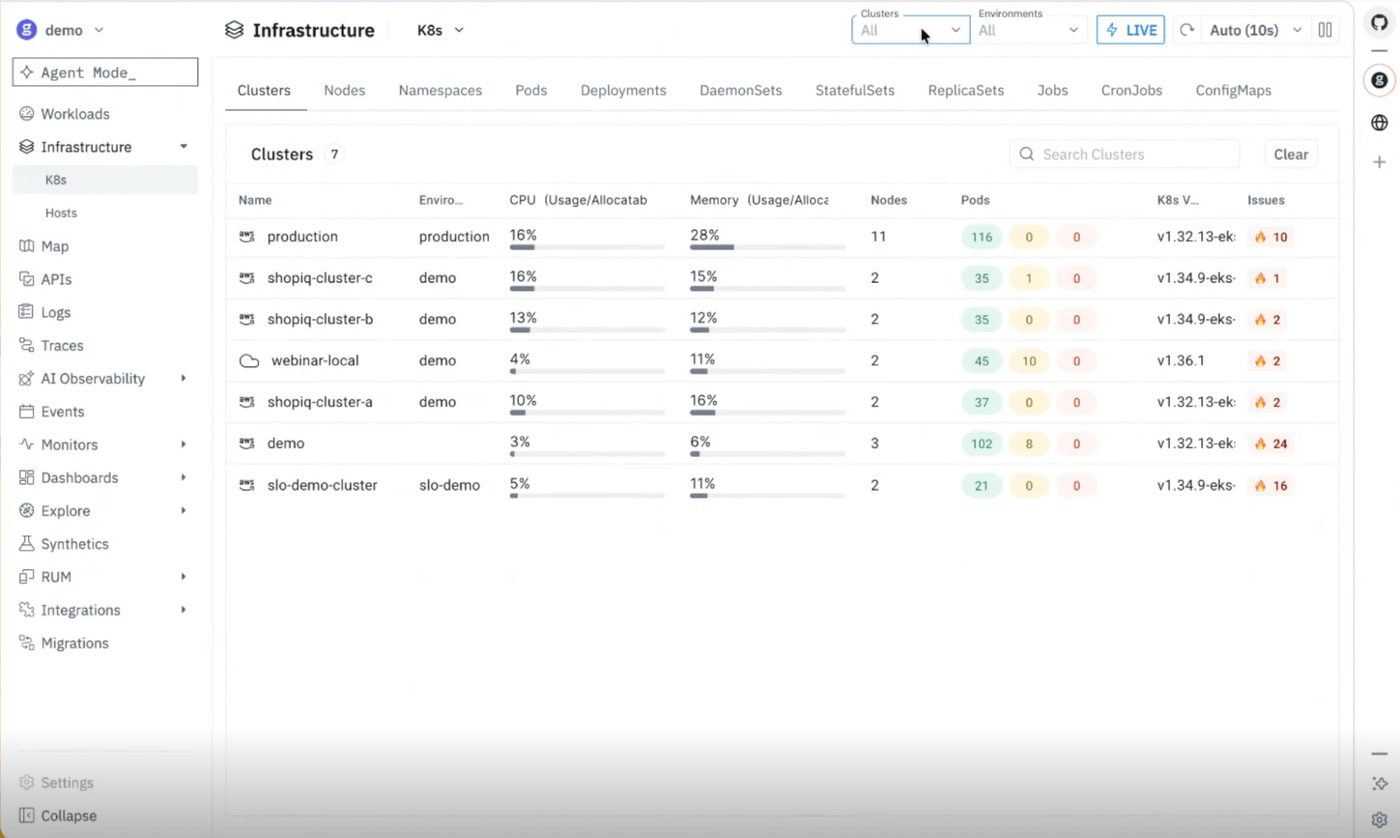
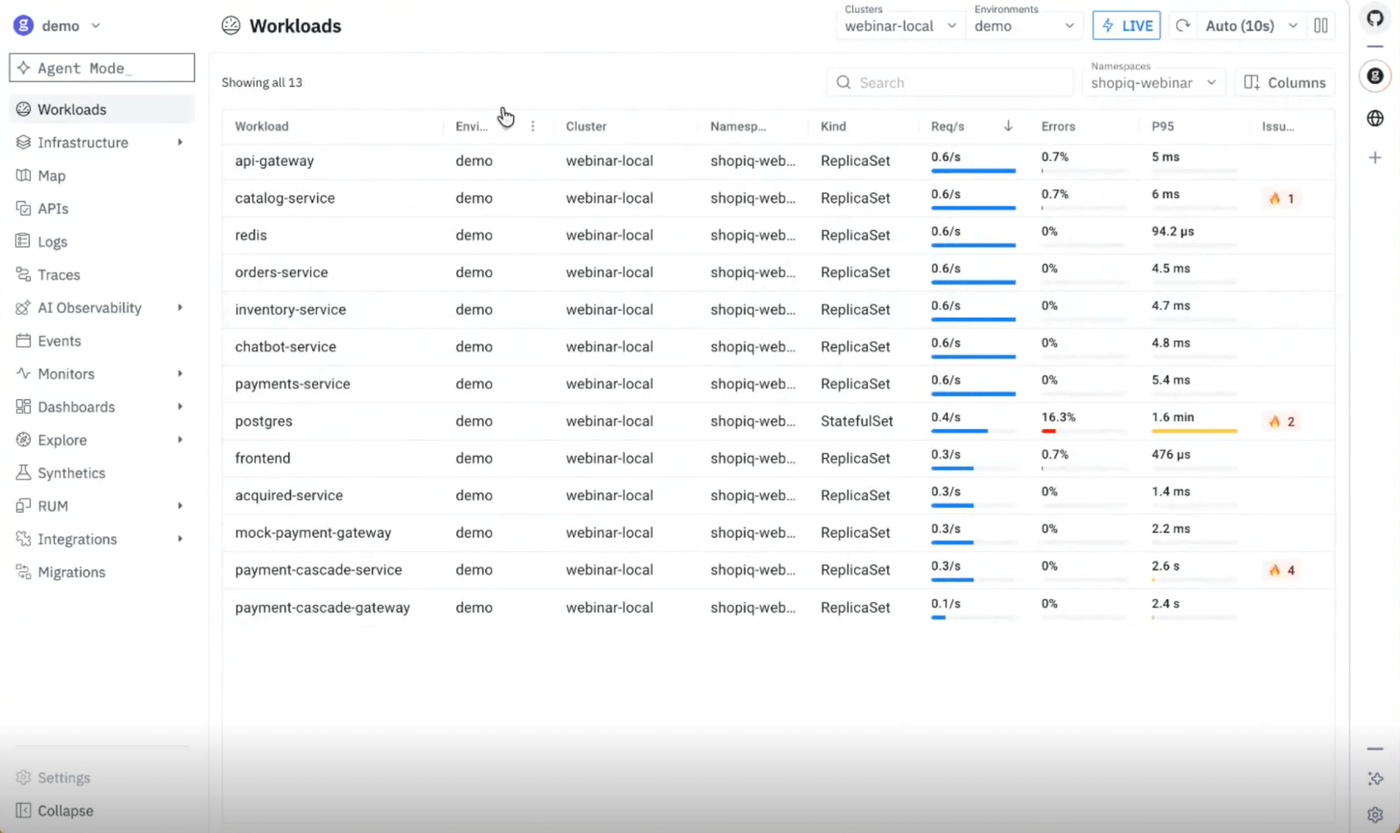
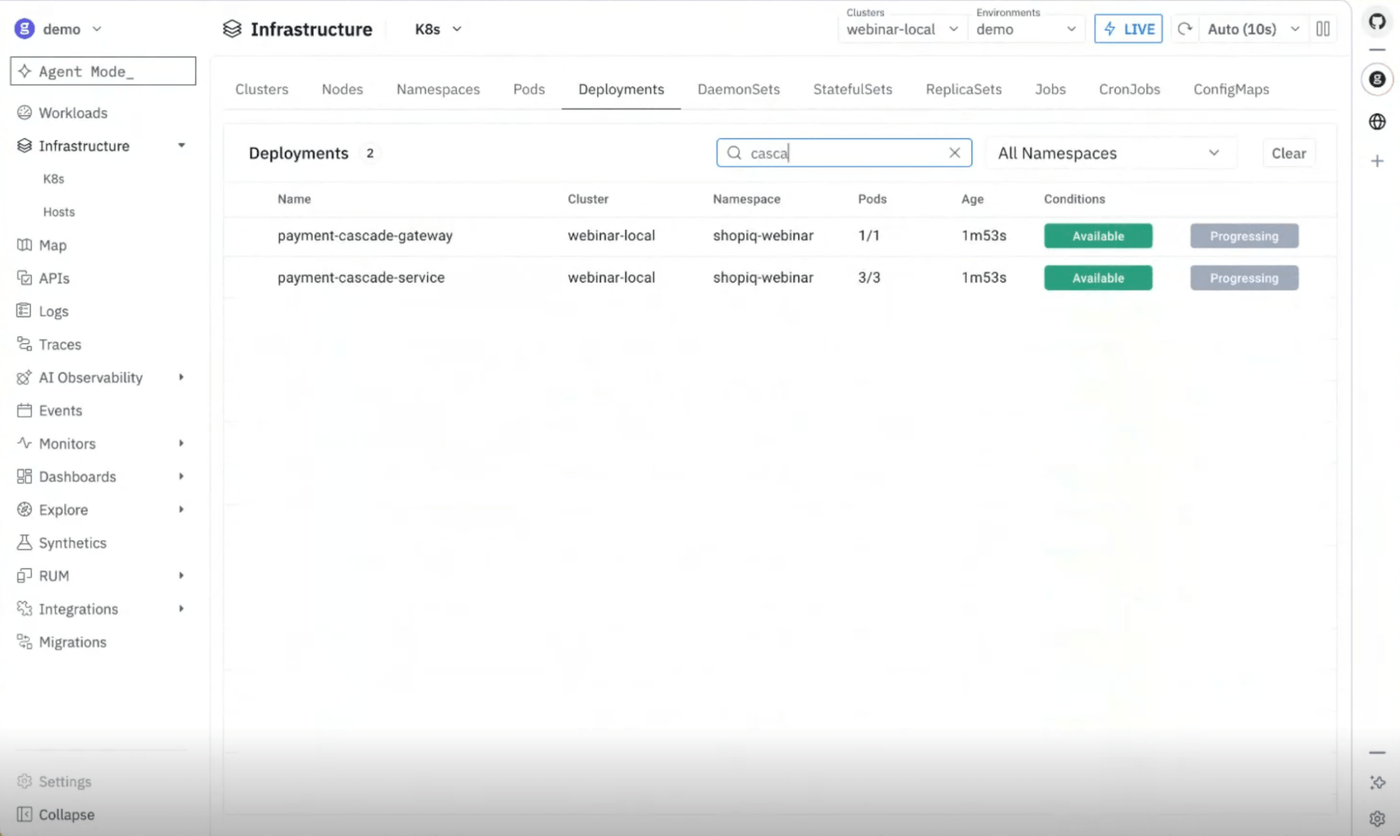
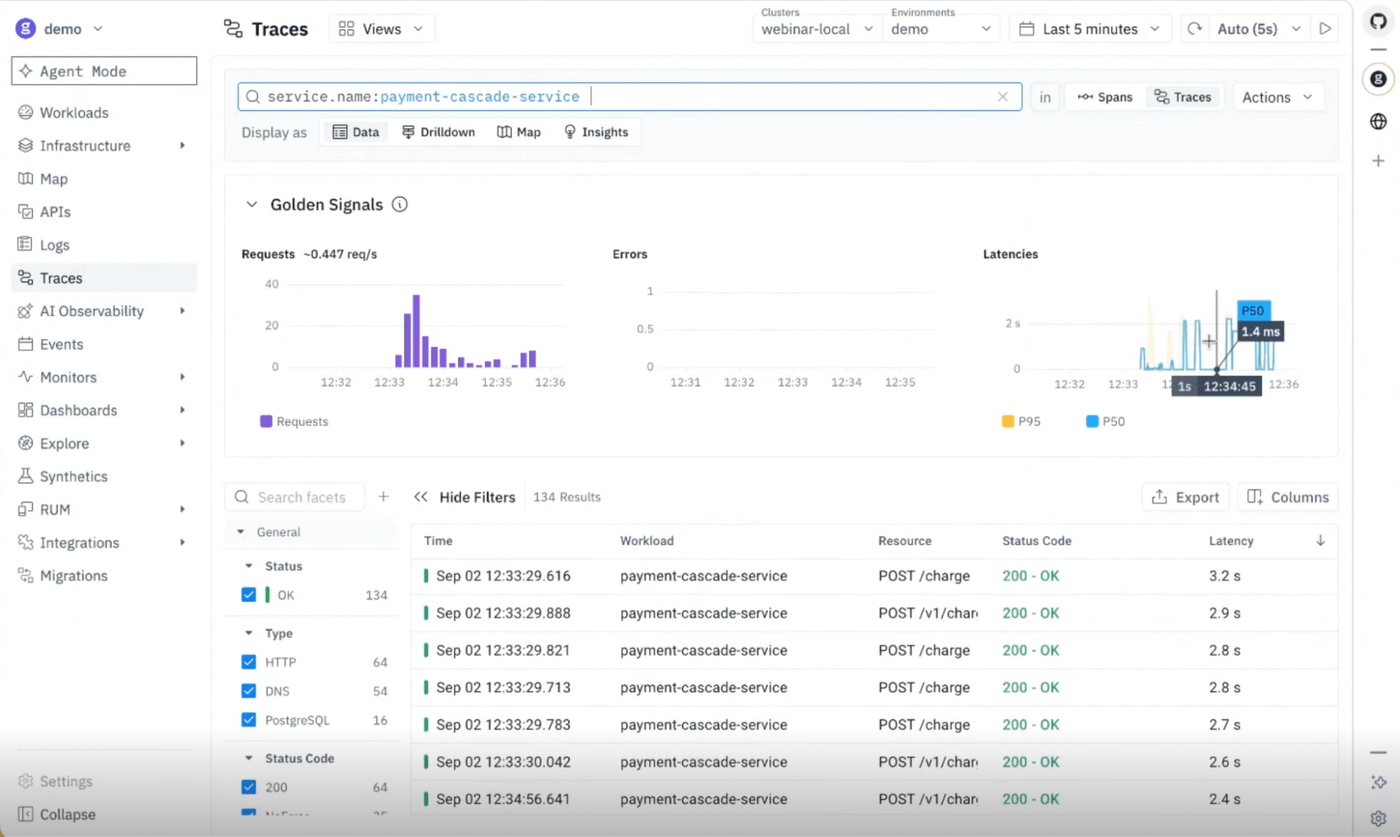
All of that comes from the same sensor install, which is worth saying plainly: you didn't configure a Kubernetes integration, you didn't add kube-state-metrics, you didn't write a scrape config. Now back to the failure. Latency on the payment-cascade service was bad. Some requests were taking over three seconds.
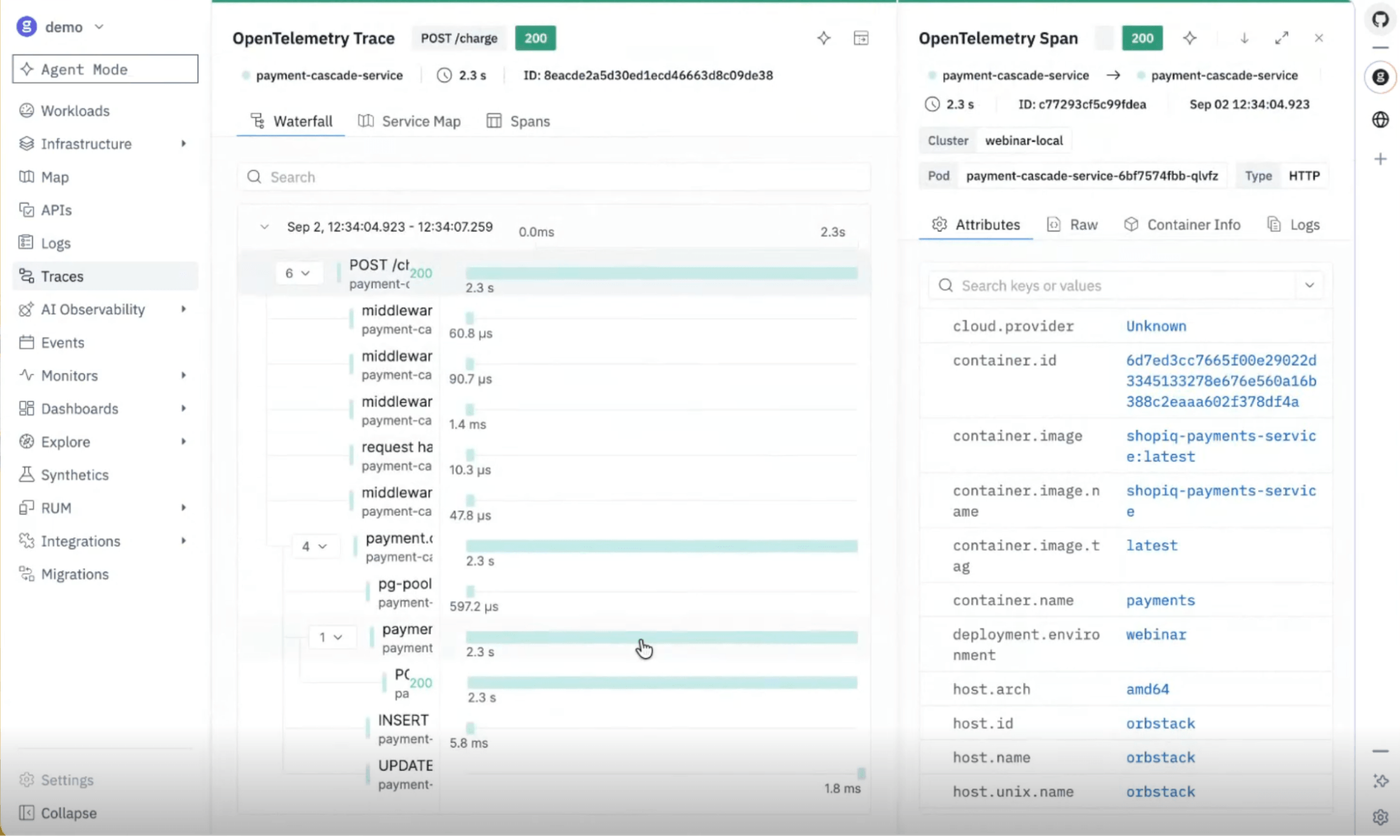
Filter down to OTel traces from the instrumented payments service and open one. You get a proper waterfall complete with every middleware hop, the request handler, the charge call, the connection pool acquire, the INSERT and UPDATE at the end.
Worth clearing up a misconception here, because it comes up constantly: OpenTelemetry isn't only for tracing requests between services. It can go down to individual function calls. How far it goes depends on how much instrumentation you're willing to write and how good the auto-instrumentation is for your language - a derive macro in Rust, function annotations or a runtime hook in JavaScript. It's a dial, not a switch. However, with groundcover we can click down through the waterfall to the outbound call to the payment gateway, and the span carries an "Enriched by eBPF" badge and the full request body.
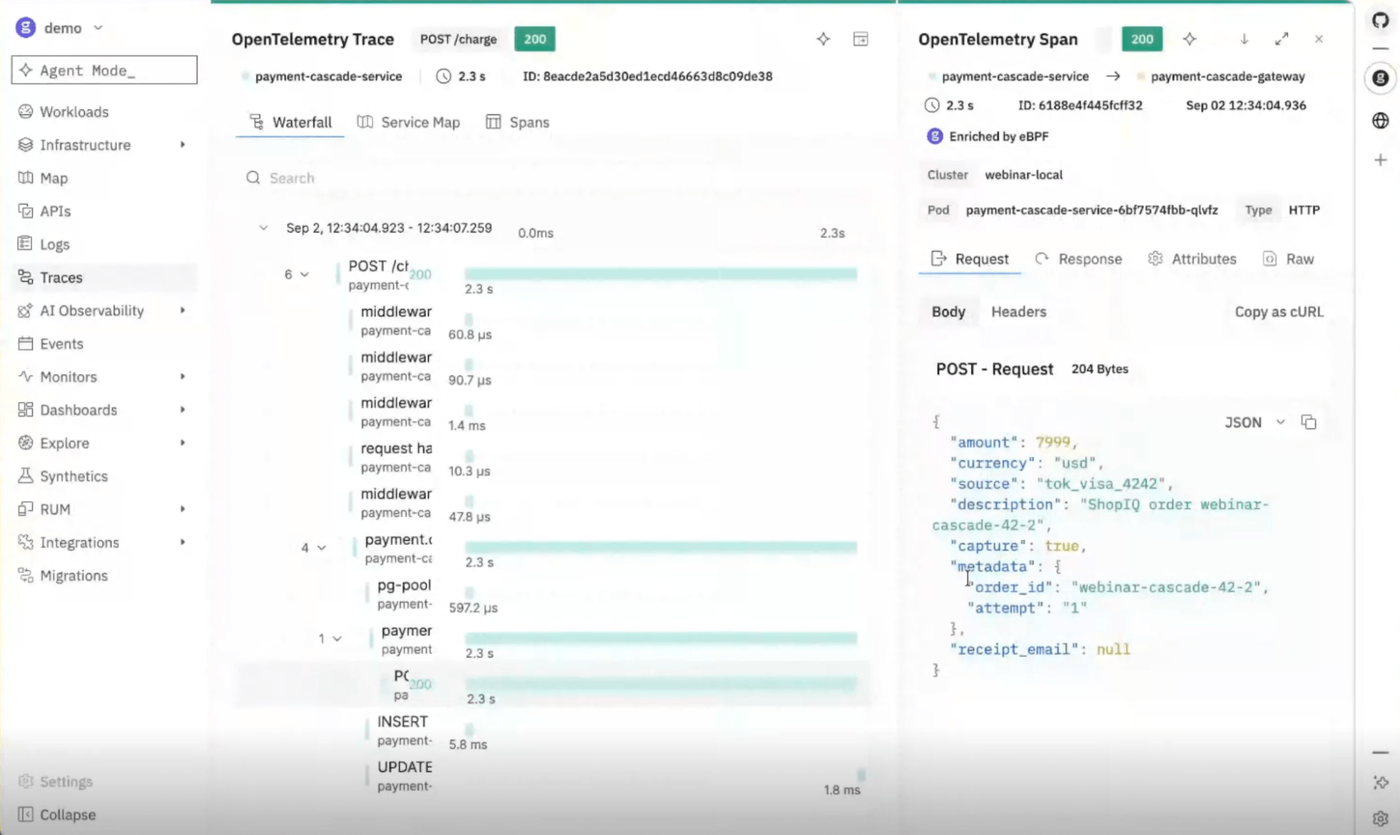
It doesn't log them for good reasons. Request bodies are high-cardinality, expensive to store, and full of things you legally cannot keep. So the default is to drop them, and the payment source type — the thing you'd actually want here — goes with them. eBPF captures it on the wire, and groundcover's parsing rules let you decide field by field what gets dropped before ingestion. You can even hand a span to the agent and have it write the parsing rule for you. That's a better trade than "never collect it": you get to see the field, and you get to decide it never leaves the node.
The body gave us a hypothesis and the container config confirms that legacy payment tokens are being rate-limited.
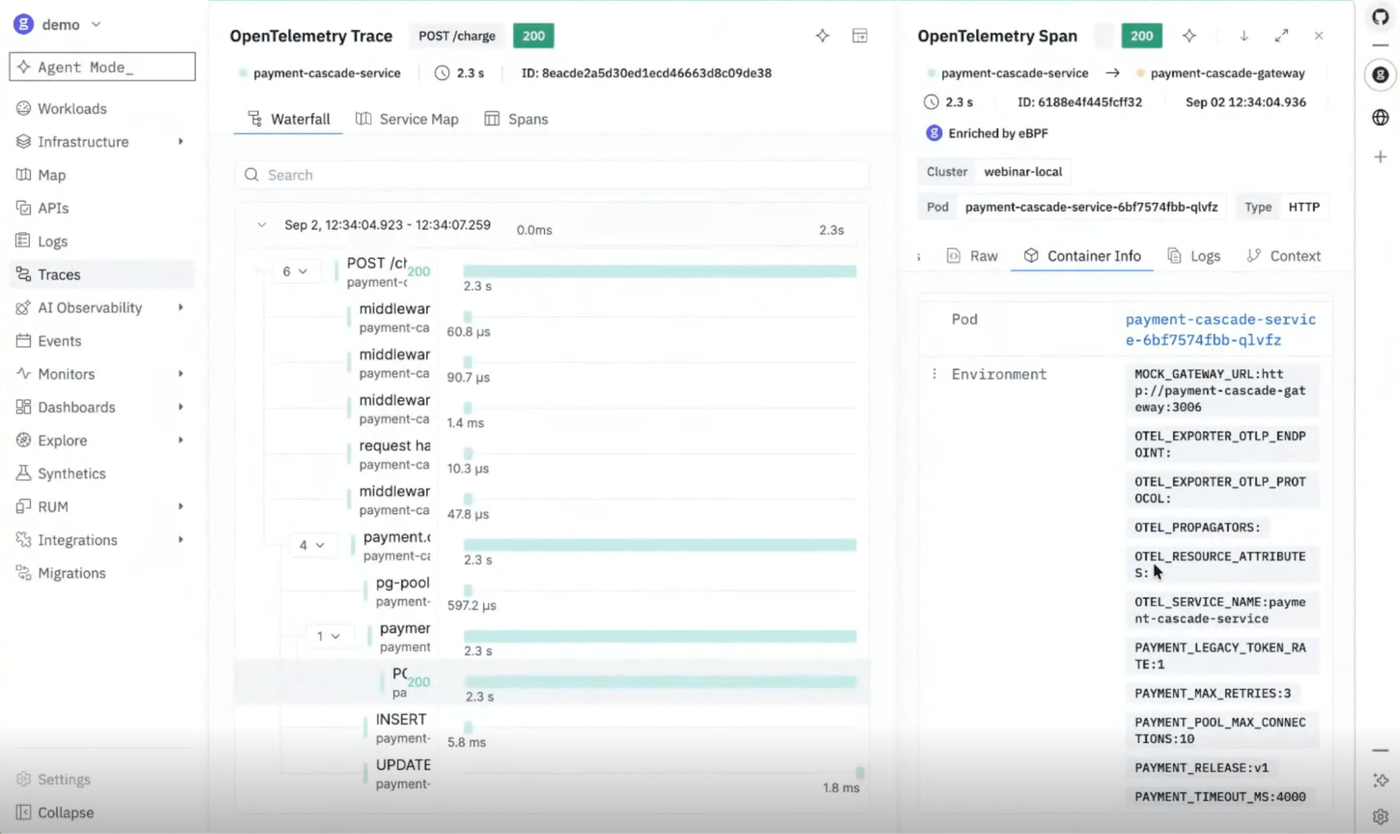
That's a regression from a half-finished migration. Classic strangler pattern: new system on one side, old system on the other, a stopgap in the middle that someone shipped and forgot. We triggered a new deployment to turn the rate limiting off, and then things got worse, which is the honest part of this story.
The Changes view on the deployment answers it. Not by reading pod logs, not by diffing YAML in a terminal — by showing you exactly what changed between resource versions.
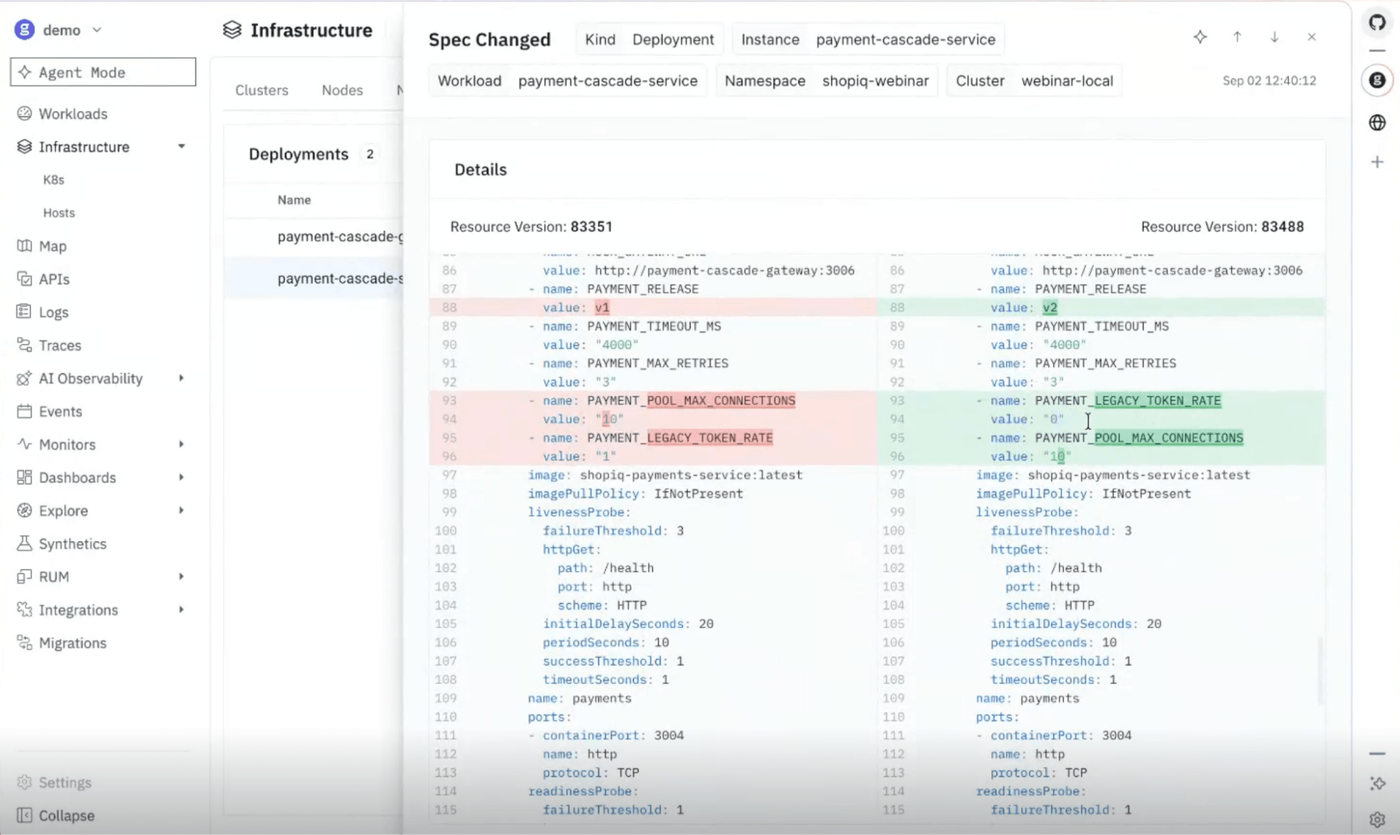
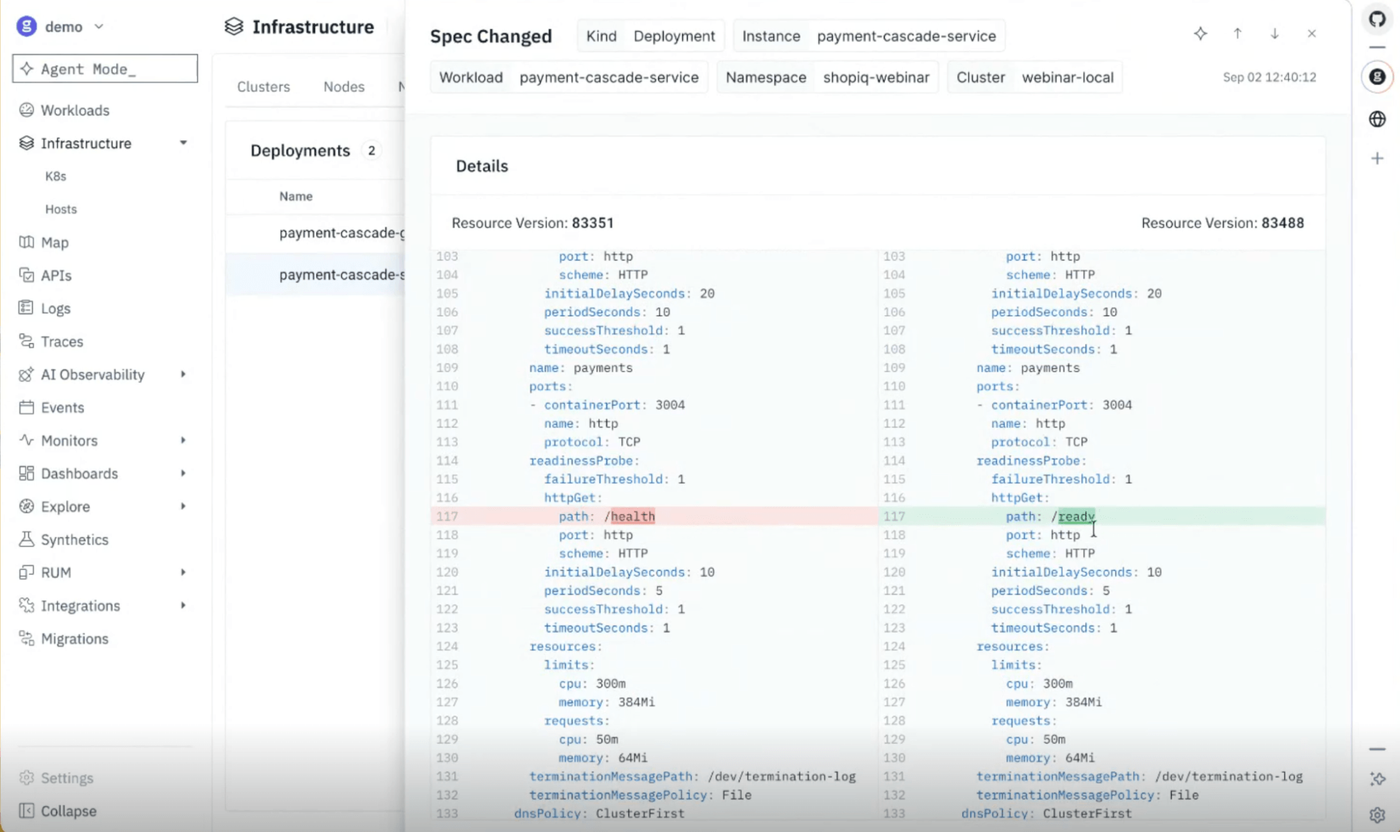
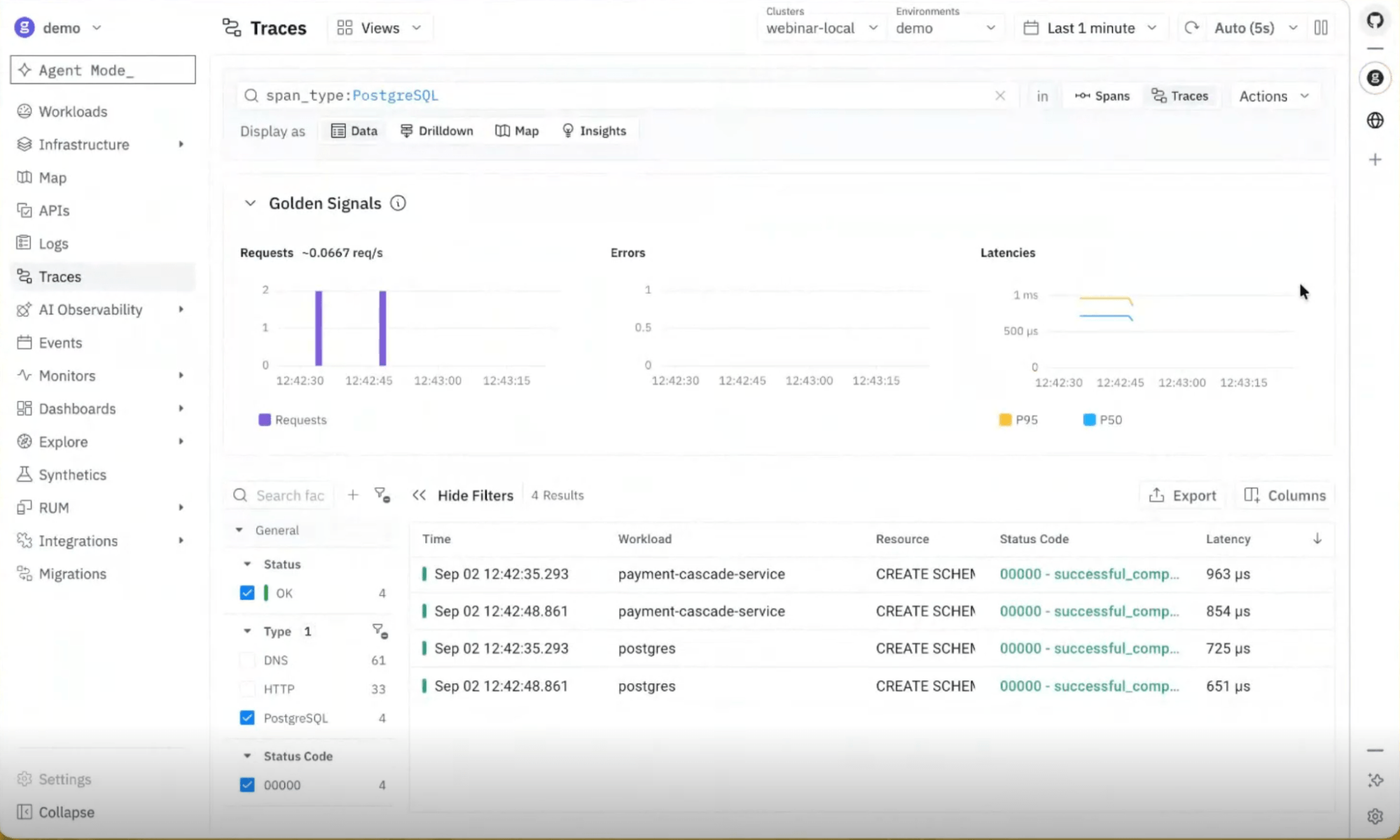
OTel gave the trace structure and the timing. eBPF gave the payload that identified the payment source. The Kubernetes layer gave the config diff that explained both the regression and the failed fix.
Where eBPF stops
For balance, because pretending a tool has no limits is how you lose people's trust: eBPF is excellent at protocols but has its limitations. It has L7 awareness for DNS, Postgres, Kafka, HTTP, Redis, and plenty more, and that gets you a long way. But when you want to know which function in your code crashed, eBPF is working from kernel probes and stack addresses. Unless your language emits symbols and you push those symbols to production (which many teams deliberately don't) you get addresses, not names. Languages like Node.js and Rust need frame pointers on top of that to produce anything a human wants to read. eBPF is very good at speaking computers. Turning that into something consumable by a person takes symbol tables, frame pointers, and higher-level tooling, and how much you get depends on your stack.
Which is the whole argument, really. This is why you instrument with OTel, and why the two layers are better together than either is alone.
Conclusion
What we saw in this post series was four failures with four different root causes and one pattern around the benefit of using eBPF and OTel together. The slow chat query came down to a bind parameter that OTel drops by default. The missing table was found in a workload that had no instrumentation at all and never would have. The index rebuild was somewhat invisible in any single span and only surfaced when an agent correlated everything in the cluster at once. And the payment regression needed an HTTP body and a container's environment variables that no reasonable instrumentation strategy would have captured.
OpenTelemetry is good at adding business context, application semantics, and the spans you wrote on purpose because you understood the domain. That's real, and eBPF doesn't replace it. What eBPF does is cover everything else, all the time, with no deploy required, so that when something breaks in a way you didn't anticipate, the evidence is already there. Then you use that evidence to decide where to add instrumentation next. Universal coverage on the bottom, deliberate context on top.
One last idea worth taking with you. For a long time, the artifact of a failed investigation was a dashboard. You’d dig through the data, you find the issue, and build a panel so you'd catch it faster next time. That's still useful. But in the first example, the artifact wasn't a dashboard. It was a skill: a saved investigation the agent can rerun, referencing the same queries and the same dashboards, on demand. It found the hot shard on its own, quantified it better than the manual version, and told us which fixes to skip.
That's what we're building toward. eBPF supplying the ground truth, OTel supplying the meaning, and an agent that runs inside your own cloud with access to both.

If you have any questions about eBPF or groundcover, I encourage you to join our community slack and ask any questions you may have. I also encourage you to give groundcover a try with our playground. Finally, I want to share a link to the corresponding webinar here in case you want to see the recorded demo of these examples all together.