How eBPF Enriches OTel–A Postgres index rebuild strangling everything around it
Discover how eBPF and OpenTelemetry help diagnose hidden database performance bottlenecks, such as a blocking Postgres index rebuild causing silent latency spikes.


In the previous blog post, we learned about what eBPF is and showcased the first example in a series of 4 examples for why eBPF should be used along OTel to provide observability with zero downtime, full application coverage, and no-code instrumentation.
This series of posts will walk through four failures:
- A slow SQL query caused by one user with a million rows.
- A missing database table.
- A Postgres index rebuild strangling everything around it.
- A payment service quietly regressing after an unsuccessful migration.
And this post will focus on the third example. By the end of this series I hope you walk a way with a more centered and practical understanding of why eBPF it feels magical. If you prefer to learn through watching videos you can watch the corresponding webinar here.
Example three: an index rebuild
The third failure is the opposite of the second. Nothing errors. Nothing crashes. The system just gets worse, and the reason is invisible from any single trace.
We kicked off a non-concurrent REINDEX INDEX against a large events table while a thousand index-backed readers kept querying it. In a real cluster this is a hundred-million-row table and a rebuild that runs for half an hour.
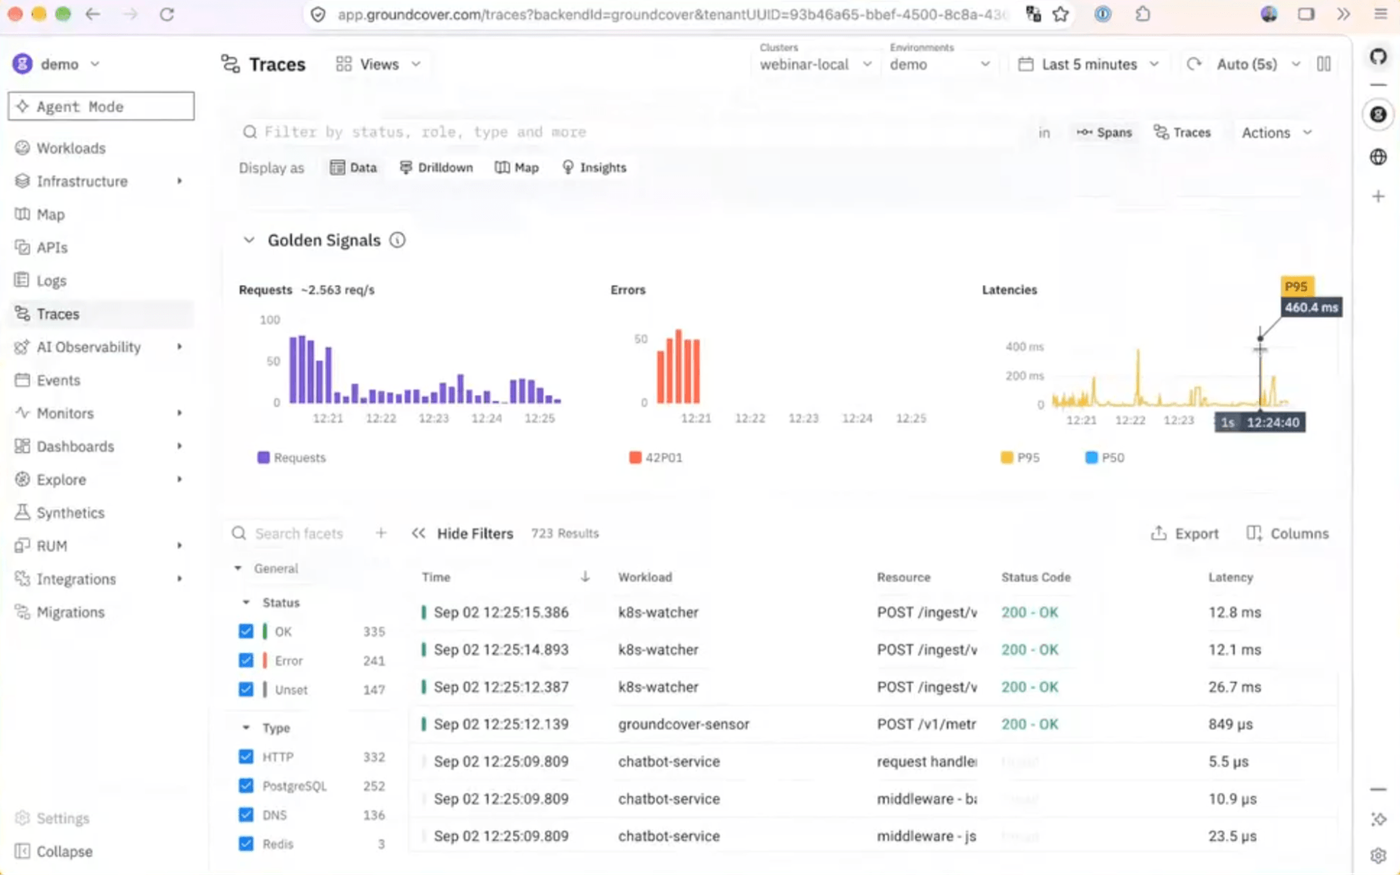
And that's the problem. Look at any individual span and you see a slow query. Look at the workload and you see elevated latency. Nothing in the UI announces "a blocking index rebuild is holding a lock." The lock waits are attributable to a specific session, but you have to know to go looking for the session.
So instead of hunting, we added one slow span to the agent's context and asked a deliberately lazy question: I'm noticing some Postgres latency, can you find out what's happening within my database?
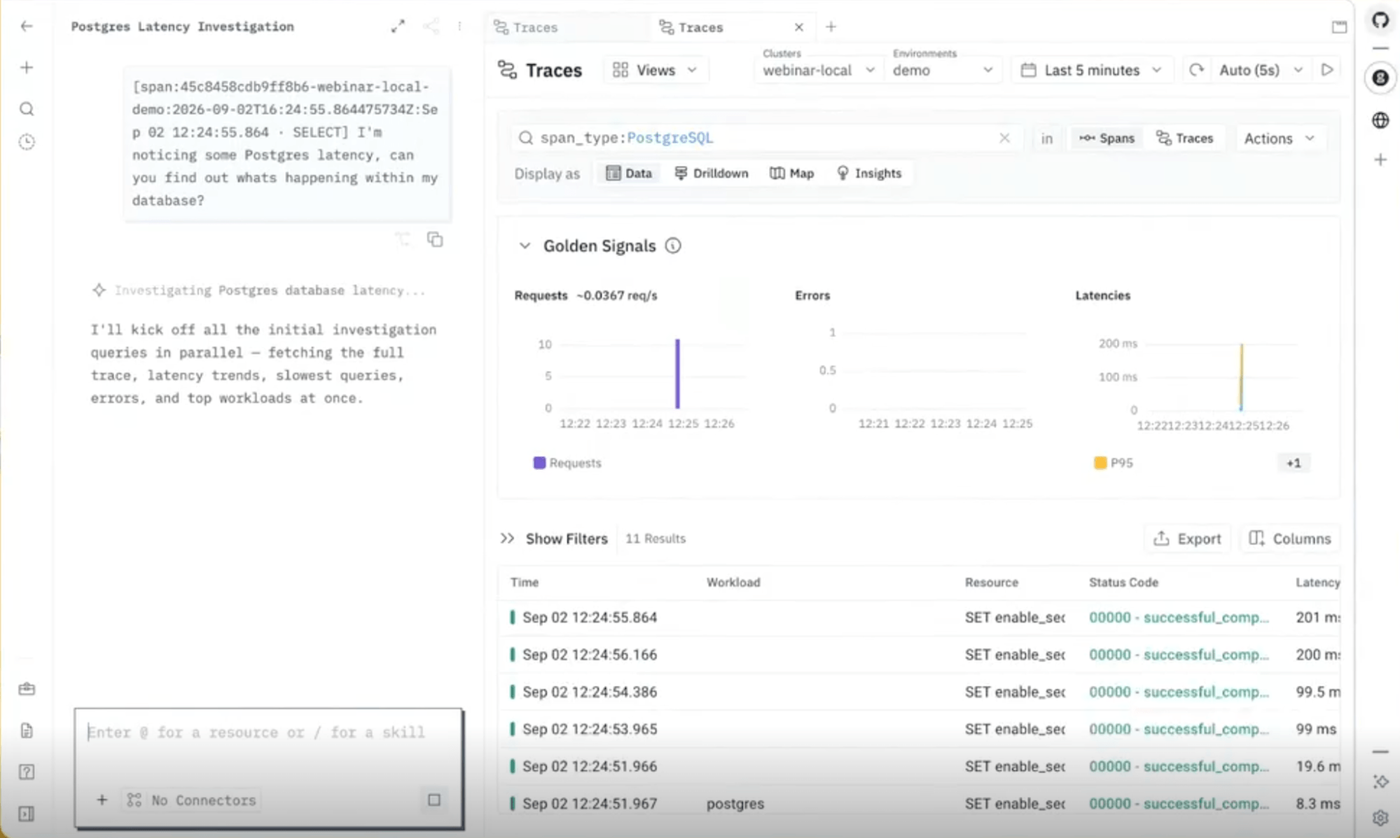
It came back with an accurate analysis.
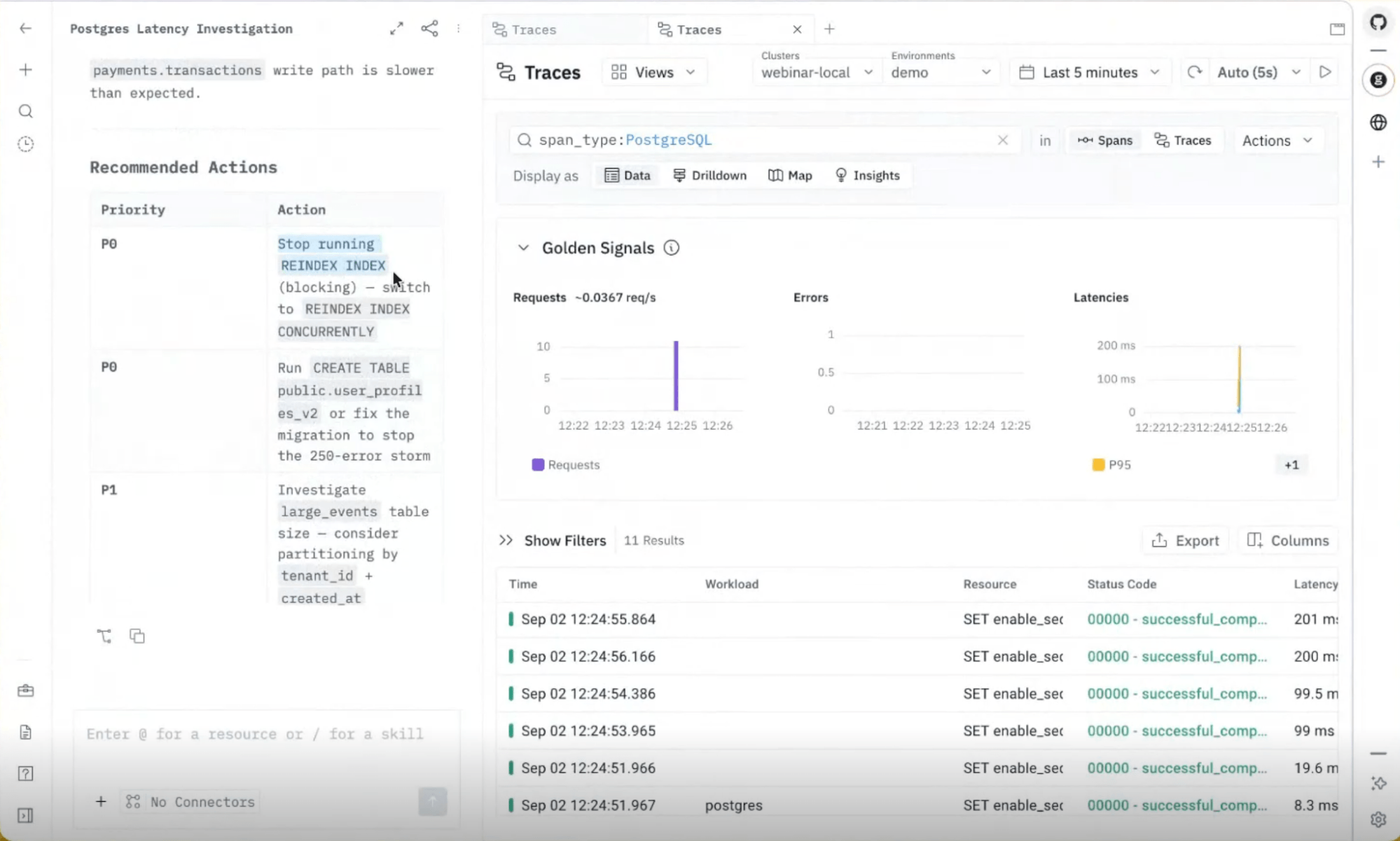
Two things stand out. It found the root cause, and it also found the other problem still running in the cluster and correlated the two, which is exactly the work that takes a human twenty minutes of tab-switching. Furthermore, the agent did that with no additional connectors attached — no codebase, no issue tracker, no runbooks. Just the metrics, traces, and eBPF spans already in the cluster.
Nobody gets a schema right on the first try. Imagine, for example, an e-commerce team is tracking what customers bought but not what they added to a cart and then removed. That removal is some of the most valuable data in the business because it's a customer telling you they wanted the thing and something stopped them, and it's the basis of every "still thinking about this? here's 10% off" campaign that actually works. So you go back and change the schema, and you add indices, and you change indices, and you do it on a table that now has real data in it. Database migrations and indexing are hard. The failure mode in this example isn't uncommon, it's just hard to diagnose. However, that's the part eBPF changes. Nobody has to predict that a migration will half-land or that a rebuild will drag every reader down with it, because the sensor is already recording every statement the database sees, whether it came from an instrumented service or a one-off job someone ran by hand. The evidence is in your trace data before anyone thinks to go looking for it.
Final Thoughts
OpenTelemetry is good at adding business context, application semantics, and the spans you wrote on purpose because you understood the domain. That's real, and eBPF doesn't replace it. What eBPF does is cover all of your services, all the time, with no deployment required, so that when something breaks the observability is already there. Then you use that existing telemetry to decide where to add instrumentation next. Universal coverage on the bottom, deliberate context on top.
One last idea worth taking with you. For a long time, the artifact of a failed investigation was a dashboard. You’d dig through the data, you find the issue, and build a panel so you'd catch it faster next time. That's still useful. But in the first example, the artifact wasn't a dashboard. It was a skill: a saved investigation the agent can rerun, referencing the same queries and the same dashboards, on demand. It found the hot shard on its own, quantified it better than the manual version, and told us which fixes to skip.
That's what we're building toward. eBPF supplying the ground truth, OTel supplying the meaning, and an agent that runs inside your own cloud with access to both.
Check out the next example
I hope this post is helping you to understand the power of eBPF and how it can compliment and enrich your OTel when it comes to grabbing full fidelity telemetry with zero outages. I encourage you to check out the rest of the posts in this series to understand other examples of where eBPF and OTel help make each other stronger. Check out the other examples:
- A slow SQL query caused by one user with a million rows.
- A missing database table.
- A Postgres index rebuild strangling everything around it.
- A payment service quietly regressing after an unsuccessful migration.
If you have any questions about eBPF or groundcover, I encourage you to join our community slack and ask any questions you may have. I also encourage you to give groundcover a try with our playground. Finally, I want to share a link to the corresponding webinar here in case you want to see the recorded demo of these examples all together.