How eBPF Enriches OTel–A slow SQL query caused by one user with a million rows.
Four failure modes where eBPF and OpenTelemetry each answer half the question, and where relying on only one leaves you guessing. Learn how eBPF enriches OTel data for complete observability into your application and services.


The first time you deploy an eBPF sensor onto a cluster you already know well, it feels a little like cheating. You didn't add an SDK. You didn't redeploy anything. You didn't argue with anyone about sample rates. And yet there's a full service map on your screen, with every Postgres call, every DNS lookup, and every HTTP request between services already drawn in.
That's the part people latch onto, and it's fair. But the more interesting question is what you do with that data once you have it, and how it fits next to the OpenTelemetry instrumentation you've already invested in. This post is about that pairing. We ran a webinar walking through four real failures in a live Kubernetes cluster, and in each one the fix came from a piece of evidence that OTel structurally couldn't give us including a bind parameter, a raw SQL statement, an HTTP request body, a container's environment. eBPF has all of it automatically .
A quick definition before we get going. eBPF lets you run small, verified programs inside the Linux kernel. The groundcover sensor is a DaemonSet that loads those programs and attaches them to syscalls, kprobes, and tracepoints, then turns the raw kernel events into spans, metrics, and logs. It sees every socket read and write as it happens, and it uses uprobes to read plaintext before encryption, which is how you get full request and response payloads out of TLS traffic. No SDK, no library import, no code change. It aggregates on the node before anything ships, so you keep control over volume and cost.
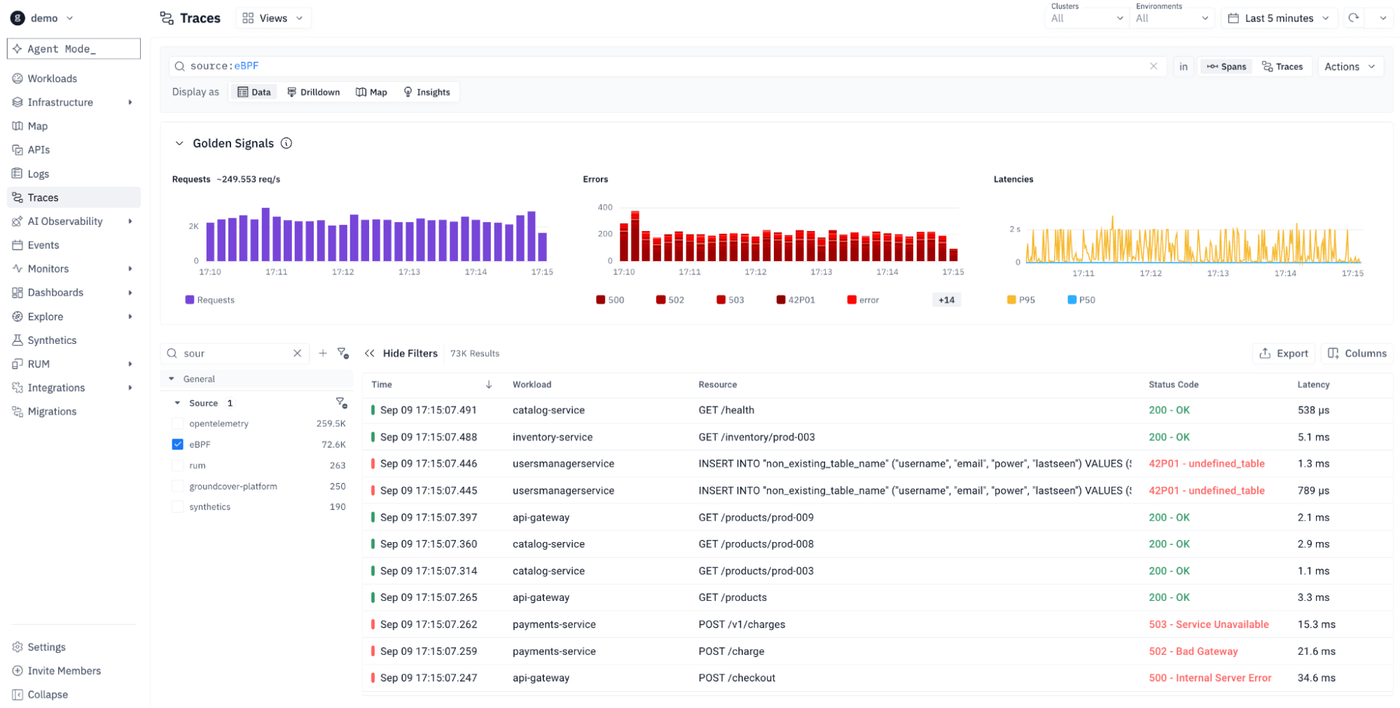
Here's the argument we want to make, and it's not the one people expect. eBPF is not a replacement for OpenTelemetry. Instrument your applications. Keep instrumenting them. eBPF is the layer that's always on underneath, catching the things you never thought to instrument, which means it's also the thing that tells you where to go instrument next. You don't know what you don't know. eBPF is how you find out so you can instrument with OTel more intelligently. Take a look at this Metrics & Labels list for a complete list of everything the sensor collects automatically.
This series of posts will walk through four failures:
- A slow SQL query caused by one user with a million rows.
- A missing database table.
- A Postgres index rebuild strangling everything around it.
- A payment service quietly regressing after an unsuccessful migration.
And this post will focus on the first example. By the end of this series I hope you walk a way with a more centered and practical understanding of why eBPF it feels magical. If you prefer to learn through watching videos you can watch the corresponding webinar here.
A quick tour of groundcover
Before the failures, it helps to know what's on the screenshot below. groundcover runs on your own cloud in a BYOC setup where you manage the data plane. The sensor deploys into your cluster with a Helm install, and from that moment you get APM, log management, infrastructure and Kubernetes monitoring, traces, custom metrics, RUM, synthetics, dashboards, monitors, and events. Because the sensor runs in your cluster, the agent that sits behind the product is your Bedrock instance, and parsing rules let you drop sensitive fields before anything is ingested. That last point matters more than it sounds, and we'll come back to it.
Most of that is standard observability surface area. What we want to focus on is narrower: the specific moments where OTel runs out of road and eBPF keeps going. So for the rest of this post we're staying in Traces, the Map, and the Kubernetes views, and we're chasing four bugs.
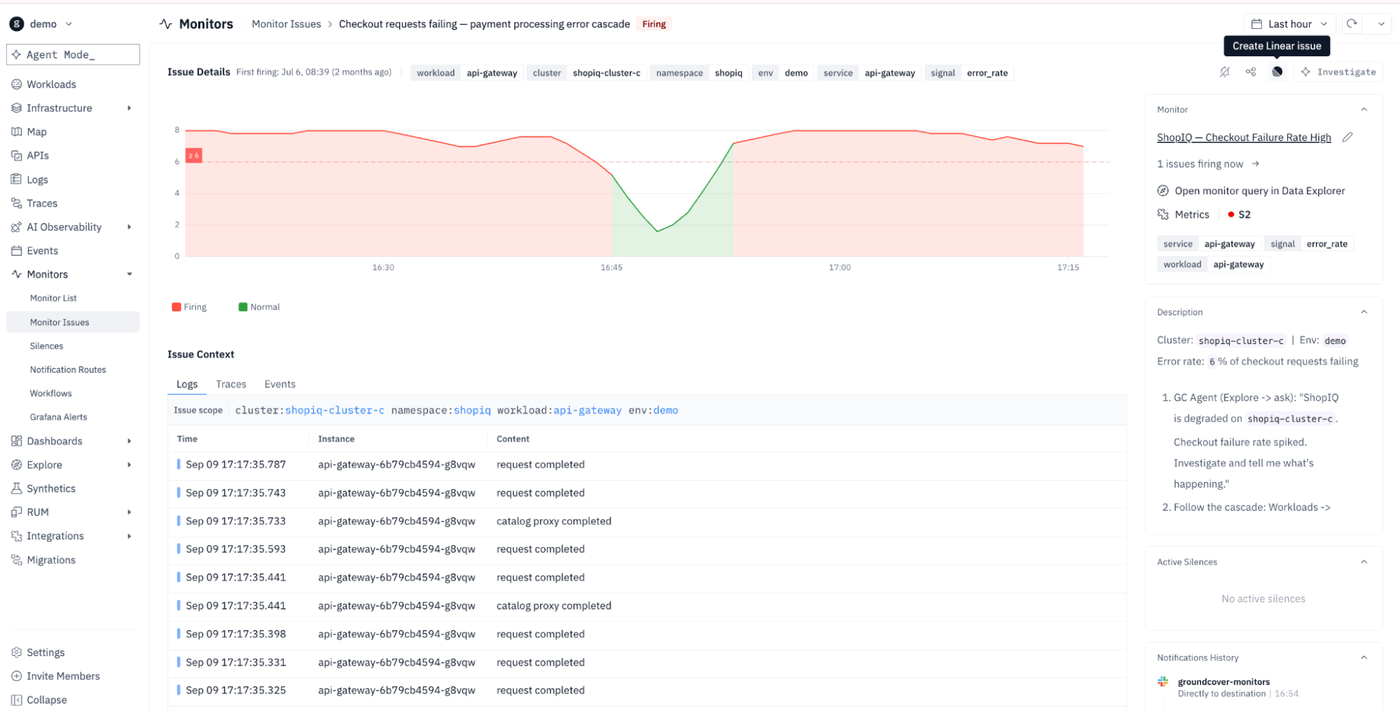
Example one: the slow SQL query that was really one user
The first failure is the kind that makes you doubt your own dashboards. Latency on a Postgres-backed service was spiky, the errors chart was flat at zero, and the query involved looked completely reasonable. The service is message-service, talking to an RDS instance in a production cluster, and the P95 was jumping to around 600ms on a workload that normally sits well under 100ms.
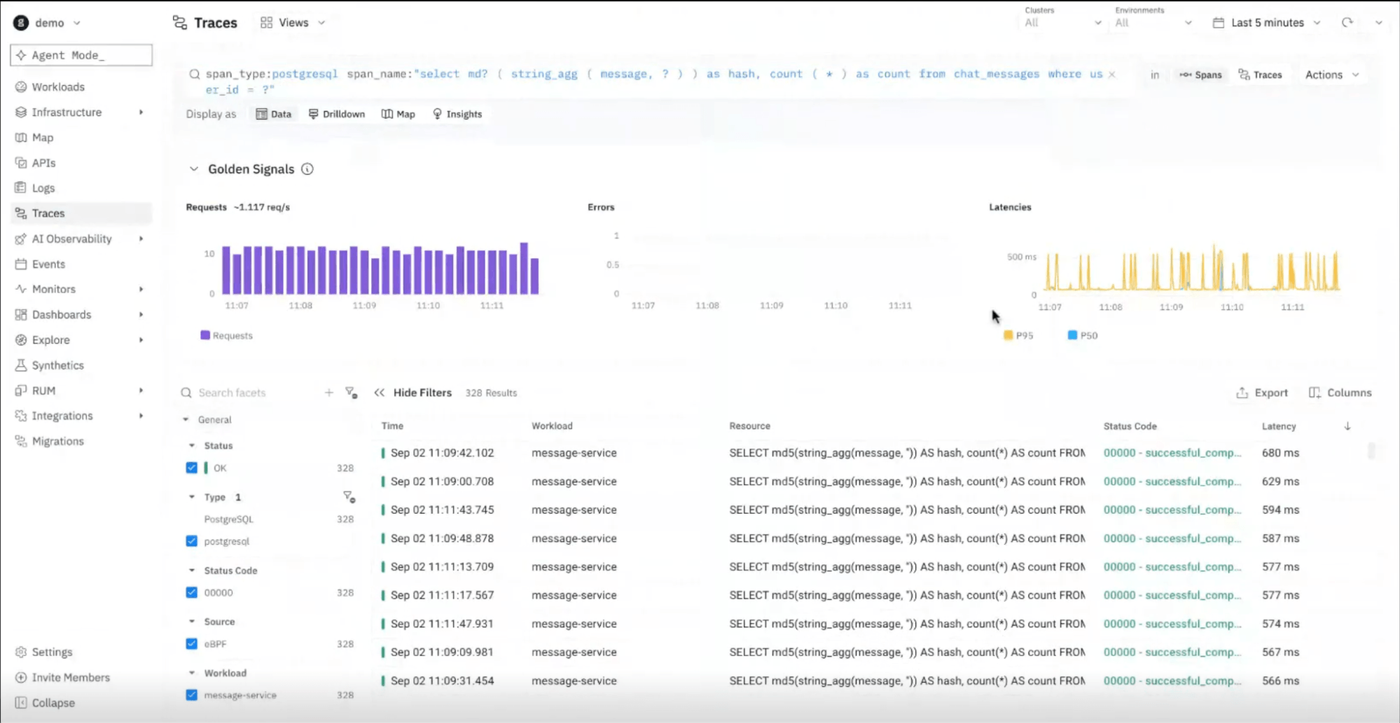
Here's where OTel and eBPF part ways. A well-instrumented OTel client will happily give you the statement text with $1 in it, because that's the prepared statement. What it will not give you is the value bound to $1. Bind parameters are high-cardinality and frequently contain PII, so the OTel semantic conventions leave them out by default, and most database instrumentation libraries follow suit. Which is sensible, right up until the moment the parameter is the bug.
The eBPF span has it, because eBPF read the actual bytes on the wire. Open the span, switch to the Params tab, and there's the user ID.
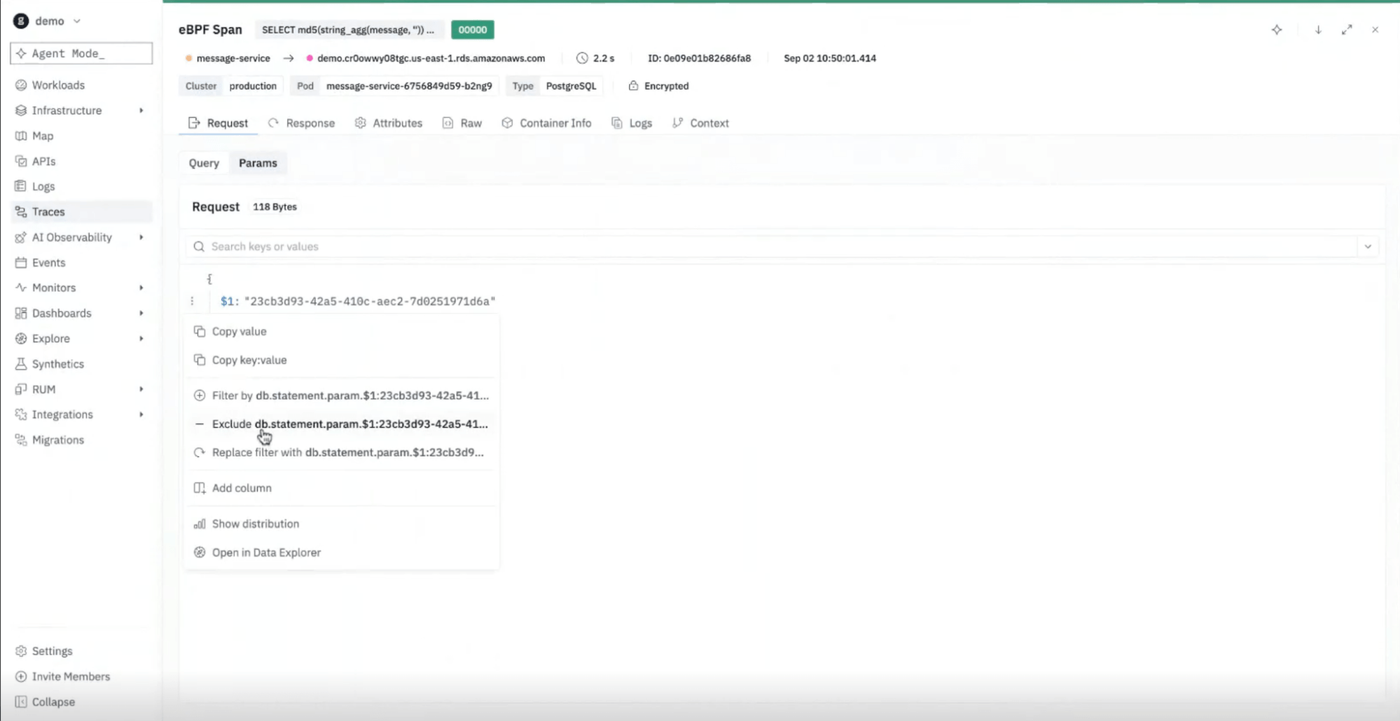
That turns a vague latency chart into a testable hypothesis: what if one user is responsible for most of this? You don't need a code change to test it. Exclude that one parameter value from the query and watch what happens to the chart.
P95 latency for the chat_messages query across all users. Individual spans are landing above a second or two.
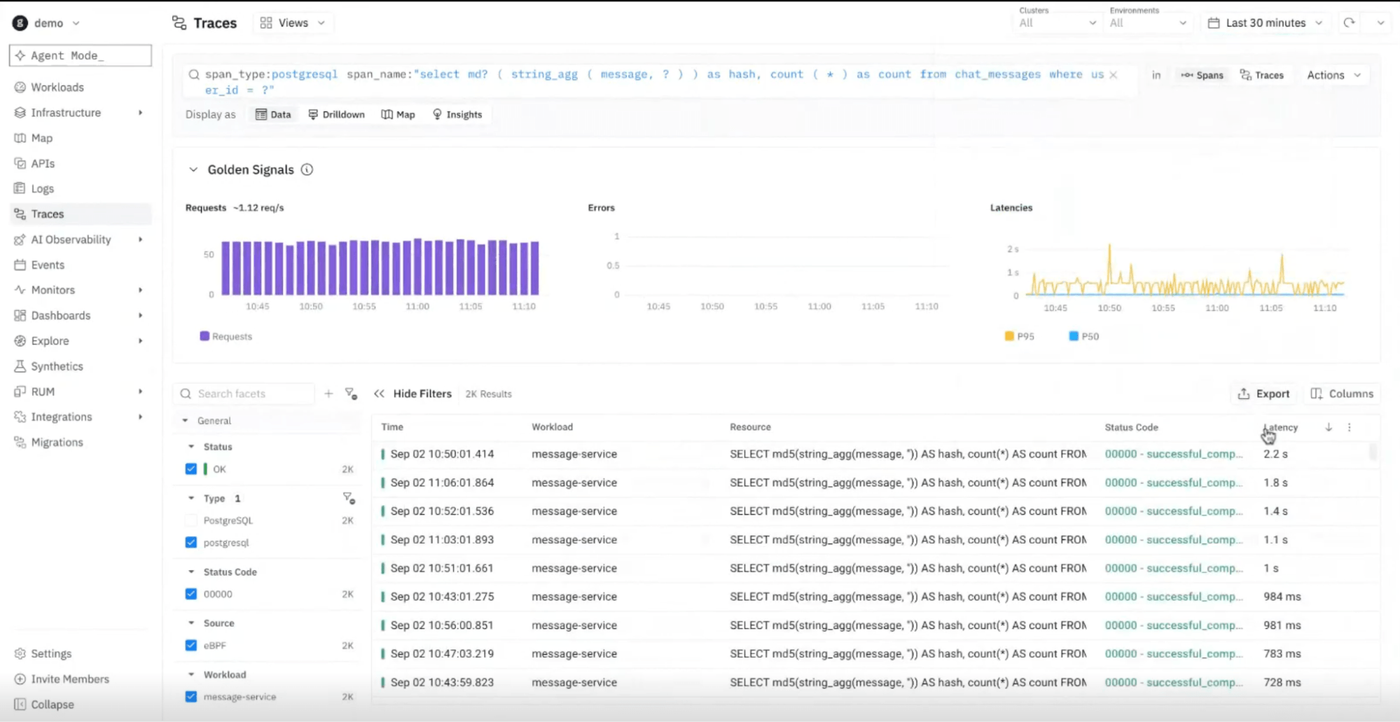
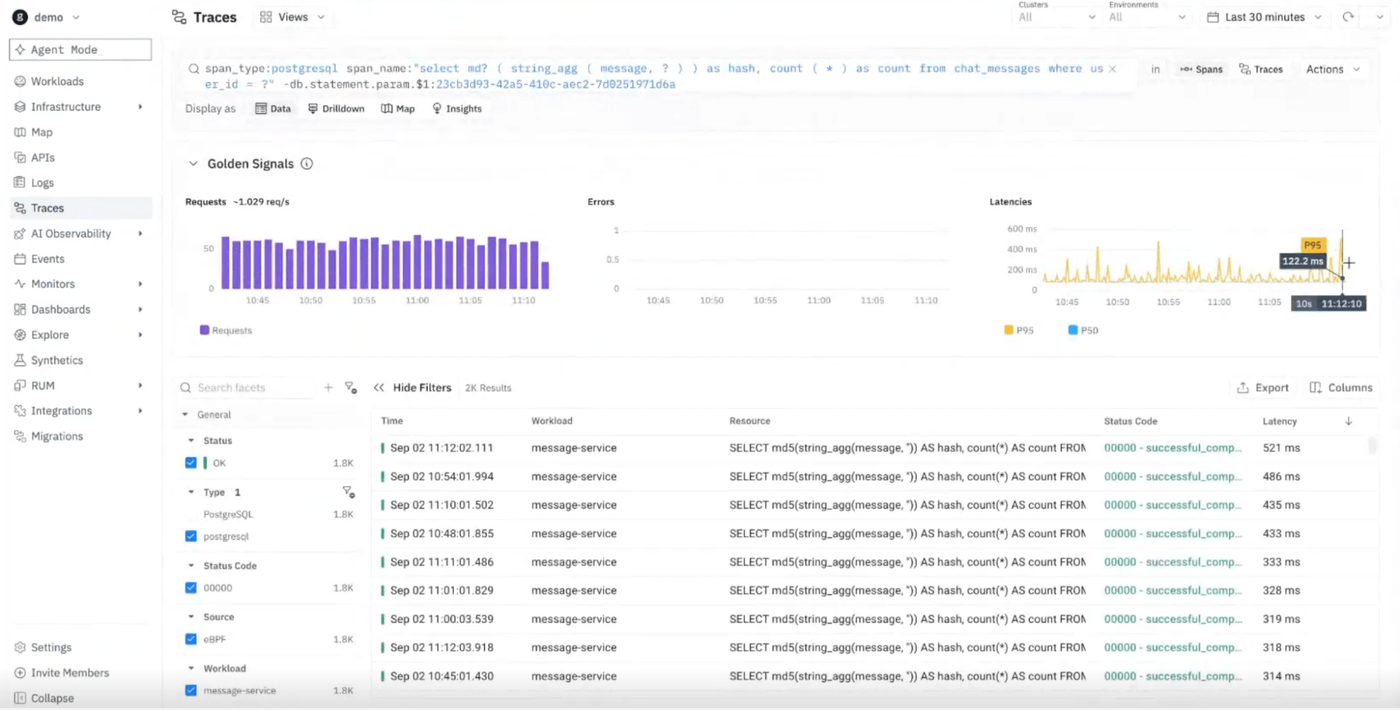
Excluding one user visibly calms the chart, which is a good enough answer for a human but a fairly rough one for a postmortem. So we handed it to the agent. Not as a fresh question — as a saved skill, SQL Sharding Latency Investigation, built from a previous investigation into the same shape of problem.
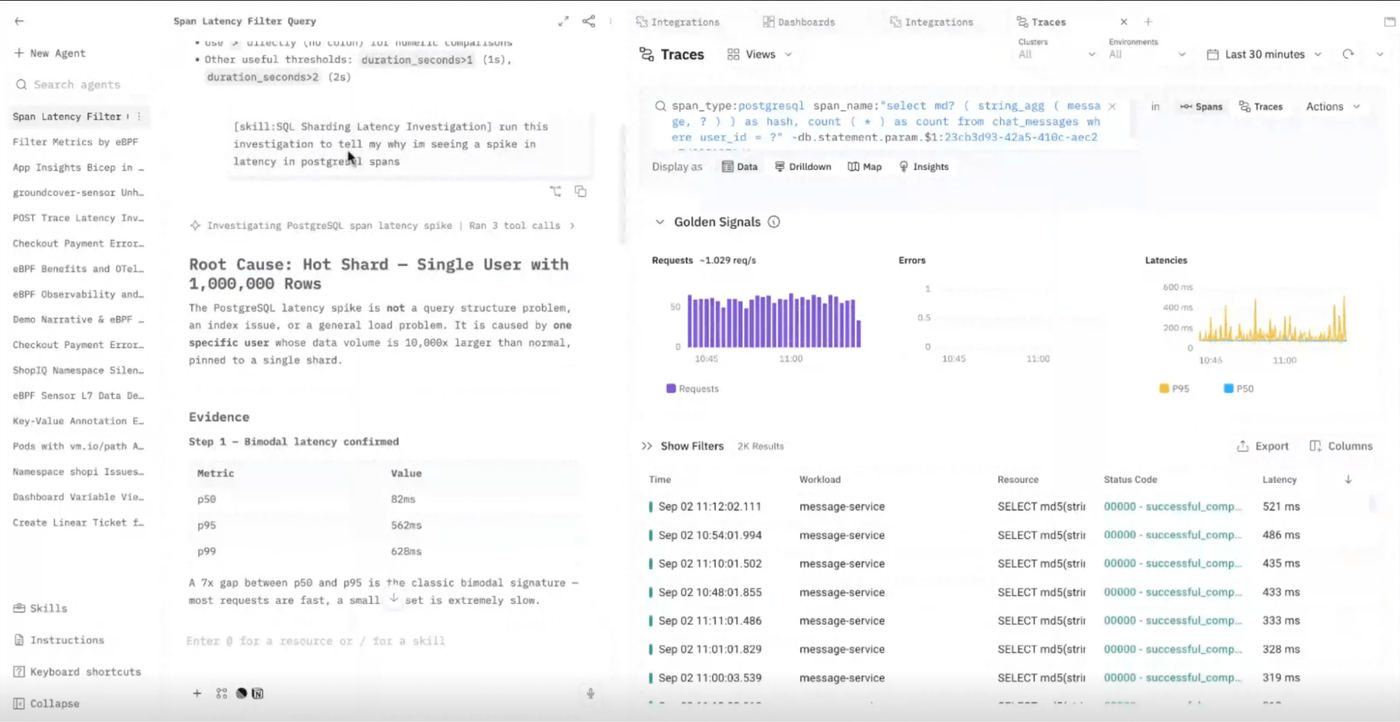
Then it showed the results from more meaningful queries. Instead of a plain count by user, it grouped by response body, sorted by average duration, and decoded what came back.
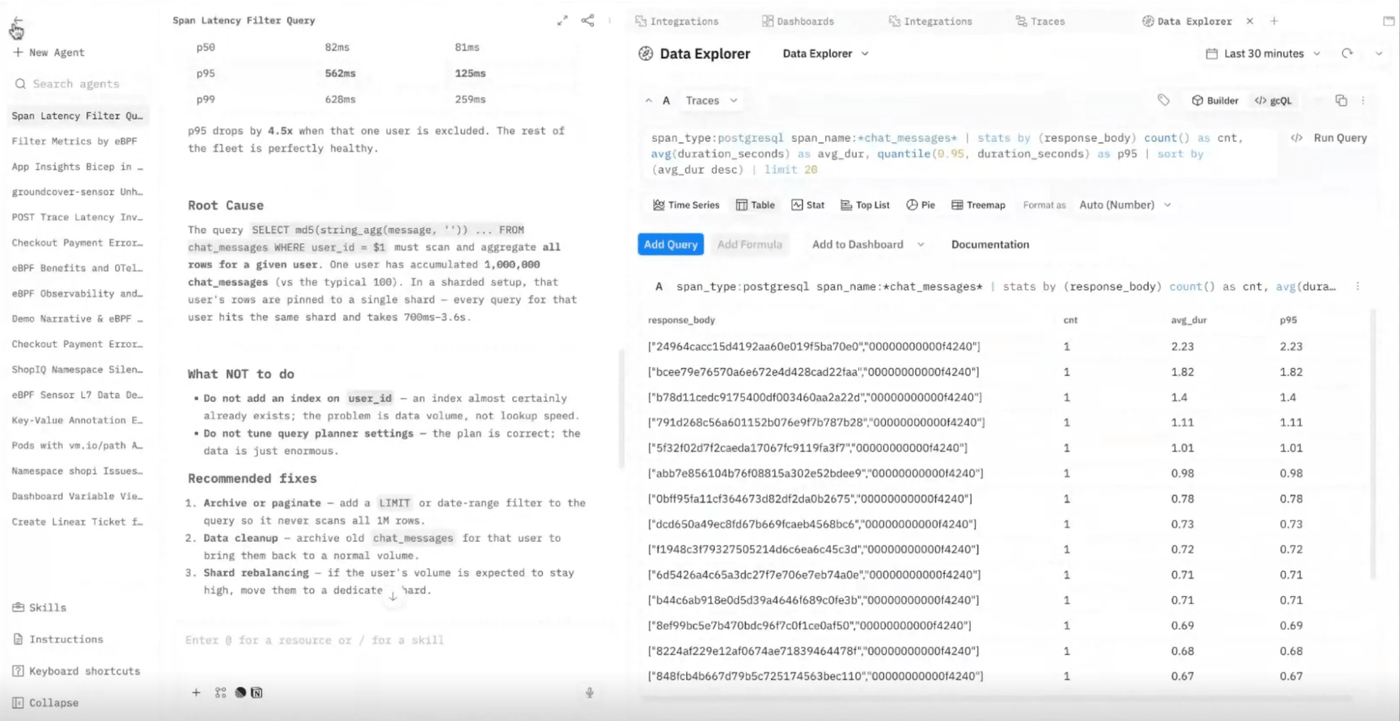
The final numbers: with the hot user included, p50 82ms / p95 562ms / p99 628ms. With that user excluded, p50 81ms / p95 125ms / p99 259ms. A 4.5x improvement at the P95 from one row of data. The agent also flagged what not to do, which is the part I'd have gotten wrong: don't add an index on user_id, because one almost certainly exists and the problem is data volume, not lookup speed. Archive or paginate, clean up the old messages, or rebalance the shard.
None of that investigation is possible without the bind parameter and the response body, and neither of those is in a normal OTel span. The instrumentation was working perfectly. It just wasn't looking at the field that mattered.
Final Thoughts
OpenTelemetry is good at adding business context, application semantics, and the spans you wrote on purpose because you understood the domain. That's real, and eBPF doesn't replace it. What eBPF does is cover all of your services, all the time, with no deployment required, so that when something breaks the observability is already there. Then you use that existing telemetry to decide where to add instrumentation next. Universal coverage on the bottom, deliberate context on top.
One last idea worth taking with you. For a long time, the artifact of a failed investigation was a dashboard. You’d dig through the data, you find the issue, and build a panel so you'd catch it faster next time. That's still useful. But in the first example, the artifact wasn't a dashboard. It was a skill: a saved investigation the agent can rerun, referencing the same queries and the same dashboards, on demand. It found the hot shard on its own, quantified it better than the manual version, and told us which fixes to skip.
That's what we're building toward. eBPF supplying the ground truth, OTel supplying the meaning, and an agent that runs inside your own cloud with access to both.
Conclusion and Part 2
I hope this post is helping you to understand the power of eBPF and how it can compliment and enrich your OTel when it comes to grabbing full fidelity telemetry with zero outages. I encourage you to check out the rest of the posts in this series to understand other examples of where eBPF and OTel help make each other stronger. Check out the other examples:
- A slow SQL query caused by one user with a million rows.
- A missing database table.
- A Postgres index rebuild strangling everything around it.
- A payment service quietly regressing after an unsuccessful migration.
If you have any questions about eBPF or groundcover, I encourage you to join our community slack and ask any questions you may have. I also encourage you to give groundcover a try with our playground. Finally, I want to share a link to the corresponding webinar here in case you want to see the recorded demo of these examples all together.