

Datadog rate limits apply to certain API endpoints, but Datadog does not impose fixed submission-rate quotas on metrics or logs intake. So why does telemetry still go missing? Data can disappear before reaching Datadog when Agent buffers fill, forwarding queues overflow, or DogStatsD drops UDP packets. Tracing SDKs and the Trace Agent can also discard payloads, while sampling rules intentionally exclude traces. These losses can occur without an HTTP 429 response.
This guide explains where Datadog drops or excludes telemetry and how to identify the cause. You’ll learn which Agent metrics, log messages, and sampling settings reveal missing data, how to distinguish rate limiting from collection failures, and what to change to prevent further loss.
Datadog Rate Limits vs. Agent-Side Data Loss
Datadog applies rate limits to specific API operations. For example, event submission allows 250,000 events per minute per organization, while span searches and span aggregation each allow 50 requests per minute per organization. Retrieving a pruned trace by ID allows 60 requests per minute per organization. Limits can apply per organization, user, or API key, and some operations share a rate-limit bucket.
When a request exceeds its API rate limit, Datadog returns HTTP 429 with headers showing the applicable limit and when it resets. For example:
Here, the limit is 100 requests per 60 seconds, with no requests remaining and 30 seconds until it resets. X-RateLimit-Name identifies the rate-limit bucket. Wait for the reset before retrying. You can also use the API Rate Limit Visibility dashboard to investigate throttled requests, although its usage metrics exclude metric, log, and event submission.
The metrics submission API and logs intake API can return HTTP 429, but neither has a documented fixed submission-rate quota. If an intake request receives 429, retry it according to the response. A 429 from a span-search request, however, means the query was throttled, not that traces were dropped during ingestion.
The Trace Agent, the component of the Datadog Agent that receives application traces and forwards APM payloads, enforces separate connection, CPU, and memory limits. For example, http.Server: http: Accept error: request has been rate-limited indicates that the local APM connection limit was exceeded. This limit defaults to 2,000 connections and can be adjusted through apm_config.connection_limit or DD_APM_CONNECTION_LIMIT. Full forwarding queues and dropped UDP packets can also cause data loss without an HTTP 429 response, making the source of the error more useful than the word rate-limited alone.
Where Metrics and Traces Get Dropped Before Ingestion
Metrics and traces can disappear at different stages of collection and forwarding. The metrics forwarder, Trace Agent, and application tracing libraries use separate queues and retry mechanisms. Changing one component’s buffer settings will not resolve data loss in another.
Metrics Forwarder Retry Buffers
When the Datadog Agent cannot forward metrics because of a network failure or an intake error, it compresses failed payloads and stores them in an in-memory retry buffer. The buffer is limited to 15 MB by default, controlled by forwarder_retry_queue_payloads_max_size. Failed requests are retried with exponential backoff, starting at 2 seconds and increasing to a maximum of 64 seconds. Without disk buffering, metrics can be dropped when the memory buffer fills. An Agent restart also discards payloads that remain in memory.
Starting with Agent 7.27.0, you can enable disk buffering by setting forwarder_storage_max_size_in_bytes to a positive value. When the memory buffer fills, older payloads move to disk, while newer payloads receive priority during retries. The disk buffer has a default capacity of 2 GB and stops accepting additional payloads when its configured capacity is exhausted or overall disk usage reaches the default 80% threshold. Unlike in-memory payloads, disk-buffered metrics survive an Agent restart, although a prolonged outage can still exhaust the available capacity.
Trace Agent Receiver Limits and Retry Queues
The Trace Agent uses separate in-memory queues for failed APM payloads. It compresses payloads and retries network failures, HTTP 408 responses, and HTTP 5xx responses with backoff between 2 and 10 seconds. If forwarding remains blocked until the queues fill, payloads are dropped. The metrics forwarder’s disk buffer does not protect these traces, so increasing forwarder_retry_queue_payloads_max_size will not resolve a full Trace Agent queue.
Traces can also be rejected before entering the forwarding queue. In non-Kubernetes environments, the Trace Agent’s default CPU limit is 50% of one CPU core. When it reaches its configured CPU threshold, incoming payloads can be refused until usage falls. Memory exhaustion can terminate the Trace Agent, producing Memory threshold exceeded and OOM messages. You can distinguish these conditions by checking Agent logs, datadog.trace_agent.receiver.ratelimit, and the Limited Resource indication in APM Ingestion Controls. The relevant limits can be adjusted through the Trace Agent configuration.
Older Agent versions could also drop OpenTelemetry Protocol (OTLP) spans when the receiver’s processing channel was full. With Agent 7.50.3, an affected OTLP configuration produced Payload in channel full. Dropped 1 payload. Setting DD_APM_TRACE_BUFFER=16 stopped the drops in that configuration. Starting in the 7.52 release line, the receiver instead applies backpressure when its channel fills and limits concurrent requests to control memory usage. If you encounter the same warning, check the Agent version before applying a buffer workaround intended for an older receiver.
Application-Side Tracer Payload Drops
The Agent can be healthy while an application’s tracing library discards payloads before sending them. Application tracers maintain their own writers, connection limits, and buffers, so missing traces do not always originate in the Trace Agent. Checking application tracer logs alongside Agent logs helps establish whether the spans were transmitted.
The warning Maximum number of active requests reached: payload is discarded indicates that the Node.js tracer has discarded a payload before it reaches the Agent. It appeared in an issue involving dd-trace-js 5.46.0 and Agent 7.64.1, where traces stopped arriving after approximately one minute. If you encounter this warning, check tracer debug logs, connectivity to the Agent, and your installed tracer version before changing Agent forwarding settings.
DogStatsD Packet Loss and UDP Buffer Limits
DogStatsD receives custom metrics over UDP port 8125 by default. When applications send metrics faster than the Agent can process incoming datagrams, the operating system’s socket receive buffer can fill and discard packets before DogStatsD reads them. UDP does not acknowledge delivery, so these drops happen without an HTTP error and the lost metrics never reach the Agent’s retry buffers. If dogstatsd_so_rcvbuf is unset or zero, the socket uses the operating system’s default receive-buffer size rather than a zero-byte buffer.
On Linux, check for receive-buffer errors while metric traffic is high:
Run the command twice and look for an increase in receive buffer errors under UDP. A rising count indicates UDP receive-buffer overflow, but the counter covers all UDP sockets in the network namespace. Check the DogStatsD listener on port 8125 before attributing those drops to it. Client-side packet-drop metrics cannot detect packets discarded by the kernel after a UDP send.
You can increase the socket buffer by raising the Linux net.core.rmem_max limit and configuring dogstatsd_so_rcvbuf in the Agent. For high-throughput workloads, Datadog’s recommended configuration uses a 25 MiB buffer. First, increase the operating system limit:
Then configure the Agent to request the larger buffer:
Persist the kernel setting if it needs to survive reboots. In Kubernetes, confirm that your deployment permits the required socket buffer configuration. Raising only the kernel limit does not make DogStatsD request a larger buffer, so both settings matter.
You can further reduce UDP pressure by batching multiple metrics into each datagram instead of sending one metric per packet. Keep datagram sizes within supported limits to avoid fragmentation. For applications running on the same Linux host as the Agent, DogStatsD over Unix Domain Sockets (UDS) avoids the UDP network path and provides error reporting when sends fail, although UDS buffers can also fill.
DogStatsD has a separate internal processing queue controlled by dogstatsd_queue_size. Its default value of 1,024 can consume approximately 768 MB of memory under heavy traffic. Increasing the queue can absorb larger bursts but raises memory usage, while reducing it saves memory at the cost of more potential packet drops. This queue is separate from the kernel’s socket receive buffer, so increasing it cannot recover UDP packets already discarded by the operating system. To identify unusually high metric volume, enable DogStatsD processing statistics with dogstatsd_stats_enable: true and run datadog-agent dogstatsd-stats. The command shows which metrics DogStatsD processes most frequently, not packets discarded by the kernel.
APM Sampling vs. Dropped Traces
A missing trace does not always mean the Trace Agent lost it. Datadog can exclude traces through sampling, reject payloads when the Agent encounters resource or forwarding problems, or ingest spans without retaining them for historical searches. Identifying which stage removed the data determines what you need to fix.
Datadog uses head-based sampling by default, targeting approximately 10 traces per second across services connected to each Agent. The Agent continuously adjusts sampling rates sent to Datadog tracing SDKs to meet this target, which is not a hard cap and does not control OpenTelemetry SDK sampling. When you configure custom sampling rules in a Datadog tracing library, those rules override the Agent’s automatic sampling rates. The library then applies a default limit of 100 traces per second per service instance, configurable through DD_TRACE_RATE_LIMIT. These sampling decisions occur at the beginning of a trace and are propagated through the request context, so excluded requests are not evidence of a forwarding failure.
The Trace Agent can also retain additional error traces at up to 10 traces per second per Agent and rare traces at up to 5 traces per second per Agent. Rare sampling is disabled by default starting with Agent 6.41.0/7.41.0, and neither sampler applies to services with user-defined library sampling rules. These mechanisms can retain local portions of distributed traces rather than complete traces. You can inspect active rules and traffic excluded by each mechanism in APM Ingestion Controls.
To distinguish sampling from Agent-side loss, inspect these Trace Agent metrics alongside CPU usage, memory pressure, receiver errors, and application traffic over the same period:
Traces can also reach Datadog without appearing in historical Trace Explorer searches. Retention filters determine which ingested spans remain indexed and searchable. When a request is missing, distinguish traces excluded before ingestion, payloads lost during processing or forwarding, and spans that were ingested but not retained for search. You can reduce Datadog costs by adjusting trace sampling, log indexing exclusions, and custom-metric tag cardinality. These changes also affect which telemetry remains available during an incident. See Datadog Pricing Explained for the pricing implications.
Logs Agent Backpressure and Missing Logs
Missing logs can originate in the Agent’s collection pipeline or in Datadog’s ingestion and indexing configuration. File-tailed logs, TCP and UDP inputs, and container logs handle interruptions differently. Even when collection succeeds, exclusion filters, quotas, and timestamp problems can prevent logs from appearing in searches.
When Log Collection Falls Behind
The Logs Agent uses backpressure when it cannot deliver file-tailed logs to Datadog. It pauses reading and resumes from its recorded file offset after forwarding recovers. This delays logs rather than immediately discarding them, but unread data can still be lost if files rotate or are removed before collection resumes. TCP and UDP log inputs rely on bounded buffers, so new events can be lost when those buffers fill. Container logs can also disappear if their source is removed before collection resumes.
File rotation creates another risk. After detecting rotation, the Agent continues reading the old file for 60 seconds by default. If unread content remains when logs_config.close_timeout expires, the Agent closes the file and loses those bytes. The Agent can record a warning beginning with After rotation close timeout, and datadog.agent.logs.bytes_missed counts the unread bytes lost from rotated files. Increasing the timeout gives the Agent more time to finish reading, but keeps rotated files open longer without resolving the underlying forwarding or processing delay.
For Agent 7.82.0 and later, the Logs Agent Backpressure section of datadog-agent status shows which pipeline stages are saturated. A saturated destination or sender points toward delivery problems, while saturation in the processor or batching strategy points toward local processing constraints. Compare this information with rotation warnings and bytes_missed before deciding whether to fix delivery, increase processing capacity, or adjust the rotation timeout.
When Logs Are Collected but Not Searchable
Logs can reach Datadog without remaining searchable in Log Explorer. Before treating an empty search result as Agent-side loss, check indexing exclusions, quotas, timestamps, and access permissions.
You can use datadog.estimated_usage.logs.ingested_events with the datadog_is_excluded tag to investigate indexing exclusions. However, estimated usage metrics do not account for daily index quotas, so a healthy ingestion count does not establish that every event is searchable. Review log index configuration alongside the Agent’s collection metrics before concluding where the logs disappeared.
Logs above 1 MB are truncated rather than discarded. If part of a log message is missing, check datadog.estimated_usage.logs.truncated_count for the affected service instead of treating it as a complete ingestion failure.
How to Detect and Fix Missing Datadog Telemetry
When metrics, traces, or logs disappear, compare the affected period with application traffic, Agent status, and collection errors. Identify where the data was lost before changing sampling rules, buffer sizes, or forwarding settings.
On a Linux host running the Datadog Agent, start with:
Apply one change at a time and verify the result under representative traffic.
Missing Metrics
DogStatsD UDP packet loss: If custom metrics show gaps during traffic spikes, confirm that they are sent through DogStatsD over UDP. Check whether netstat -su receive-buffer errors increase during the affected workload, then verify that the DogStatsD listener is responsible. After adjusting the socket buffer or client-side batching, repeat the workload and confirm that the errors stop increasing.
Forwarder retry-queue loss: If metrics disappear during network failures, check Agent logs for failed requests, retries, and buffer-exhaustion errors. Confirm connectivity to the configured intake endpoint. Increase retry capacity or enable disk buffering if needed, then verify that the next interruption does not exhaust the available buffer.
High-cardinality metric tags: Per-request identifiers such as requestId and transactionId can create large numbers of distinct metric series. If these metrics are missing, check the integration’s submission responses and verify whether the series reached Datadog. A Gravitee integration issue describes this symptom, although its underlying cause was not established.
Missing metric tags: If a metric exists but a tag is unavailable for filtering or grouping, check its Metrics without Limits configuration in Metrics Catalog. Restore the required tag to the indexed configuration rather than changing Agent buffer settings.
Missing Traces
Open APM Ingestion Controls for the affected service and inspect its Traffic Breakdown. If sampling or SDK rate limiting explains the missing requests, adjust the relevant ingestion controls. A Limited Resource indication points toward an Agent resource constraint, while healthy ingestion with missing historical search results calls for checking retention filters.
For suspected Agent-side loss, compare datadog.trace_agent.receiver.spans_dropped, datadog.trace_agent.trace_writer.queue_fill, and datadog.trace_agent.trace_writer.dropped over the affected interval. Correlate changes with CPU usage, memory pressure, Agent restarts, and connection errors. Investigate the receiver when local connection or resource limits are reached, and investigate forwarding when queue occupancy remains high or writer-drop counts increase.
If the Agent appears healthy but traces stop arriving, check the application’s tracer logs and installed tracer version. An application-side writer limit requires different changes from a Trace Agent forwarding failure. For OTLP ingestion, verify the Agent version before applying buffer workarounds associated with older receivers.
Repeat the affected workload after the fix and confirm that unintended drop counters stop increasing and the writer queue recovers. Do not require receiver.payload_refused to remain at zero because sampling can legitimately increment it.
Missing Logs
For file-tailed logs, compare After rotation close timeout warnings with datadog.agent.logs.bytes_missed during the affected period. On Agent 7.82.0 and later, check the Logs Agent Backpressure section of datadog-agent status to find the saturated pipeline stage. Resolve that constraint before increasing logs_config.close_timeout when additional file-reading time is needed.
If collection appears healthy, check index exclusion filters, daily quotas, role restrictions, and the Log Explorer time range. Use datadog.estimated_usage.logs.drop_count for stale timestamps and datadog.estimated_usage.logs.truncated_count when oversized messages appear incomplete.
Verify the fix by generating identifiable log entries under representative volume and confirming they appear in the expected index and time range. Check that no new rotation warnings occur and that bytes_missed stops increasing.
How groundcover Collects and Retains Telemetry
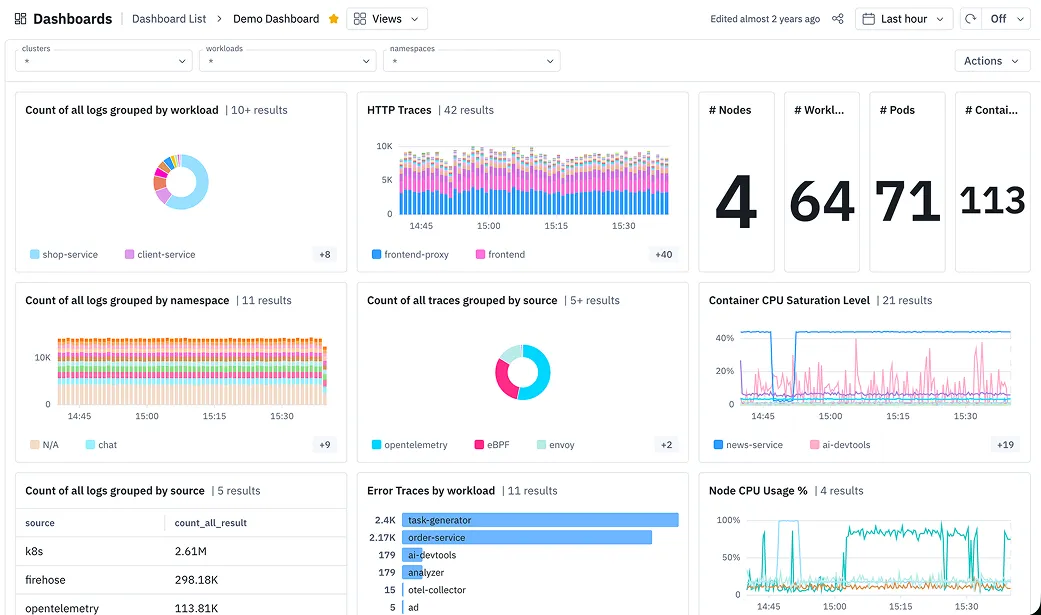
groundcover gives you another way to collect application telemetry without depending on tracing SDKs across every service. Its eBPF sensor automatically captures application and network activity, while OpenTelemetry ingestion lets you retain existing instrumentation. With Bring Your Own Cloud (BYOC), telemetry processing and storage run inside your cloud environment.
Collect Application and Infrastructure Telemetry With eBPF
The groundcover eBPF sensor runs as a Kubernetes DaemonSet, with one sensor pod on each monitored node. Through eBPF auto-instrumentation, it captures HTTP, gRPC, and database requests without requiring changes to your application code. The sensor associates this activity with Kubernetes workloads and collects container logs, infrastructure metrics, and Kubernetes events, so you can investigate slow requests and errors alongside the pods and services involved.
You can combine sensor-generated telemetry with existing OpenTelemetry instrumentation. Applications and Collectors can export logs, metrics, and traces through OTLP, allowing you to investigate internal application operations alongside eBPF request telemetry and infrastructure activity.
Control Trace Sampling and Retention
groundcover’s eBPF sensor processes observed request traffic and uses smart sampling to select detailed traces for storage. It prioritizes errors, unusually high or low latency, and representative requests for each resource. Application measurements continue to account for observed traffic, while stored traces preserve details that help you investigate failures and performance changes.
You can also force sampling for selected HTTP/gRPC requests using the x-groundcover-force-sample header or for entire pods and namespaces through Kubernetes labels. This gives you detailed traces for the workload you’re investigating without changing the sampling policy across the cluster.
The differences between Datadog and groundcover are:
Migrate From Datadog Without Rebuilding Your Monitoring Setup
You can evaluate groundcover while continuing to use Datadog. The Datadog Agent integration supports dual-shipping traces, APM metrics, custom metrics, and profiles to both platforms. You can compare the telemetry collected for the same workloads, verify application visibility, and check your existing monitoring requirements before switching.
The Datadog migration tool discovers dashboards, monitors, and data sources through the Datadog API. It translates metric names, labels, and queries into groundcover equivalents while preserving dashboard layouts, alert conditions, thresholds, and evaluation windows where applicable. You can preview converted dashboards, connect the required data sources, and migrate monitors and dashboards individually or in bulk.
FAQs
Contact Datadog Support to request an increase for the affected API endpoint. Include the endpoint, current X-RateLimit-* response headers, and expected request volume. Datadog can increase API rate limits on request, but approval is not automatic.
The Datadog Terraform provider retries HTTP 429 and 5xx responses by default, with three retries and a 60-second timeout. To adjust these settings, add http_client_retry_max_retries = 5 and http_client_retry_timeout = 120 to your provider "datadog" block. Keep http_client_retry_enabled = "true" and reduce Terraform parallelism if concurrent requests continue to trigger throttling.
The v2 metrics submission API accepts payloads up to 512,000 bytes (500 KB), while compressed payloads must decompress to less than 5 MiB. Metric timestamps cannot be more than 10 minutes in the future or one hour in the past.
Yes. DogStatsD can lose UDP packets when socket receive buffers fill, while the Metrics Forwarder and Trace Agent can discard payloads when retry queues are exhausted. Application tracing libraries can also drop payloads before sending them to the Agent. These failures can occur without an HTTP 429 response from Datadog’s intake API.
Sampling intentionally excludes traces according to configured rules, while Agent-side loss occurs when collection, processing, or forwarding fails. Check APM Ingestion Controls for sampling decisions and datadog.trace_agent.receiver.spans_dropped or datadog.trace_agent.trace_writer.dropped for Agent-side drops.
groundcover uses eBPF to automatically capture application requests without requiring tracing SDKs in every service. Its smart sampling prioritizes errors, unusual latency, and representative requests, while force sampling lets you retain detailed traces for selected workloads. You can also ingest existing OpenTelemetry data and keep telemetry processing and storage in your own cloud environment through BYOC.
Run datadog-agent status and inspect Agent logs. For DogStatsD metrics, check UDP receive-buffer errors. For traces, inspect APM Ingestion Controls and Agent drop counters. For logs, check collection backpressure, datadog.agent.logs.bytes_missed, and indexing configuration.