


Weekly updates on new features, improvements, and fixes across groundcover.

Agent assisted OTTL rules and Dashboard improvements
September 10, 2026
The agent can now write OTTL rules for you to help you parse, drop, or obfuscate traces. Dashboards got easier to navigate and easier to read, starting with favorites and pinning for anyone whose dashboard list has gotten out of hand. Underneath both, a new ingestion service and a standby ClickHouse cluster.
groundcover Agent now writes OTTL rules in addition to log rules
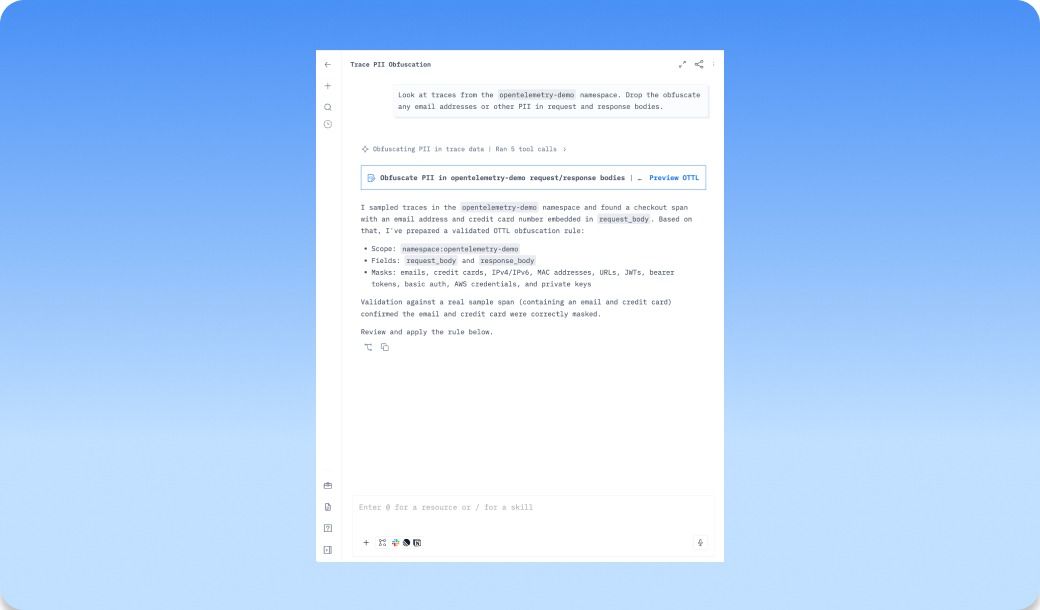
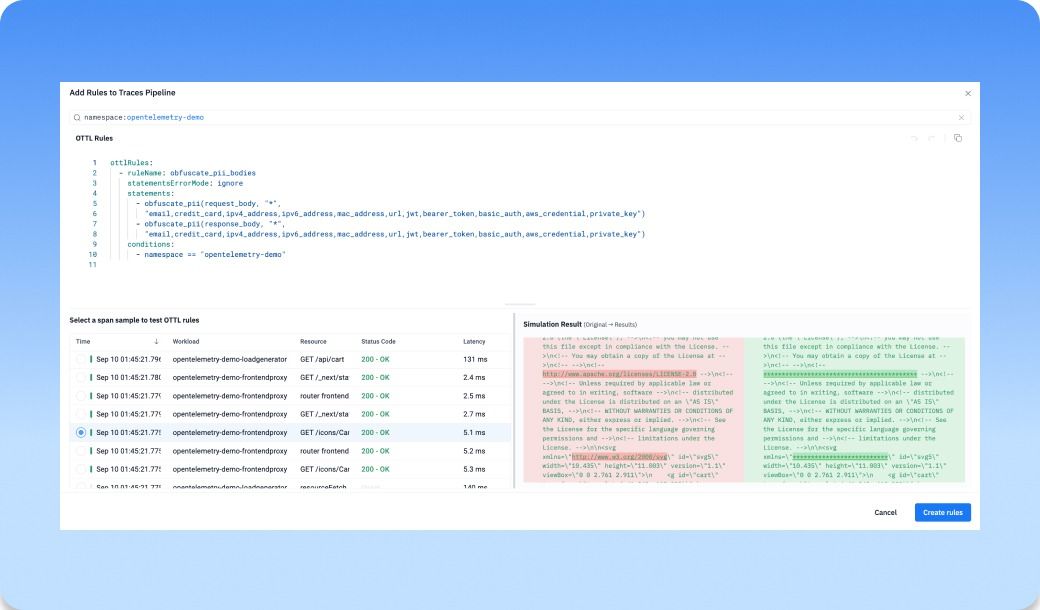
The groundcover agent now writes OTTL rules and shows you the diff on real data. This feature is an extension of the functionality that already exists for logs, enabling you to use the Agent to write new rules which parse, enrich, drop or obfuscate traces.
For example, a span carrying a customer email in a request body needs to be obfuscated. Alternatively, the health-check traffic is no longer being utilized and it needs to be dropped. Now you can ask the agent in plain language to “drop health-check spans for this workload”, “mask emails in request bodies”, or “turn these spans into a counter”. It writes the OTTL and hands you a preview before creating anything. It returns the GCQL query it used to find matching spans, the rules it generated, real sample spans from your data, and result diffs for each one. Every rule is validated against actual spans first, so a rule that doesn't compile never makes it to the preview.
Pin your favorite dashboards
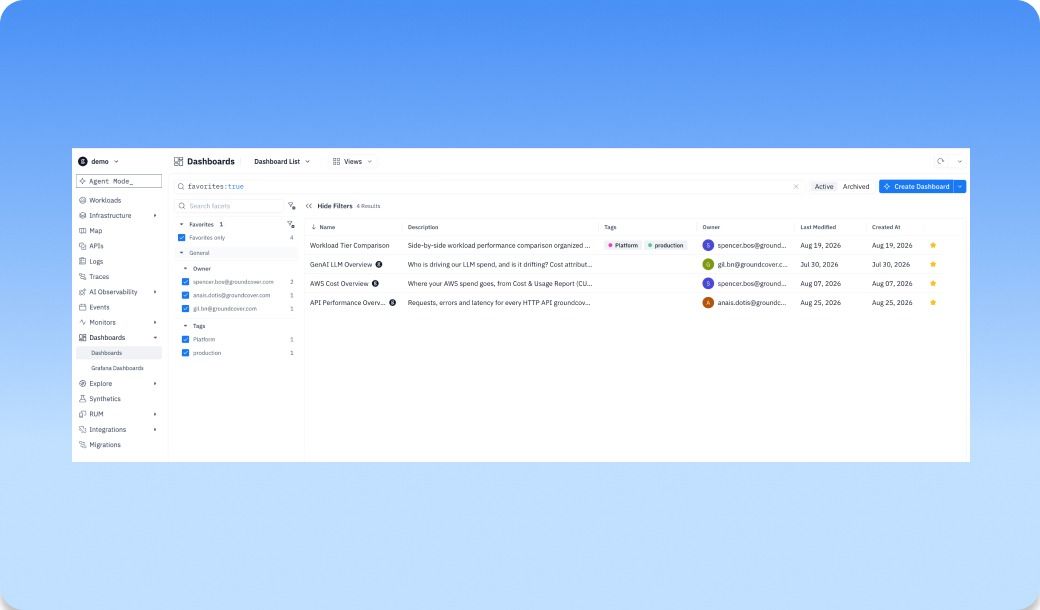
We’ve added the ability to star and pin dashboards to help you find the most important ones. Pin one and it lands in the left nav, for quick access. You can also star a dashboard as favorite and filter for them. Both of these actions are per use. If you have a monitoring dashboard you live in, it now behaves like a dedicated page instead of something you go hunting for.
Dashboards also got improvements to widgets including a rebuilt text widget and more control over what charts show. Specifically, the improvements include;
- Each query in a time series can also carry its own color palette, overriding the widget default. This is useful when two related series come out in near-identical shades and you can't tell which line is which.
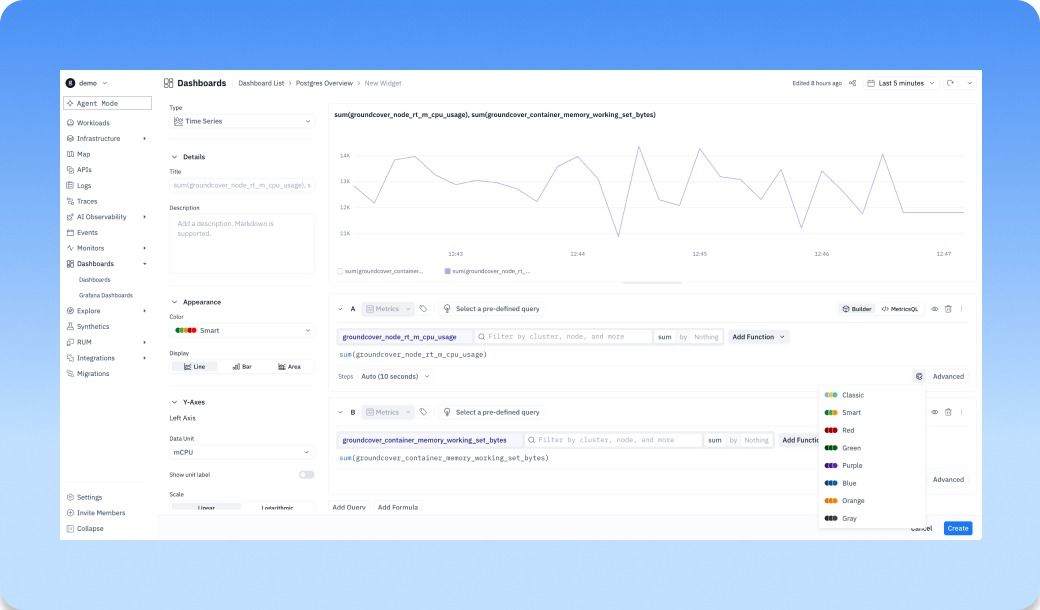
- The text widget is now a proper markdown editor with a real edit mode and an explicit save. You get background and font colors from the same palette sections used,.
- Hide individual queries from a widget's display.
- Add a formula and the underlying queries are hidden by default, as before, but you can now show them alongside the formula result instead of choosing between the two.
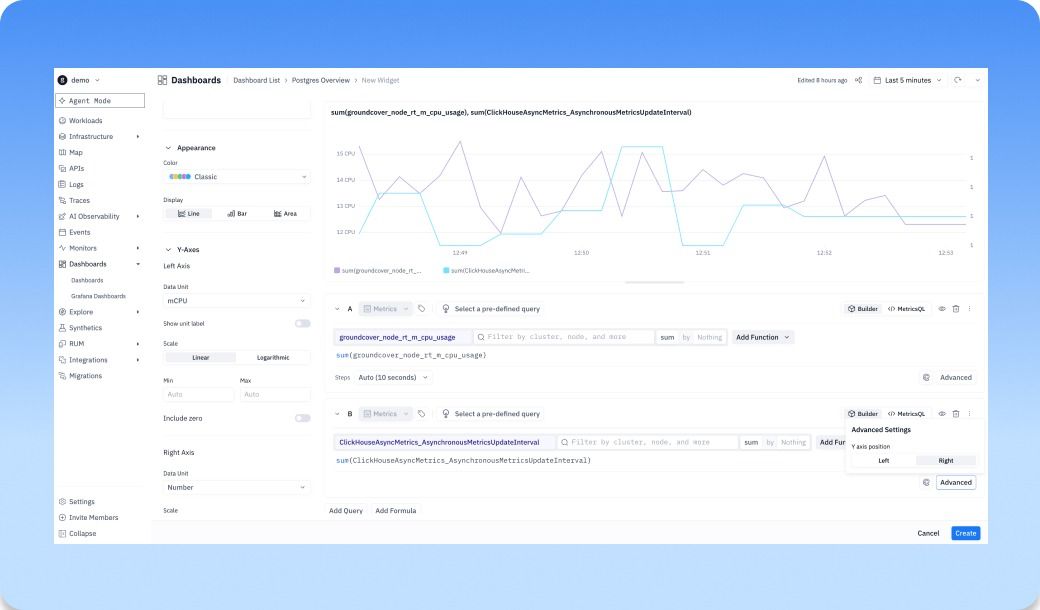
- There’s also right y-axis support for time series complete with per-query axis selection.
Other recent updates


Observability
for what comes next.
Start in minutes. No migrations. No data leaving your infrastructure. No surprises on the bill.


