


Weekly updates on new features, improvements, and fixes across groundcover.
Query Statistics and Health Dashboards for ClickHouse and PostgreSQL, Migration Readiness Tabs, and Profiling on the Workload Page
We shipped a lot of exciting new features and improvements in groundcover over the past two weeks. We added Database Monitoring for ClickHouse and PostgreSQL. Those integrations now collect query statistics and health metrics, with ready-made dashboards for each engine. Migrations sort every dashboard and monitor by how ready it is to move, and profiling data now appears on the Workload page. The rest of this what’s new covers sensitive data marking with RBAC for PII, an OTTL rule playground for traces, dashboard bulk actions, workloads created from OTel services, monitors, and a round of trace drawer refinements.
Database Monitoring for ClickHouse and PostgreSQL
groundcover connects directly to a ClickHouse or PostgreSQL instance to collect built-in health metrics and query statistics without requiring a separate Prometheus exporter. You can use the health metrics in dashboards and monitors and inspect query statistics as traces. With Collect query statistics turned on in the data source, groundcover reads that record every minute and stores one row per query shape, database user, and instance, with call counts, execution time, rows read, and errors. You can exclude INSERT statements and cap how many statements each scrape collects. Query text is stored with literal values replaced by placeholders, so you see the shape of a query without the data inside it.
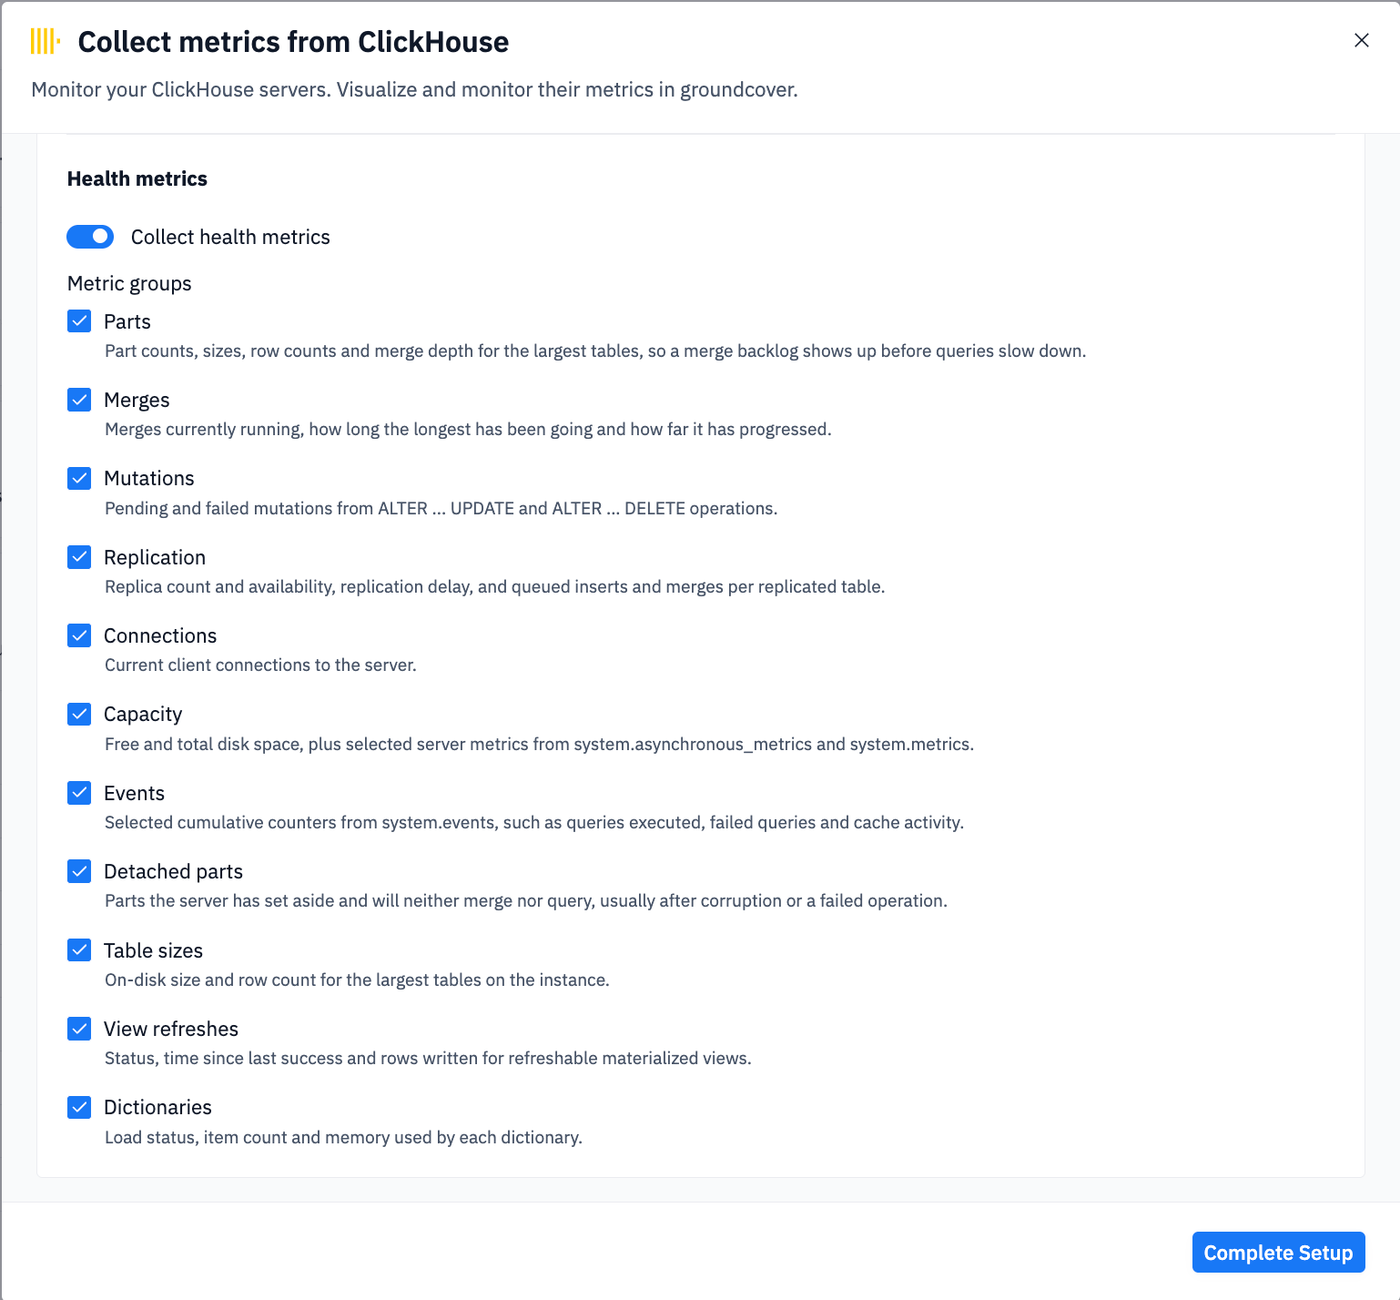
The same data source also collects health metrics, grouped so you can turn off what you don't need. Open a ClickHouse or PostgreSQL data source and its Dashboards tab lists the related dashboard for that engine. The two dashboards look different because the engines fail in different ways.
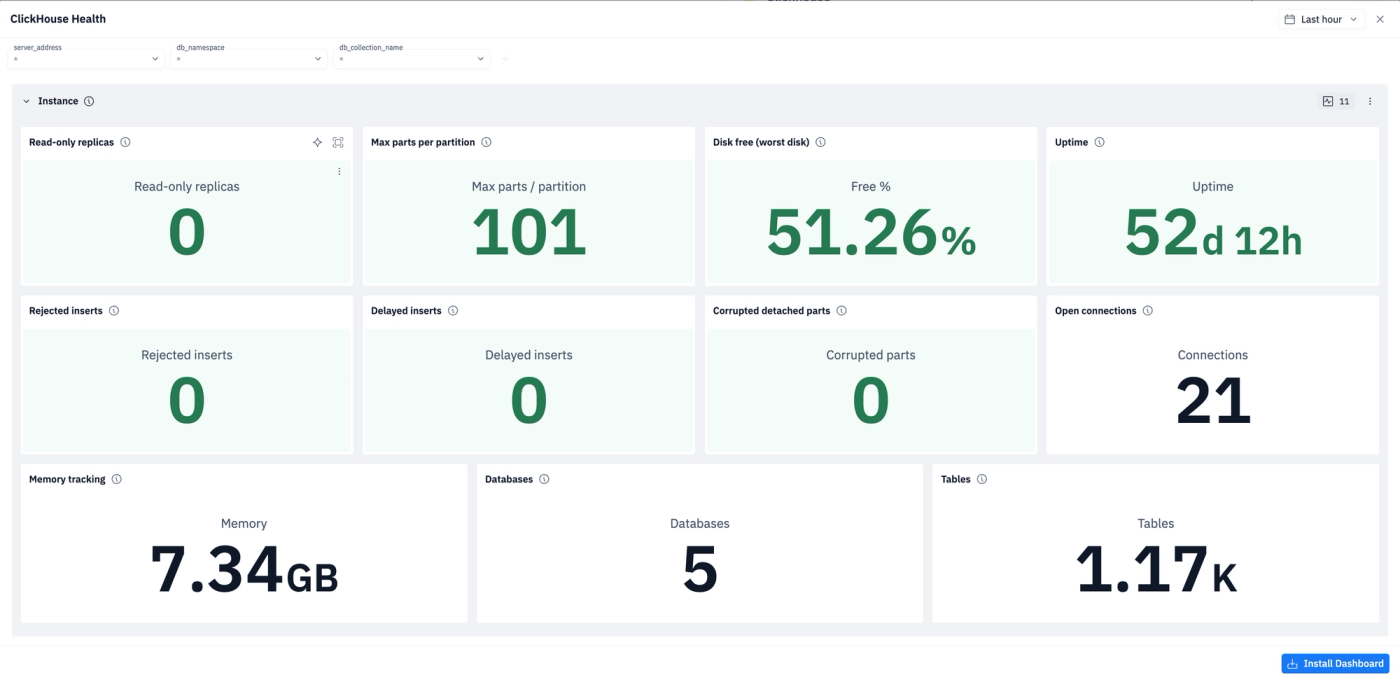
ClickHouse Health tracks how well the server keeps up with writes: max parts per partition, active and level-0 parts by table, delayed and rejected inserts, running and stuck merges, pending and failed mutations, replication queues, disk free per disk, and the status of refreshable materialized views and dictionaries.
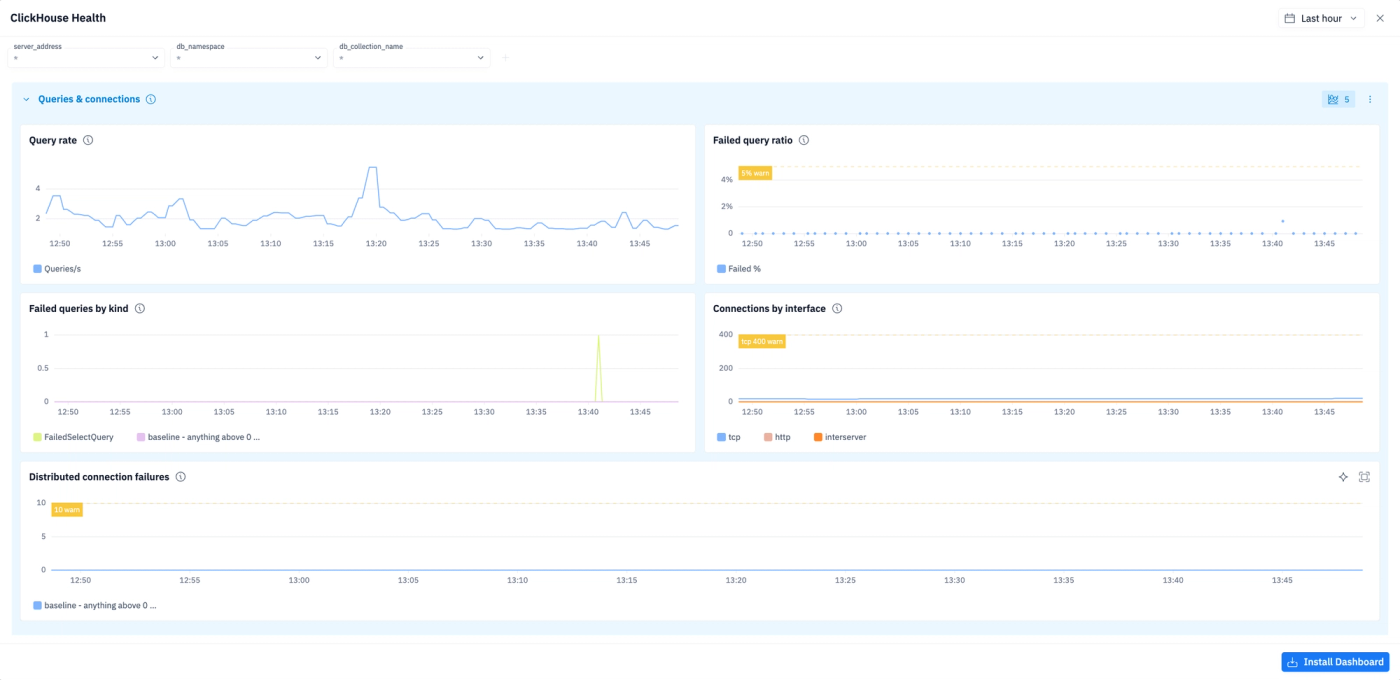
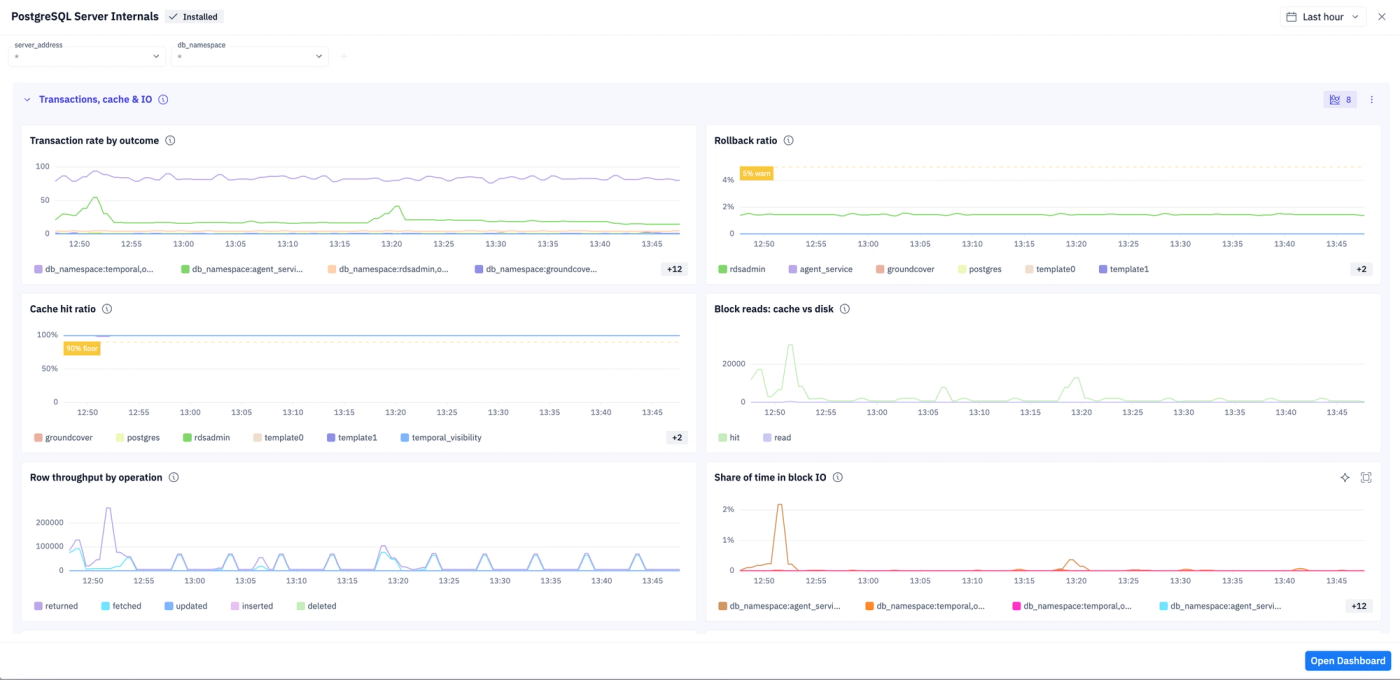
PostgreSQL Server Internals tracks connections and transactions: connection saturation against max_connections, sessions by state, replication lag per replica, cache hit ratio, rollback ratio, lock waits and deadlocks, transaction ID wraparound headroom, and WAL and checkpoint activity. Both mark warning and critical thresholds on the charts, so a value drifting toward trouble stands out before it causes an incident.
Setup is guided in the integration wizard, including the SQL to create a read-only user. When the integration starts, it checks each requirement. Anything missing disables only the metrics that need it, and the data source shows why.
Distributed trace refinements
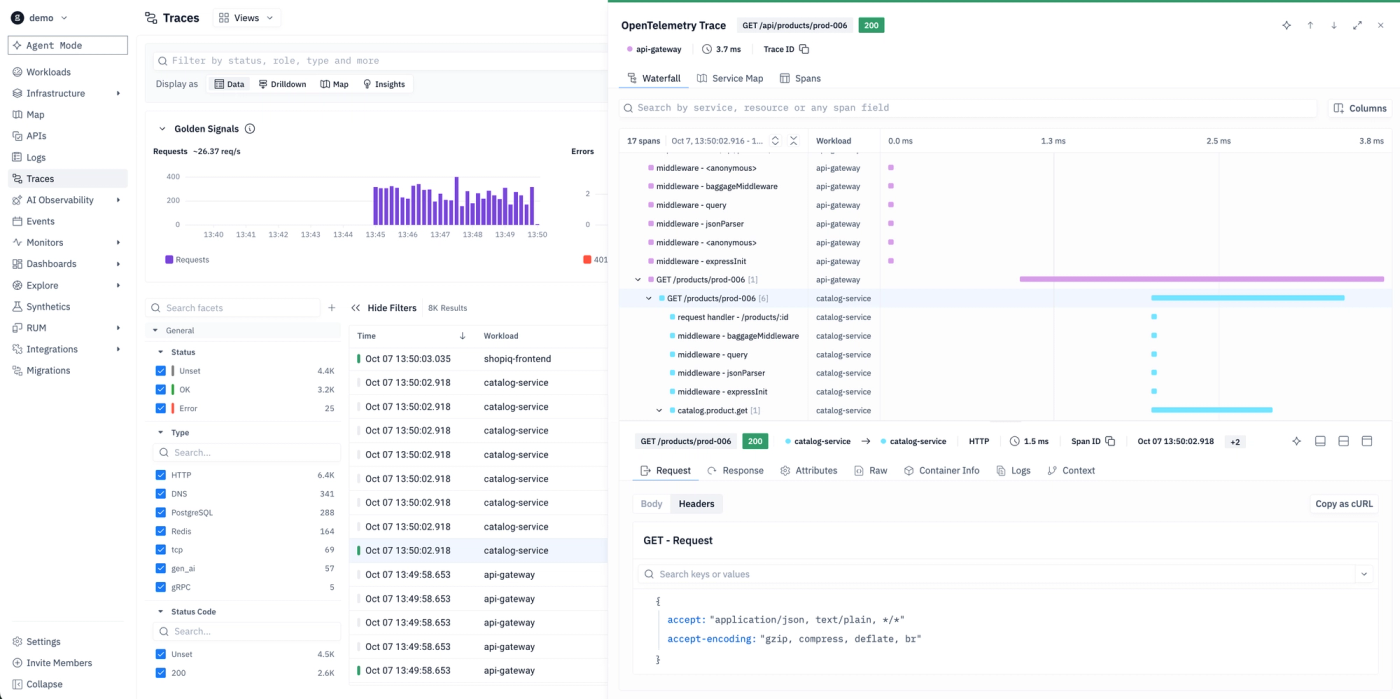
The trace drawer got a series of fixes and refinements:
- The span panel sits under the waterfall and resizes to fit traces with few spans. The split handle is easier to grab.
- Search the waterfall by service, resource, or any span field. Search folds the tree to show each match in context and limits its suggestions so they don't cover the waterfall.
- Color the waterfall by workload, namespace, span type, or node.
- Bar labels switch between dark and light text so they stay readable on light workload colors.
- The header has copy buttons for trace and span IDs, shows the span's timestamp, and moves extra tags into a +X popover.
- The Spans tab shows every span in the trace. Before, it could show only some of them.
Sensitive data tagging and RBAC for PII
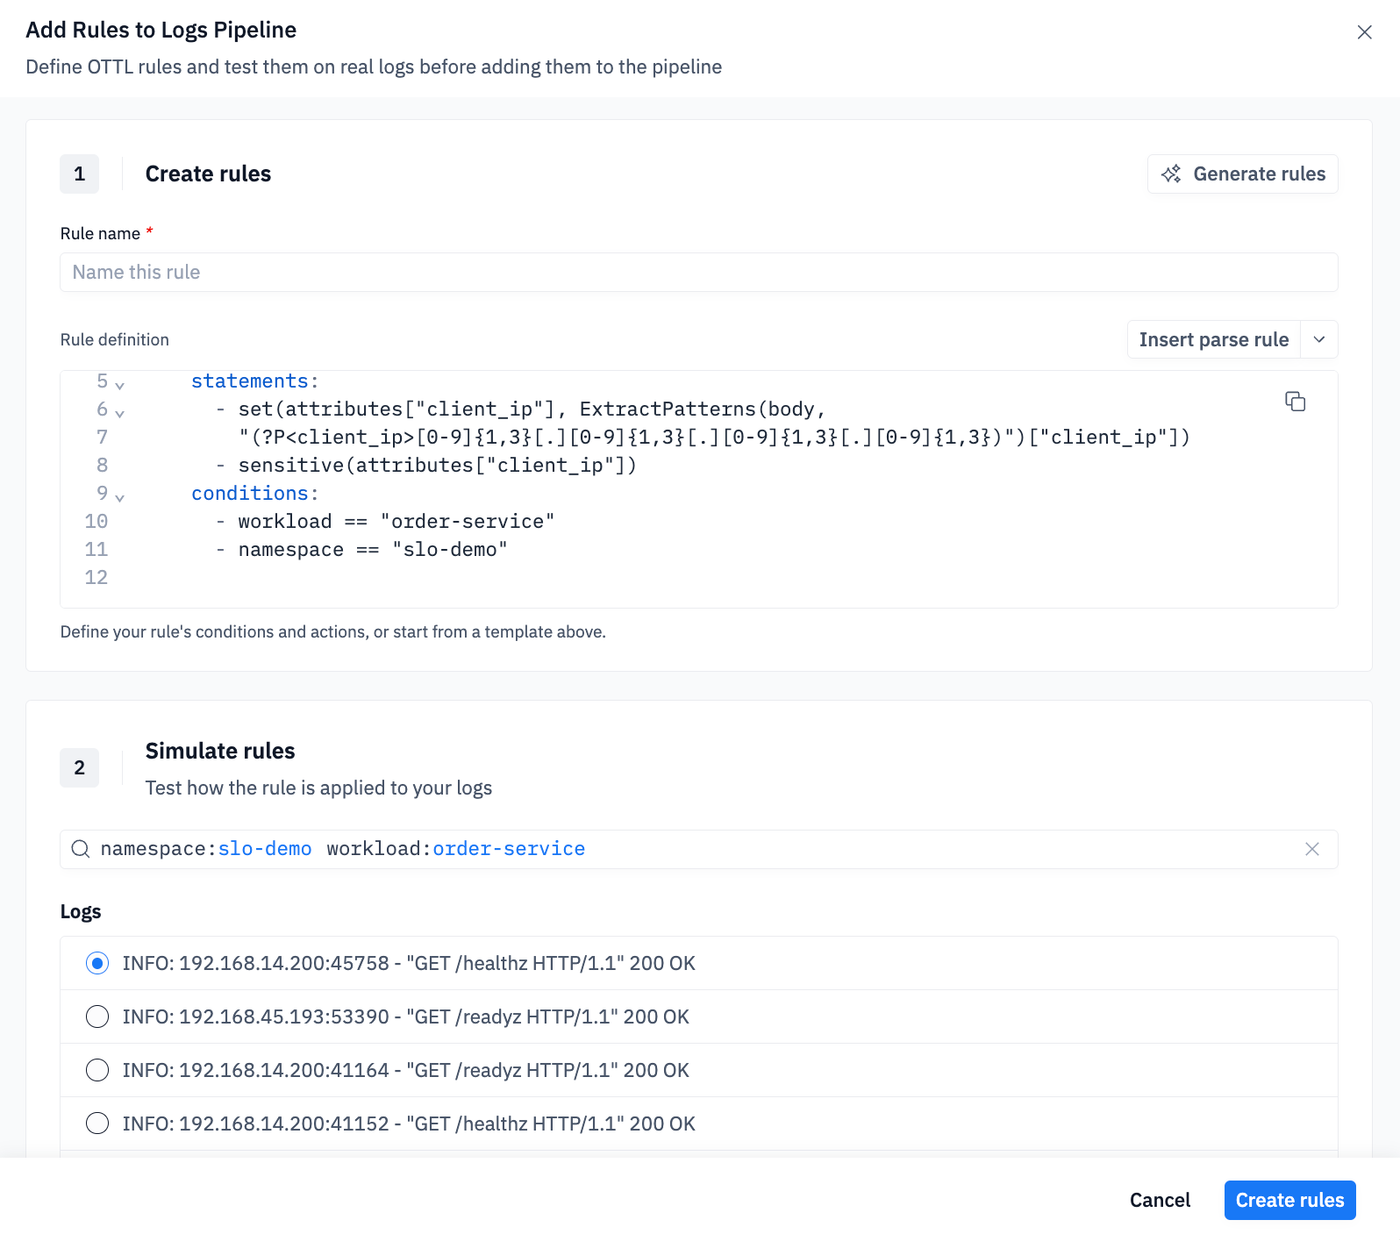
You now mark a log attribute as sensitive with the sensitive() attribute in an OTTL rule, scoped by conditions such as a workload and namespace. You can combine it with other statements, for example extracting a client IP from the log body into its own attribute and marking that attribute sensitive in the same rule. The rule simulation shows the masked result before you create it. groundcover masks those values for everyone by default. Admins grant access through a toggle in a policy's advanced settings. Users with that policy can reveal masked values in the logs table and log drawer, search on them with sensitive.key:value queries, and filter and group by them in their searches. Users without the policy see masked values, and the same queries return no results.
Policies are also gaining feature-level permissions. On top of a user's global role, a policy can grant or restrict access to a specific area of the product, for example giving an Editor edit access to Data Pipelines.
Migration assets grouped by readiness
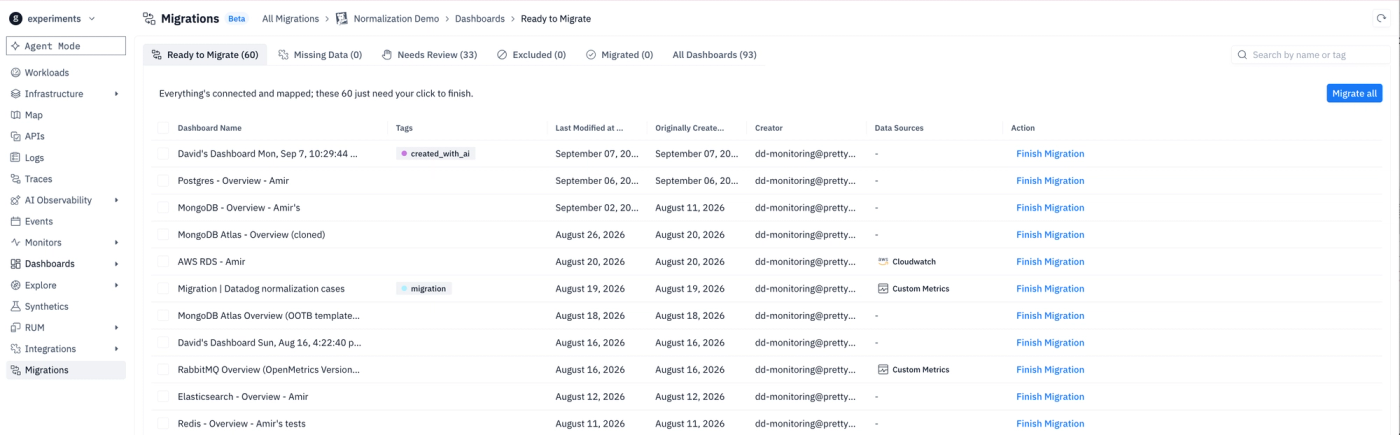
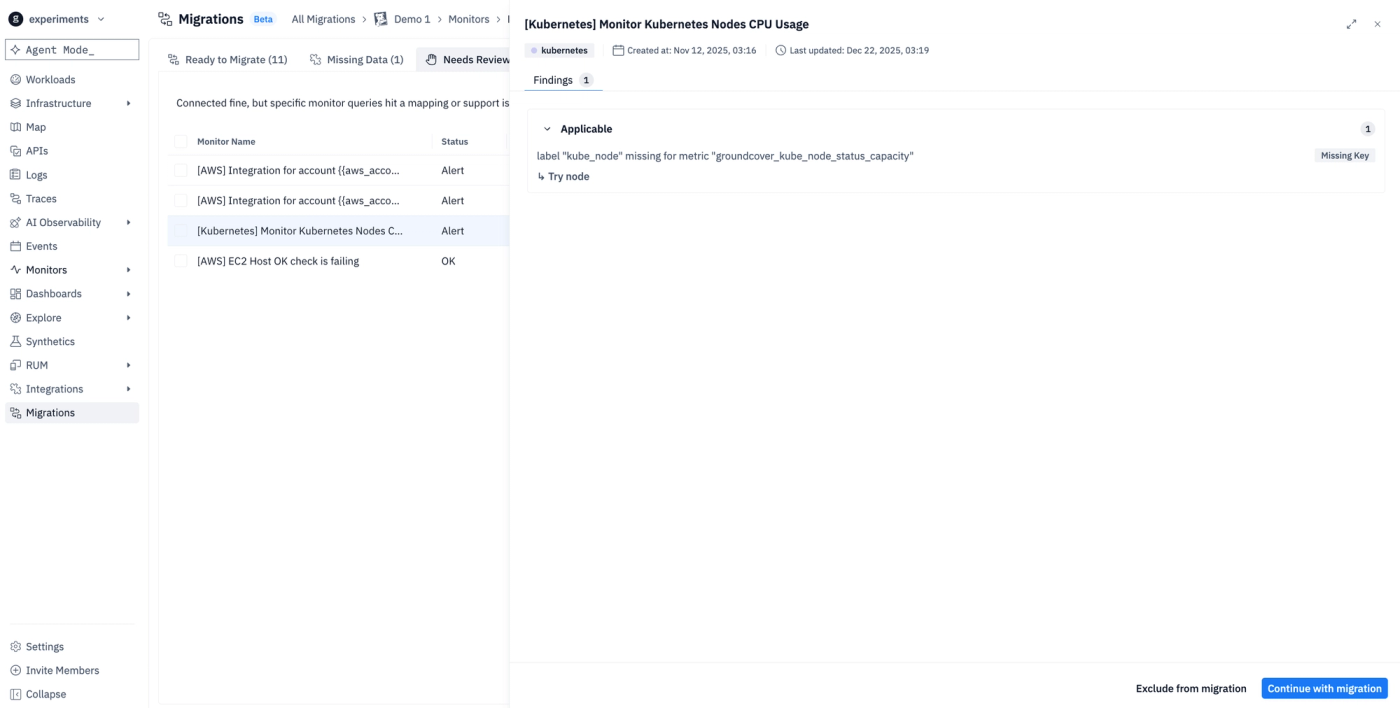
A migration can include hundreds of dashboards and monitors, and each one needs a clear status. The migration pages now sort every asset into tabs: Ready to Migrate, Missing Data, Needs Review, Excluded, and Migrated, each with a count. Ready to Migrate holds assets that are connected and mapped, and Migrate all moves them in one click. Missing Data holds assets that depend on a data source or environment you haven't connected yet. Needs Review holds assets that connected fine but hit a mapping or support issue in a specific query. Click any asset to open its findings drawer. Each finding names the problem such as a label missing for a specific metric or an unsupported type.
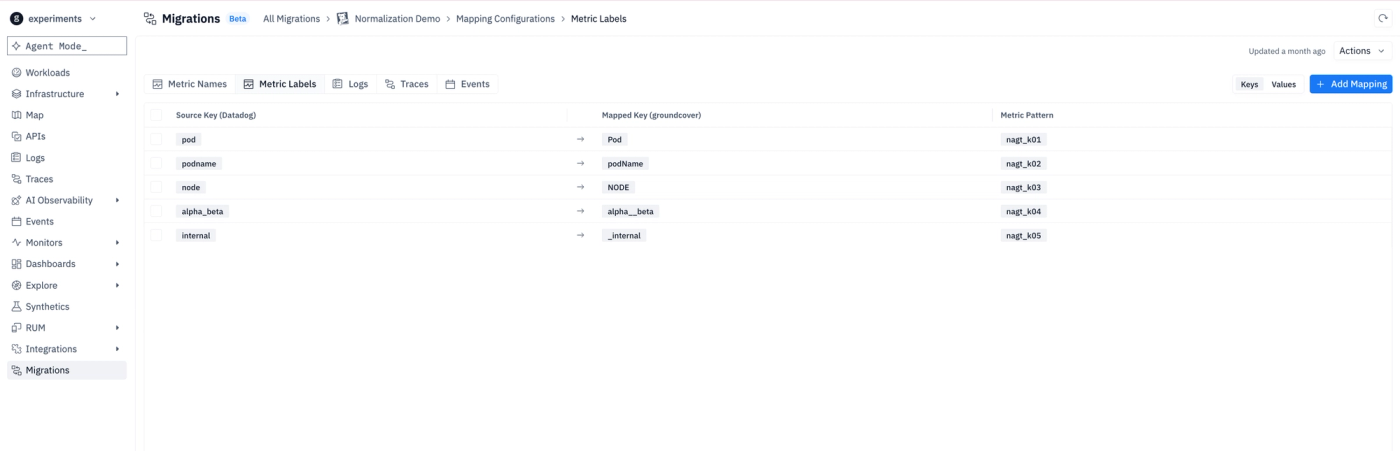
You can now easily normalize data with groundcover. Mappings translate migrated metric, log, and trace names so migrated dashboards and monitors query the right data. Find Mapping Configurations on the migration's overview page, alongside Dashboards and Monitors, with tabs for metric names, metric labels, logs, traces, and events. When a source key closely matches a groundcover key, such as pod and Pod, groundcover adds the mapping for you once it confirms the mapping returns live data, and every asset that uses that key picks up the fix. Lower-confidence suggestions stay in Needs Review for you to decide.
Monitors get the same readiness tabs as dashboards. Open a monitor in Needs Review to see each finding, such as a missing label key, along with a suggested replacement. Then choose Continue with migration or Exclude from migration without leaving the page.
OTTL rule playground for traces
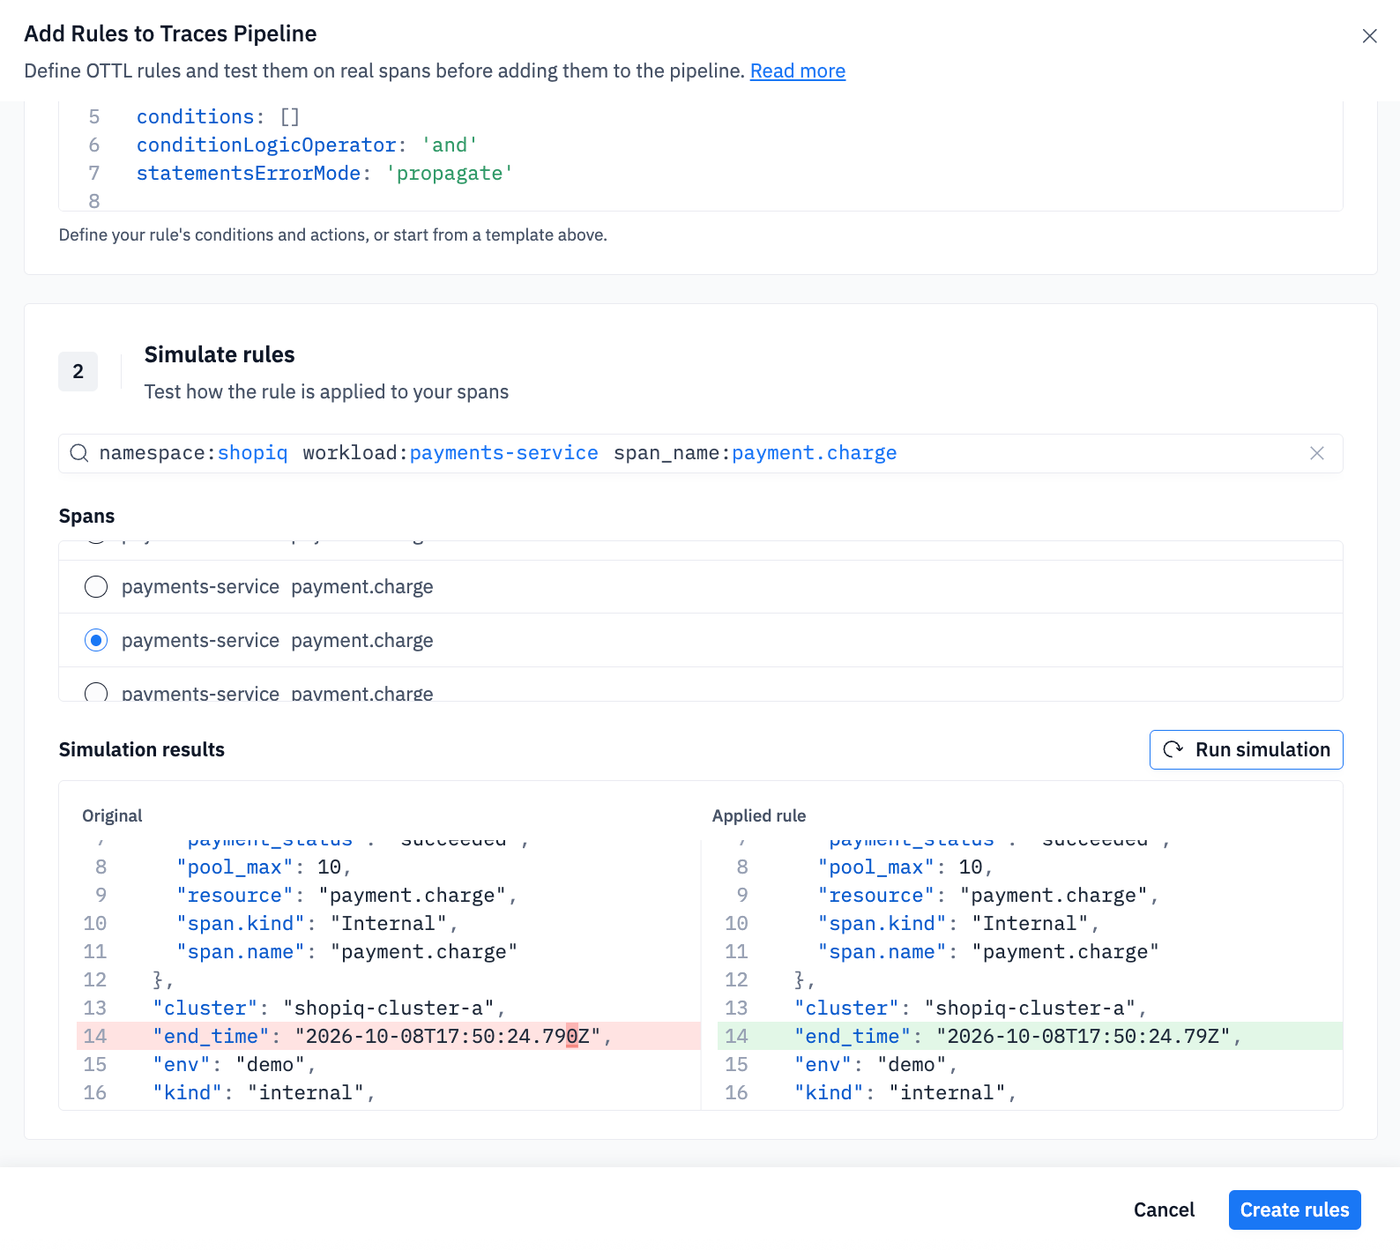
Last cycle's OTTL rule editor for logs is now available for traces. Open it from Actions on the Traces page, or from the button in the trace and span drawers. The editor lists the trace rule types up front: drop traces (such as health check endpoints), eliminate PII in request bodies before collection, URLs, and database statements, remove attributes, add or enrich attributes such as team or tier, and rename attributes. Each type opens a starter template you can edit, with a link to the traces pipeline documentation. Run the rule against a sample to compare the original and the result before you create it.
At the bottom of the OTTL playground you can see the simulation results:
Profiling via the Data Explorer
Profiling data now appears in the Data Explore and Workload page. Choose how to view the profile: a flame graph, a table of functions ranked by self and total time, or both side by side. Color frames by package or by value, draw the root at the top or the bottom, search frames by name, and click a frame to focus on it, with Reset focus to return to the full profile. Compare profiles from different time ranges to see which functions changed.
Profiling data now appears in the Data Explore and Workload page. Choose how to view the profile: a flame graph, a table of functions ranked by self and total time, or both side by side. Color frames by package or by value, draw the root at the top or the bottom, search frames by name, and click a frame to focus on it, with Reset focus to return to the full profile. Compare profiles from different time ranges to see which functions changed.
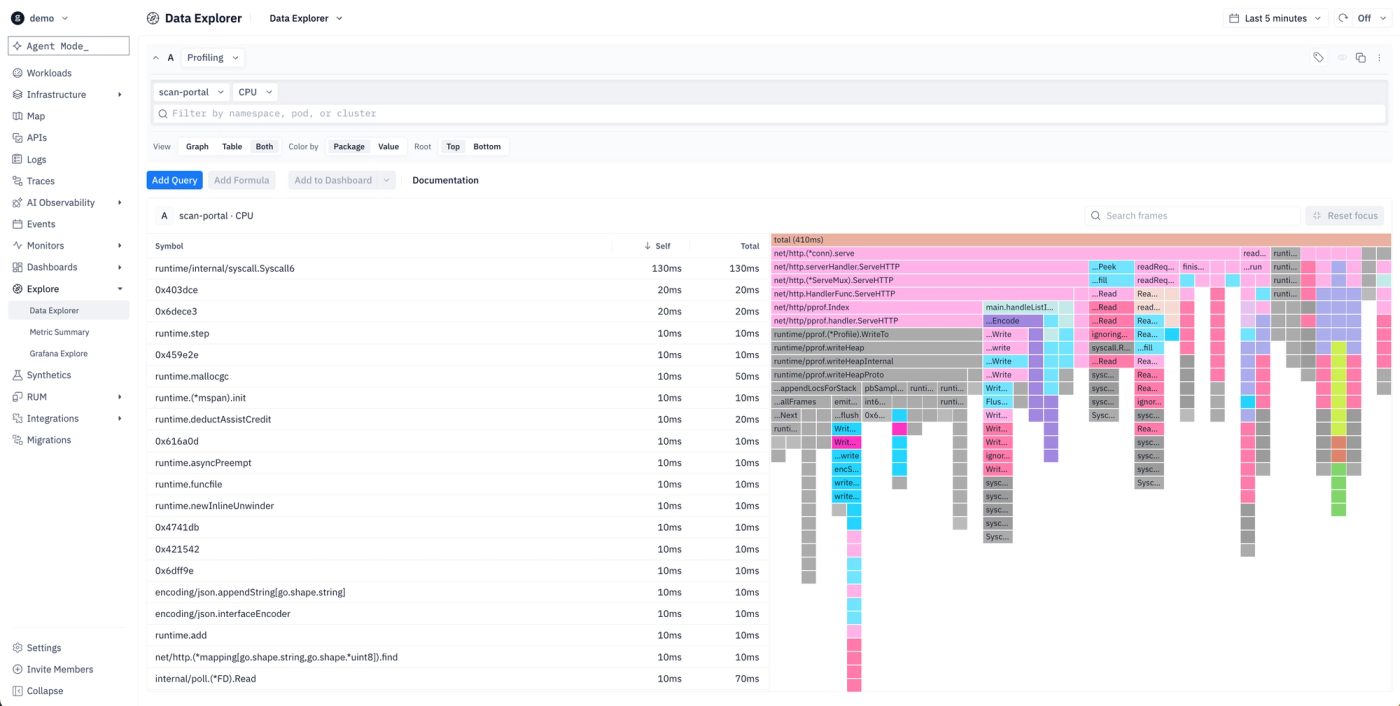
Profiles come from whatever you already send, using OpenTelemetry, pprof, or Pyroscope. groundcover's sensor also includes an eBPF profiler that samples CPU stacks without code changes. Dynamic configuration lets you turn it on and off and adjust its sampling without redeploying the sensor.
Workloads created from OpenTelemetry services
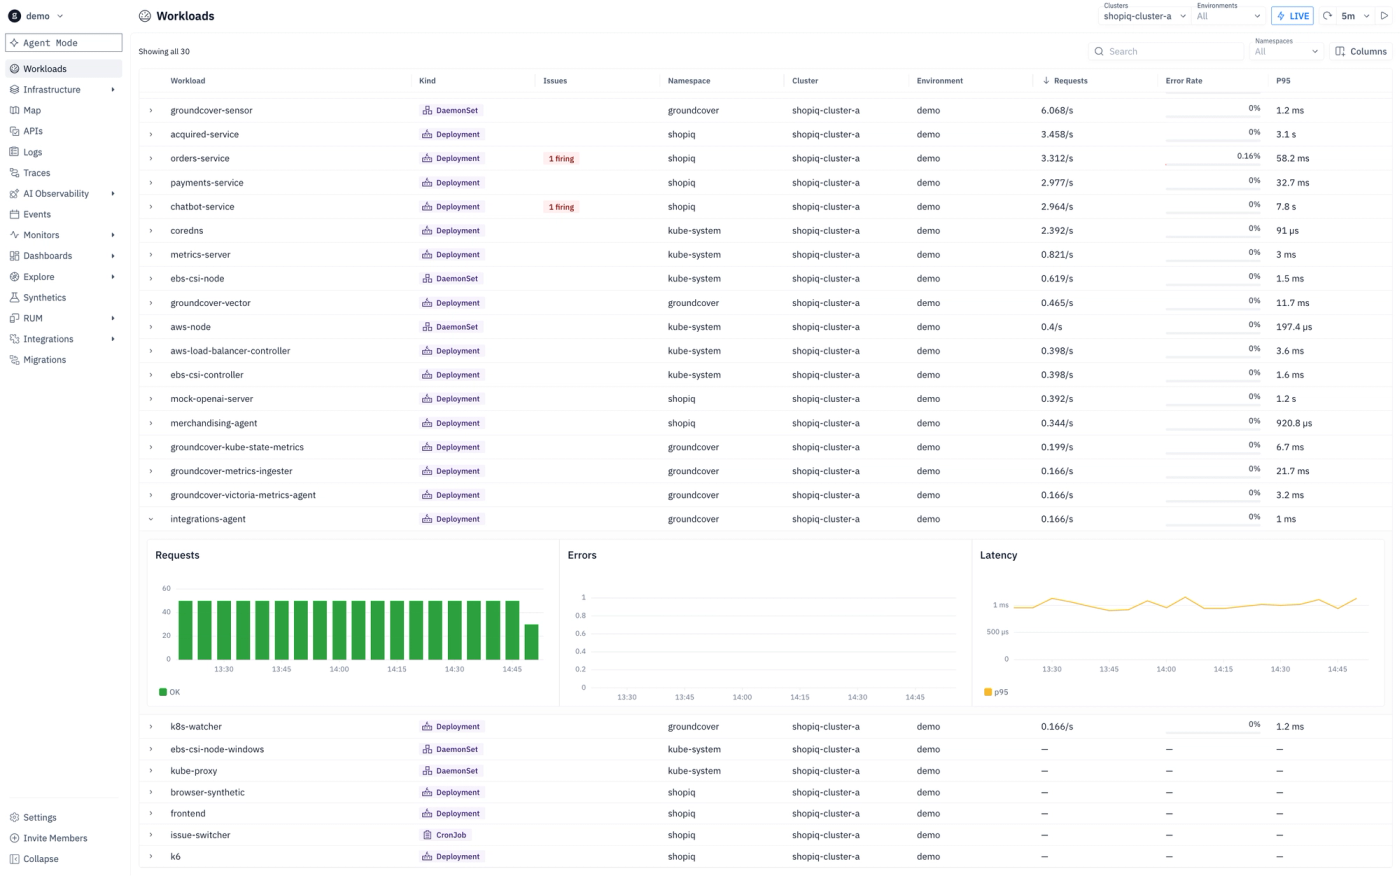
Last cycle, the Workload page started covering services outside Kubernetes, built from incoming spans and from the integration agent. groundcover now also creates a workload from the service.name on every incoming OTLP trace. Any service you instrument with OpenTelemetry gets a workload as soon as it sends traces, wherever it runs. It appears in the Workloads table and opens to the same Workload page as workloads the eBPF sensor discovers, with its traces, logs, and profiles in one place.
Dashboard improvements
Two dashboard improvements ship this cycle:
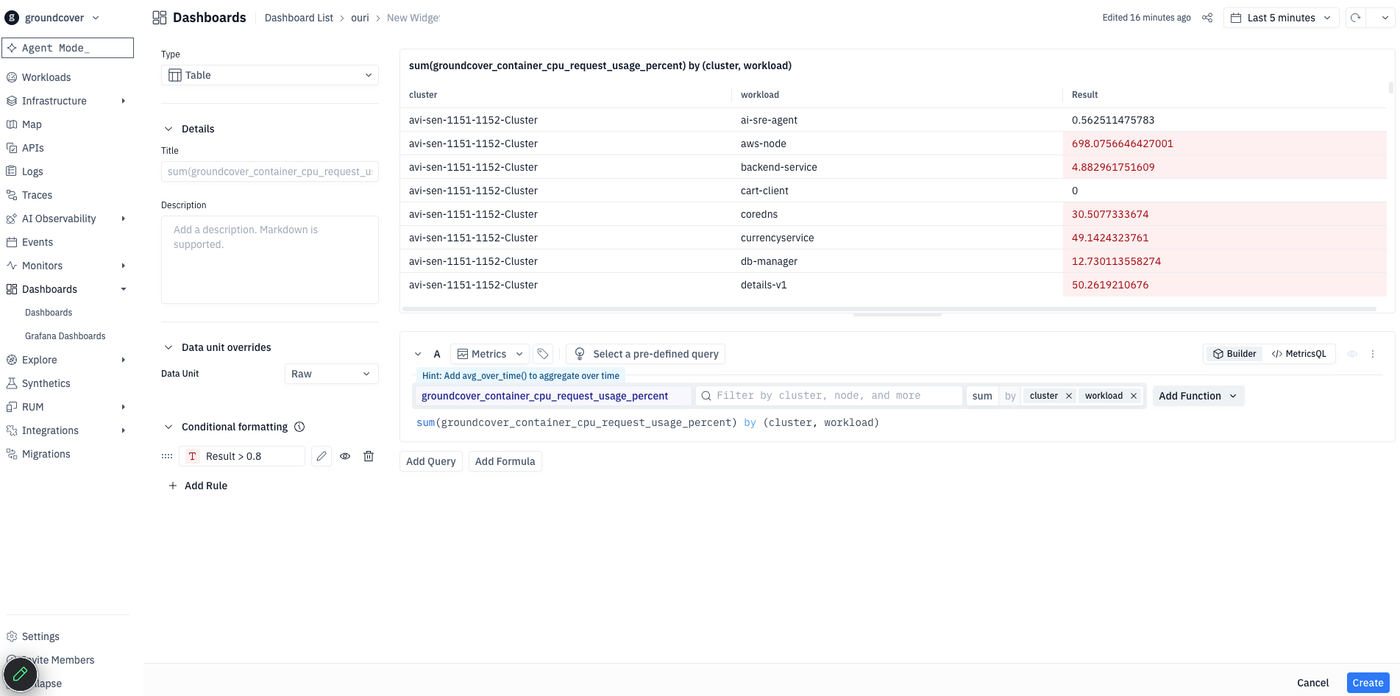
- Bulk actions on dashboards. Select several dashboards in the list and an action bar appears. Edit tags across all of them at once, archive the active ones, or permanently delete archived ones after a confirmation. This helps when a migration brings in hundreds of dashboards that need sorting.
- Queries shown in widget view mode. Full-screen widget view now shows each query with its data source, and which alias in the legend belongs to which query. When the agent builds a widget or a migration converts one, you can see exactly what it queries without opening the editor. This is also helpful for dashboard catalog cases where users want to see the queries before installing the dashboard.
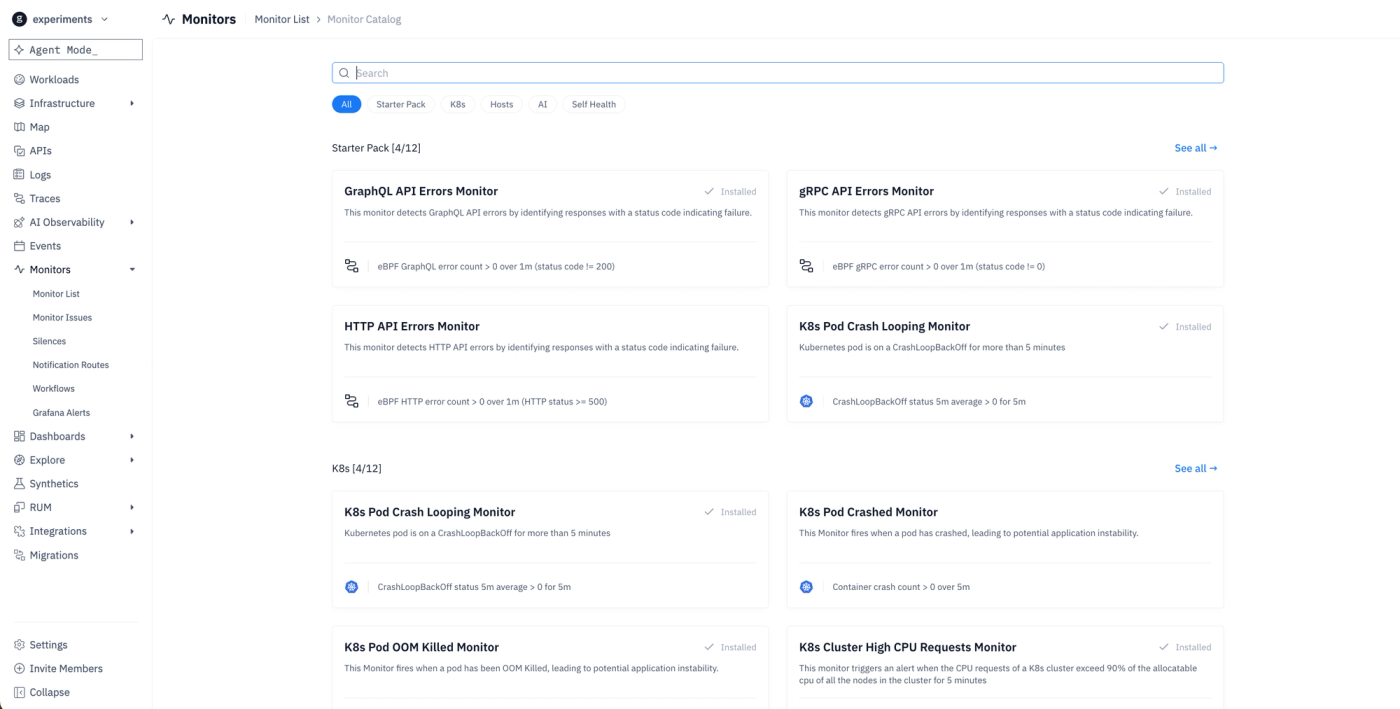
Monitors Catalog UI Improvements
The monitors catalog is now a full page under Monitors, with the same layout as the dashboards catalog. Search by name, or filter by pack: Starter Pack, K8s, Hosts, AI, and Self Health. Each card shows what the monitor detects and the exact condition that fires it, such as "Container crash count > 0 over 5m". Monitors you've already added show as Installed, so you can see your coverage at a glance and skip duplicates.
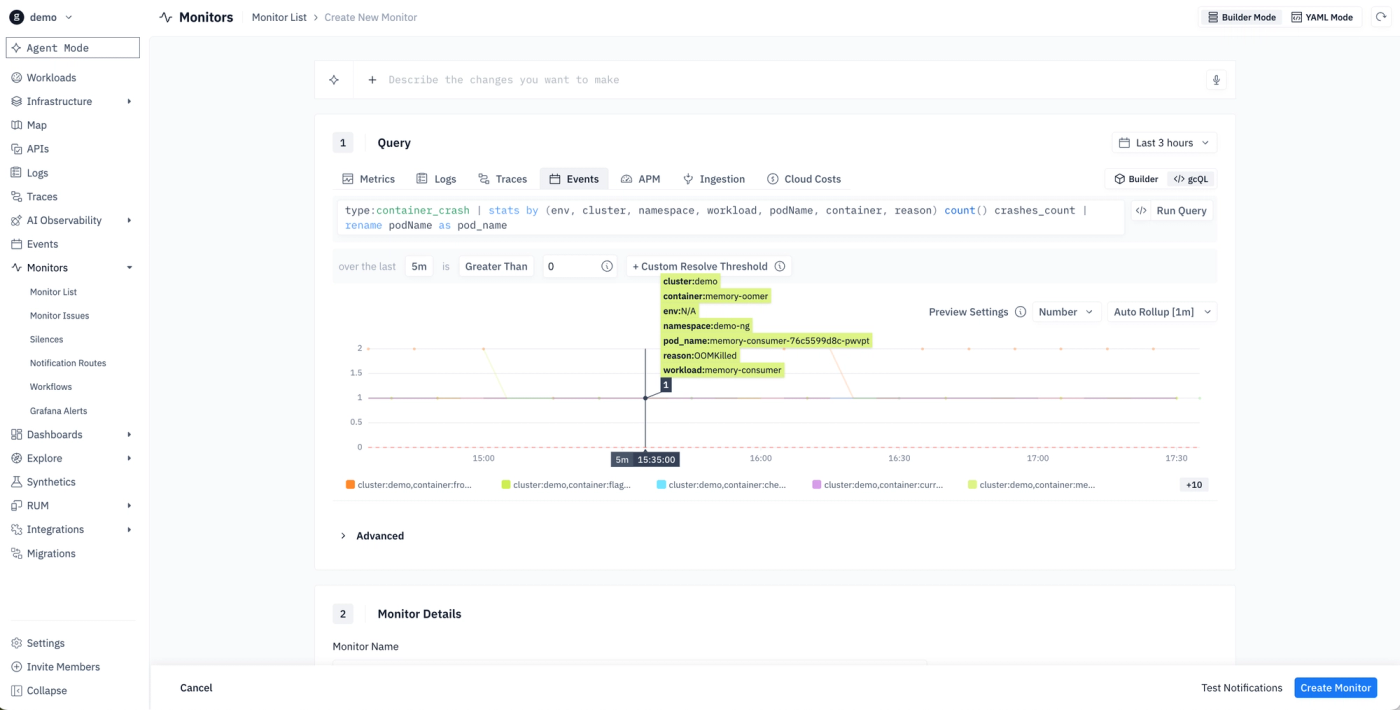
Click a card to open the create-monitor wizard, already filled in from the catalog. The query, threshold, and evaluation window are set, and a preview chart shows how the monitor wou
ld have behaved over recent data. You can adjust the query in Builder or gcQL mode before saving.
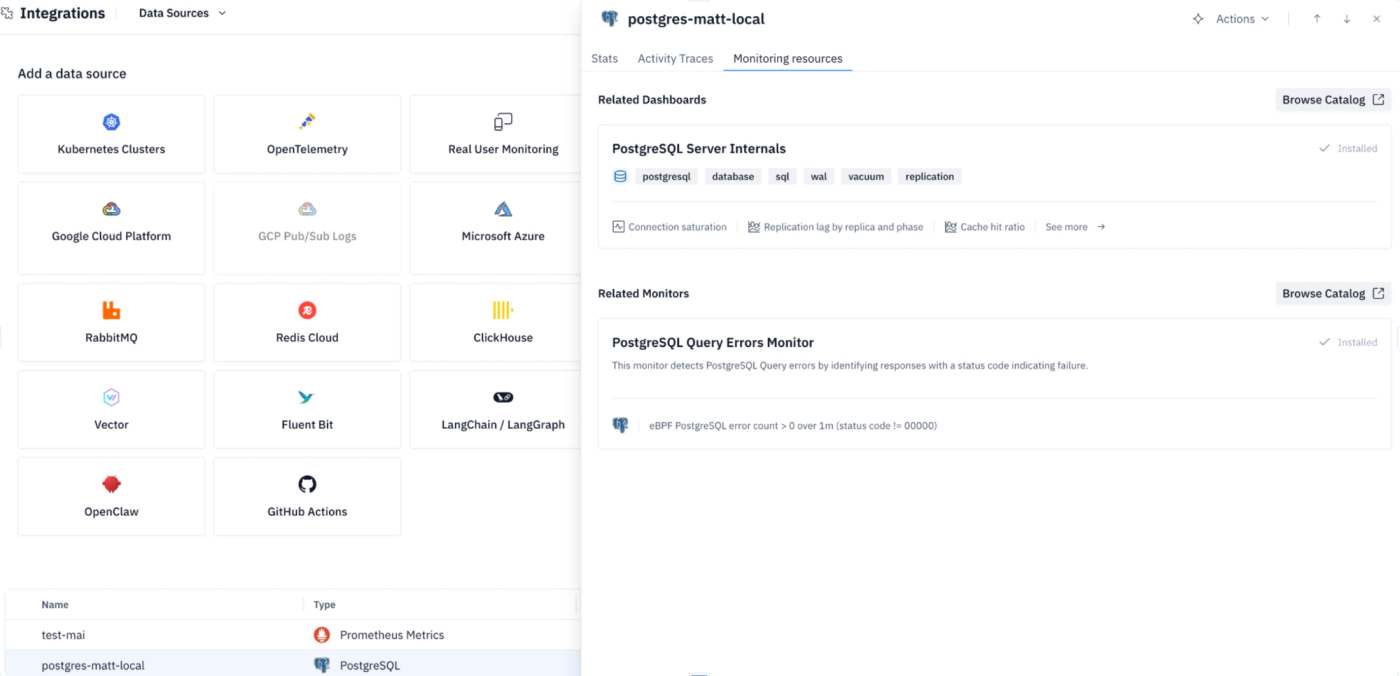
When adding and configuring a datasource, you can quickly see the monitors from the catalog for that datasource:
If you have any questions about groundcover, join our community Slack and ask away. Finally, give these new features and improvements in groundcover a try in our playground.
Other recent updates


Observability
for what comes next.
Start in minutes. No migrations. No data leaving your infrastructure. No surprises on the bill.


