Weekly updates on new features, improvements, and fixes across groundcover.

Non-Kubernetes Workloads, Flame Graphs in Explore, and Access Controls for Sensitive Logs
September 24, 2026
This changelog covers what shipped in groundcover in the last cycle. The Workload page was rebuilt and now covers services running outside Kubernetes, profiling data shows up in Explore as a flame graph, and admins can control who sees sensitive log attributes. Migrations, dashboards, and the OTTL rule editor also got updates that remove manual steps from each.
A rebuilt Workload page that includes non-Kubernetes workloads
The Workload page used to list only the workloads groundcover's eBPF sensor found inside Kubernetes, so services you monitor through OpenTelemetry or the integration agent had no page of their own. groundcover now builds workloads from incoming spans and from the integration agent, and treats them the same as Kubernetes workloads. They appear in the Workloads table, and clicking one opens its Workload page. The page itself has been redesigned to show more of the data groundcover already collects for each workload, so you can understand what a service is doing, and where it's struggling, from one place.
Restricted access to sensitive log data (eta Monday September 26, 2026)
Some log attributes hold information parts of your team shouldn't see, like customer names or account details. You can now mark specific log attributes as sensitive, and groundcover masks their values for everyone by default. Admins grant access with a new toggle in a policy's advanced settings. Users covered by that policy see an eye icon next to masked values in the logs table and log drawer, and clicking it reveals the original value. They can also search on those values with sensitive.key:value queries, while the same query returns nothing for users without access. This is built for larger organizations that need to keep sensitive data in their logs and still limit who can read it. This is still in the works but rolls out on Monday.
Profiling flame graphs in Explore
The trace waterfall shows how long each span took, but working out which part of a service consumed that time means reading through long rows of nested spans. groundcover now ingests standard profiling data and adds Profiles as a data source in Explore. Pick a workload and a profile type, such as CPU, then switch to the Flamegraph view. Each bar is a function, and its width shows how much of the total time it used, so the widest bars point to the services and functions to focus on first. Builder templates for top functions and cost by workload give you the same data as a ranked table.
A migration workflow that shows what's ready and what needs you
Moving hundreds of dashboards and monitors from another platform is mostly automatic, but some assets need your input before they can migrate, like a data source that isn't connected or a metric that needs mapping. The migration assets page now groups assets into Ready, With Issues, and Unsupported tabs, each with a count, so you can see what can move today and what's waiting on you. A summary of open issues sits above the table, and you can sort and filter dashboards by tag and monitors by severity to decide what to handle first. When an asset needs attention, you fix it on the same page: connect the missing data source, map metrics and values, or open the new Configure Environment flow from the Data Sources tab.
Dashboard improvements
Several improvements to dashboards shipped this cycle:
- Multiple data sources in one widget. For example, a single widget can combine traces with logs, or traces with metrics, and run formulas across them, so related signals appear on the same chart.
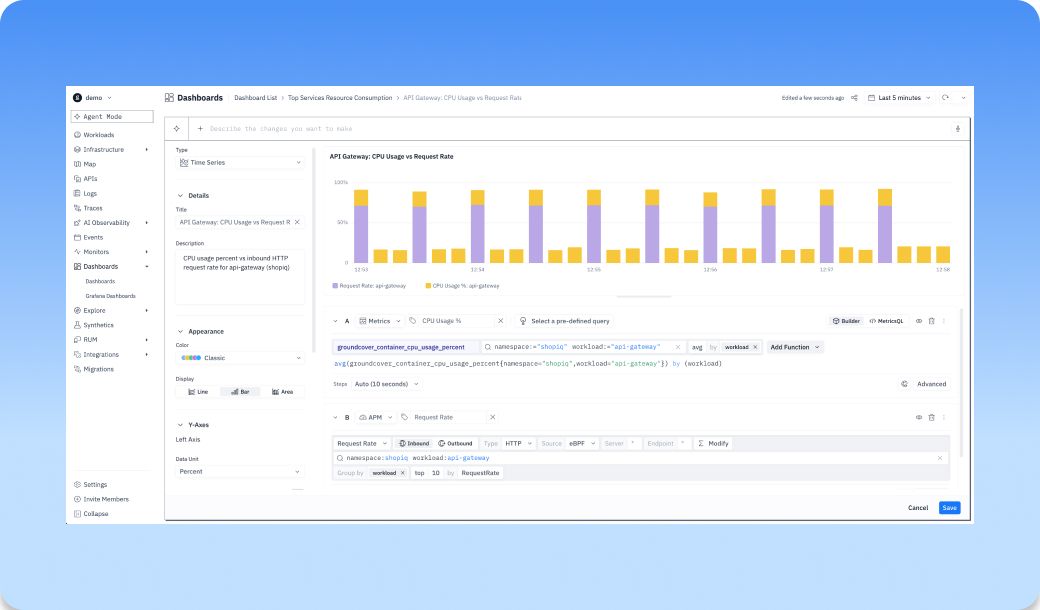
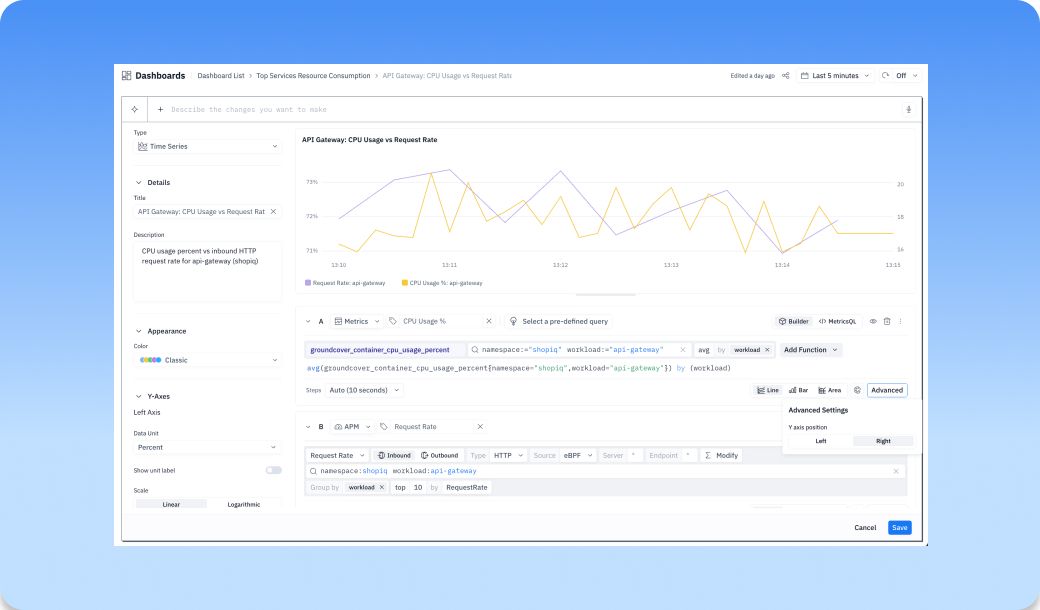
- Mixed chart types in time series widgets.Each query can display as a line, bar, or area, so you can plot request volume as bars on the right y-axis and latency as a line on the left. For example, chart CPU usage as a line alongside APM metrics like request rate as bars to see whether a CPU increase follows a jump in traffic. You can also plot the number of active users against exception counts to tell whether a spike in exceptions came from higher load or from something else. This builds on the right y-axis support and color palette per query added last cycle.
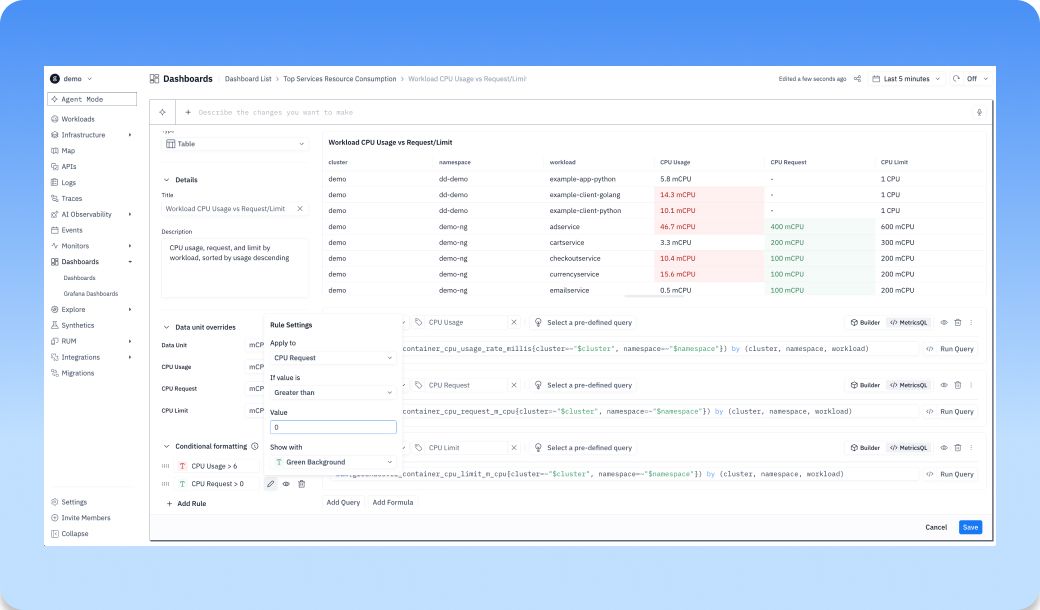
- Conditional formatting in tables. Set rules that color a cell's background or text when its value meets a condition, such as CPU utilization above a threshold, so problem rows stand out at a glance. When rules overlap, the first one applies, and you can drag rules to reorder them.
- Sort logs by any column. The Log Explorer used to sort only by timestamp. Now you can sort by any attribute, such as response time, status code, or pod name, so the slowest requests or noisiest pods rise to the top. You can still open any log to see its full content.
A clearer OTTL rule editor for logs
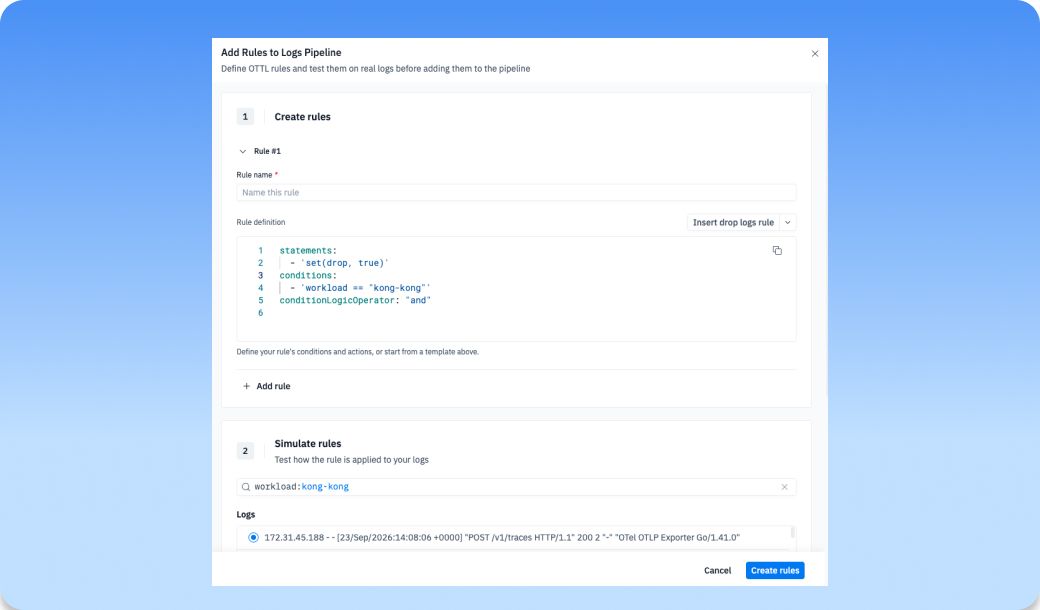
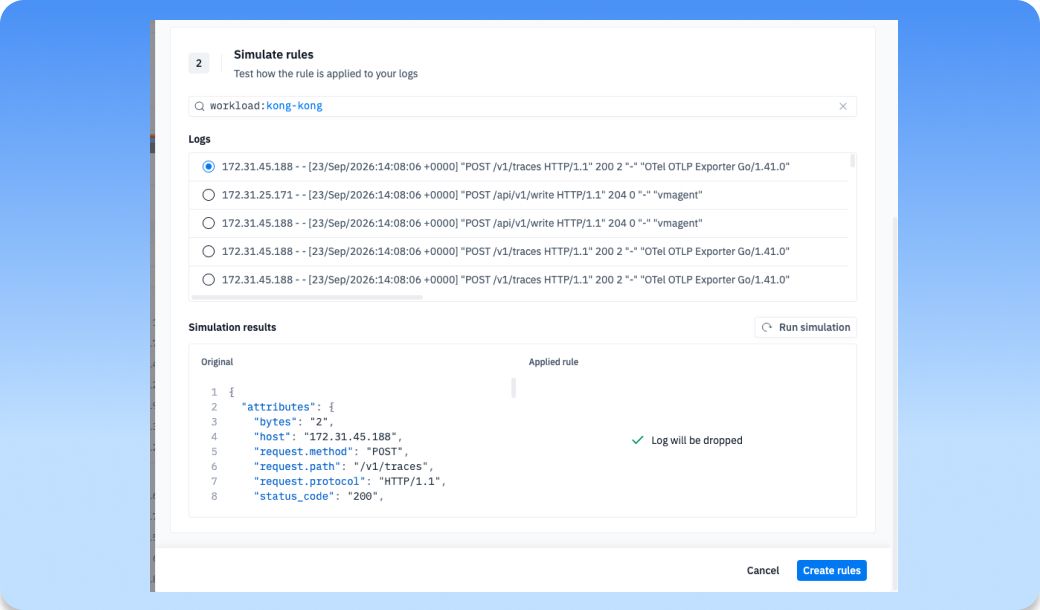
The OTTL rule editor used to start by generating a parsing rule from your query, which left many users unsure what else they could do. The redesigned editor lists every rule type up front: parse, drop, obfuscate, logs to metrics, and merge multiline logs. Choose one and you get a starter template to edit, with a link to its documentation. If you open the editor from the Logs page with a filter applied, that filter becomes the rule's condition. If you open it from a specific log, that log loads into the test panel, where you can run the rule and compare the input and output, with the changes highlighted.
If you have any questions about groundcover, I encourage you to join our community slack and ask any questions you may have. I also encourage you to give groundcover a try with our playground.
More accurate Datadog migrations that bring over more of your setup
A migrated dashboard or monitor should show the same data it showed in Datadog. This month, conversion improved for dashboards built on Redis, Elasticsearch, MongoDB, MongoDB Atlas, RabbitMQ, Temporal, PostgreSQL, and AWS CloudWatch. Rollups, rates, counts, deltas, top-N, IN (...) lists, negated and multi-value filters, and arithmetic formulas now translate correctly in both metric and log/trace searches. Some converted queries used to return nothing because Datadog formats metric names, tag keys, or tag values differently. groundcover now finds the matching name in your live data and applies it automatically, so you don't have to map it yourself.
More of your setup also comes across. Dashboard tags carry over to the migrated dashboards. A popularity ranking based on Datadog view counts lets your team migrate the most-used dashboards first, and a Creator column shows who built each asset in Datadog. The Data Sources view now lists what you still need to set up next to what's already connected. That includes the environments your dashboards depend on, integrations that are only partly collected (with the exact missing metrics), and custom metrics. For each one, you see what's missing and how to fix it.
Other recent updates


Observability
for what comes next.
Start in minutes. No migrations. No data leaving your infrastructure. No surprises on the bill.