Weekly updates on new features, improvements, and fixes across groundcover.

Describe what you want, get what you need–more agent assistance and improvements to dashboards
August 13, 2026
Most of the work in this release landed in two places: dashboards and the agent. Dashboards got easier to template and easier to keep tidy. We shipped variables that map across data sources, saved views you can re-apply in one click, and facets plus bulk actions so a long list stops being a scrolling exercise. The agent picked up things it couldn't do before, too: build a monitor from a plain-English description, scope a question to an exact key:value with @mentions, and take images as input, whether that's a screenshot of a problem or a rough sketch of the dashboard you want it to build. And your groundcover links now unfurl into real cards in Slack, so a trace or log shows up where the incident's already being talked about.
Dashboards
Variables that hold the values you actually use
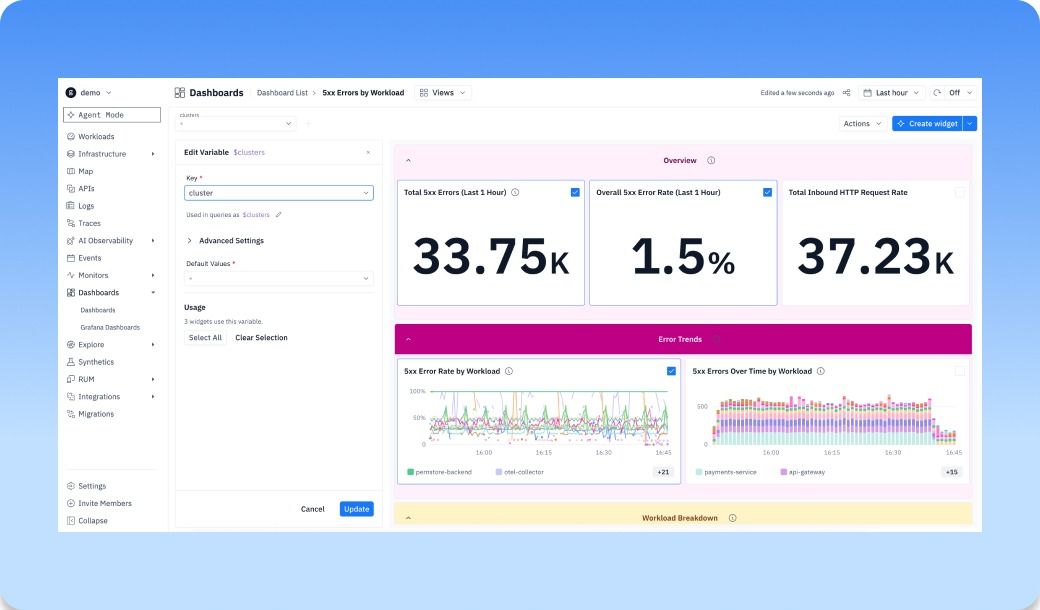
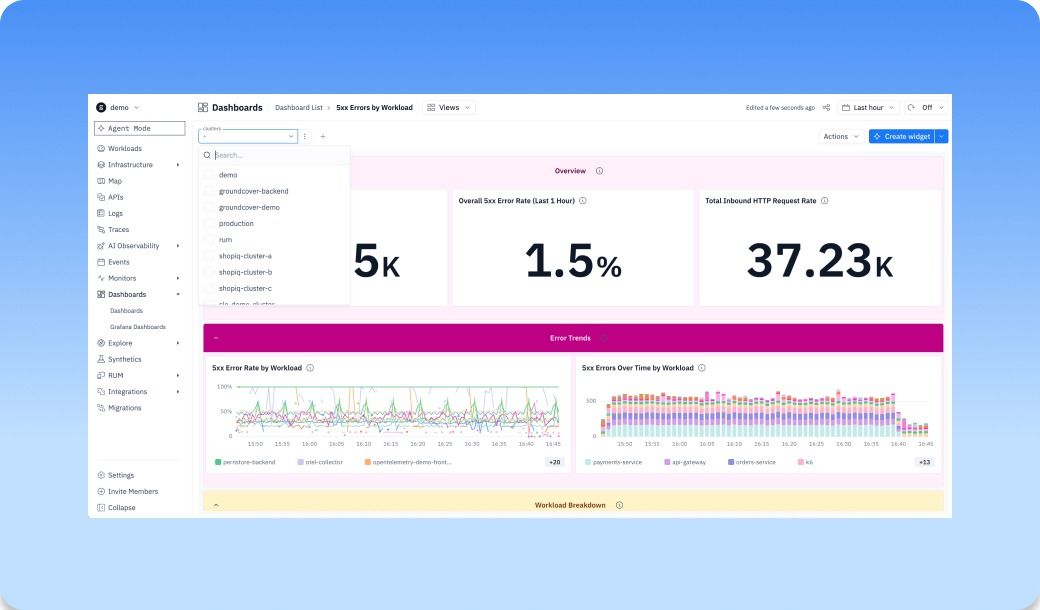
If you’ve followed groundcover for a while you know that dashboard variables also got redesigned setup flow that suggests variables and supports custom mappings, so wiring up a templated dashboard is far less fiddly. Now, for example, a single $cluster variable maps to whatever each source calls it, so one templated dashboard works across all of them instead of forcing you to duplicate variables per source. Variables also now support a static list of values as well. We also added variables to the full screen view of a widget, so users can filter by them ad-hoc without effecting the full view
Now once you've settled on a set of variables you use together, you can stop re-selecting them by hand. Saved variable views let you name a preset of variable values on a dashboard and re-apply it later. The set of values you reach for every week (i.e. this cluster, that environment, and prod only) becomes one selection instead of five.
Managing a wall of dashboards without the scroll
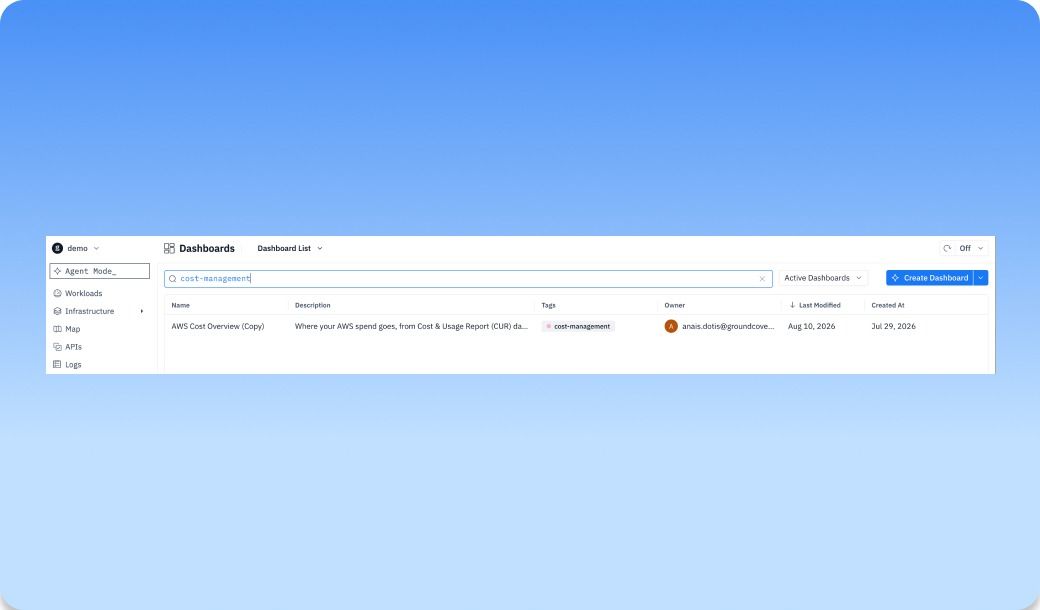
Once you've got dozens of dashboards, finding the right one or fixing the tags on twenty of them turns into a scrolling exercise. Two changes were made to Dashboards that improve your quality of life. The dashboards list now has facets, so you can filter by tag or owner and see a live count of what's left, the same way you already filter logs and monitors.
Connectors — groundcover links that explain themselves in Slack
Paste a link to a trace or a log into Slack and your teammates get a bare URL — they have to click through and log in just to see what you're pointing at. Now a groundcover link unfurls into a card right in the thread, with the key details of the trace or log rendered inline. The context lands in the conversation where the incident is actually being worked, instead of one tab away. The same treatment is coming to monitors next.
Agent — Create a monitor by describing it
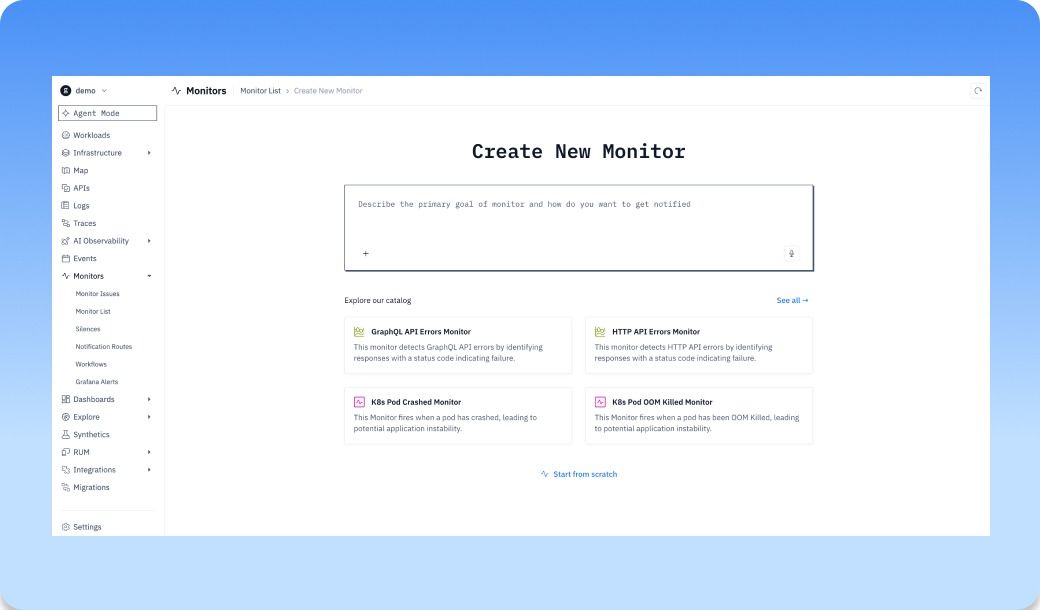
You could already spin up a dashboard just by telling the agent what you wanted to see. Monitors now work the same way. Open Create New Monitor, describe what you want to catch and how you want to be notified. For example, write "alert me when 5xx errors on the checkout service go above 2%" and the agent drafts the whole thing, query and notification settings included, ready for you to review before it goes live. Additionally, if you'd rather start from a known-good pattern, the catalog sits right there on the same screen: browse ready-made monitors like GraphQL and HTTP API errors or K8s pod crashes and OOM kills, and drop one in instead of building from scratch.
Point the agent at exact values with @key:value
When you're asking the agent about one specific service or pod, you don't want it guessing which one you mean. You can now mention a key:value pair directly in chat — type @, pick the key, pick the value — and the agent scopes to exactly that. No more spelling out "the payments-service in the prod cluster" and hoping it lands on the right one.
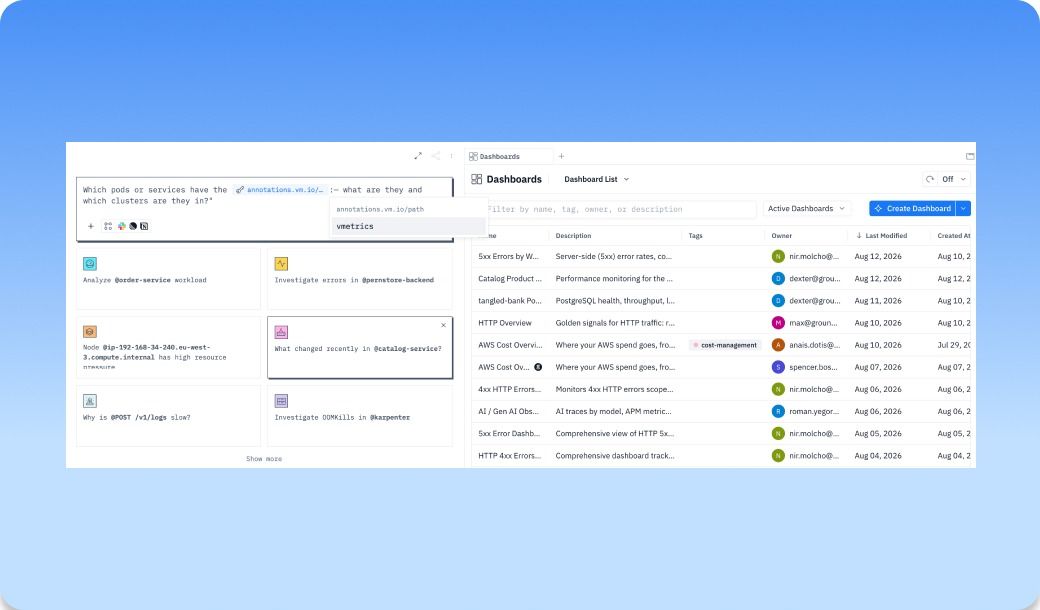
The point is that a key:value pair becomes a pre-resolved handle: you point at the metadata and the agent already knows the exact key and value you mean, so you never have to remember that the field is annotations.vm.io/path and the value is vmetrics. That makes it a scope anchor — ask "show me all pods with this annotation" and the query is filtered for you. It works for anything that groups, routes, or configures your infrastructure, whether that's "who owns the services tagged team:platform?", "how much is tied to cost-center:infra?", or "if this config value changes, what does it affect?". Because the pair is a real entity in the chat, you can pivot off it — start at one label and fan out to the logs, traces, metrics, and events attached to it. It turns a piece of Kubernetes metadata into something you can investigate directly instead of a query you have to hand-write.
That pays off most with the metadata you'd otherwise have to go look up. Take VictoriaMetrics: which targets get scraped is driven by annotations like annotations.vm.io/path, and unless you've got that key memorized, auditing it means digging. With @key:value you just point at annotations.vm.io/path:vmetrics and ask which pods and services carry it — and which clusters they're running in — to see exactly what's being scraped and where.
Show the agent what you're looking at
Sometimes the fastest way to explain a problem is to point at it. The agent now takes images as context, so paste or drop a screenshot straight into the chat. And with Control + Command + S, groundcover captures the panel you're looking at, keeps the URL and page it came from, and drops it into the agent chat as a snapshot. A weird spike on a chart becomes something the agent can actually see and reason about, instead of something you have to describe pixel by pixel.
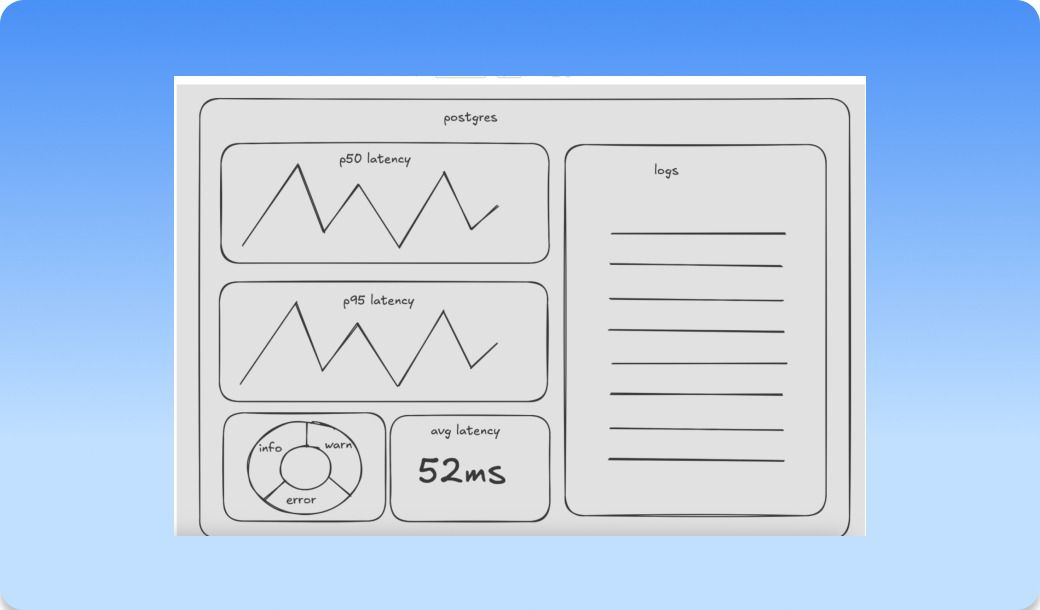
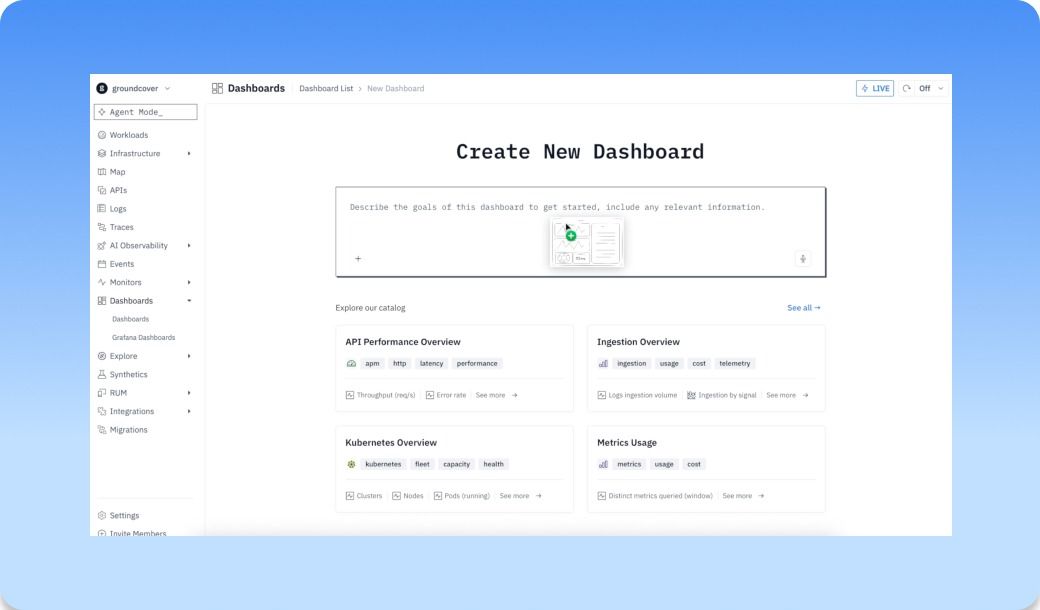
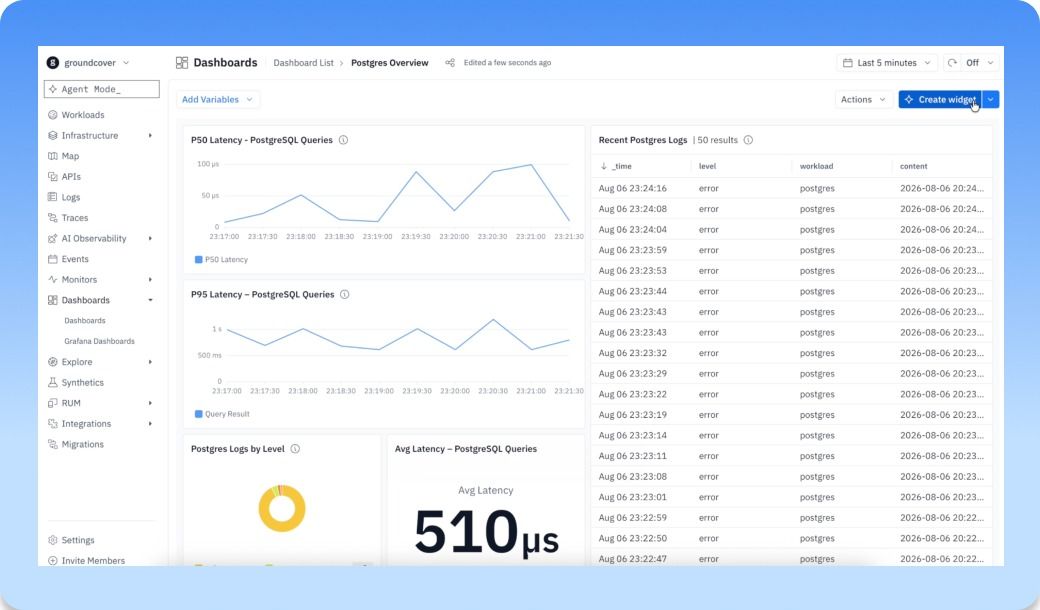
Images aren't only for troubleshooting. You can hand the agent a picture of the dashboard you want and let it build the real one. For example, sketch the layout you have in mind, a couple of latency charts, a logs panel, an average-latency tile, drop the drawing into Create New Dashboard, and the agent turns it into a working dashboard wired to your data. A whiteboard photo becomes a starting point instead of a to-do.
Other recent updates


Observability
for what comes next.
Start in minutes. No migrations. No data leaving your infrastructure. No surprises on the bill.