Weekly updates on new features, improvements, and fixes across groundcover.

Investigations, Autonomous Infrastructure, and eBPF Profiling
November 6, 2026
This changelog covers the last two weeks of work on the three big releases: Investigations, Autonomous Infrastructure, and Profiling. Investigations gives the groundcover agent a structured workspace for root cause analysis that you can follow, steer, and start automatically from monitor issues. Autonomous Infrastructure calculates and applies CPU and memory requests for your Deployments and shows the monthly cost impact in dollars. Profiling adds an opt-in eBPF profiler that collects CPU profiles without code changes. This cycle also adds statement and group drawers to database monitoring and multi-day offline buffering to the Linux sensor.
Investigations in Beta: a shared map for every root cause analysis
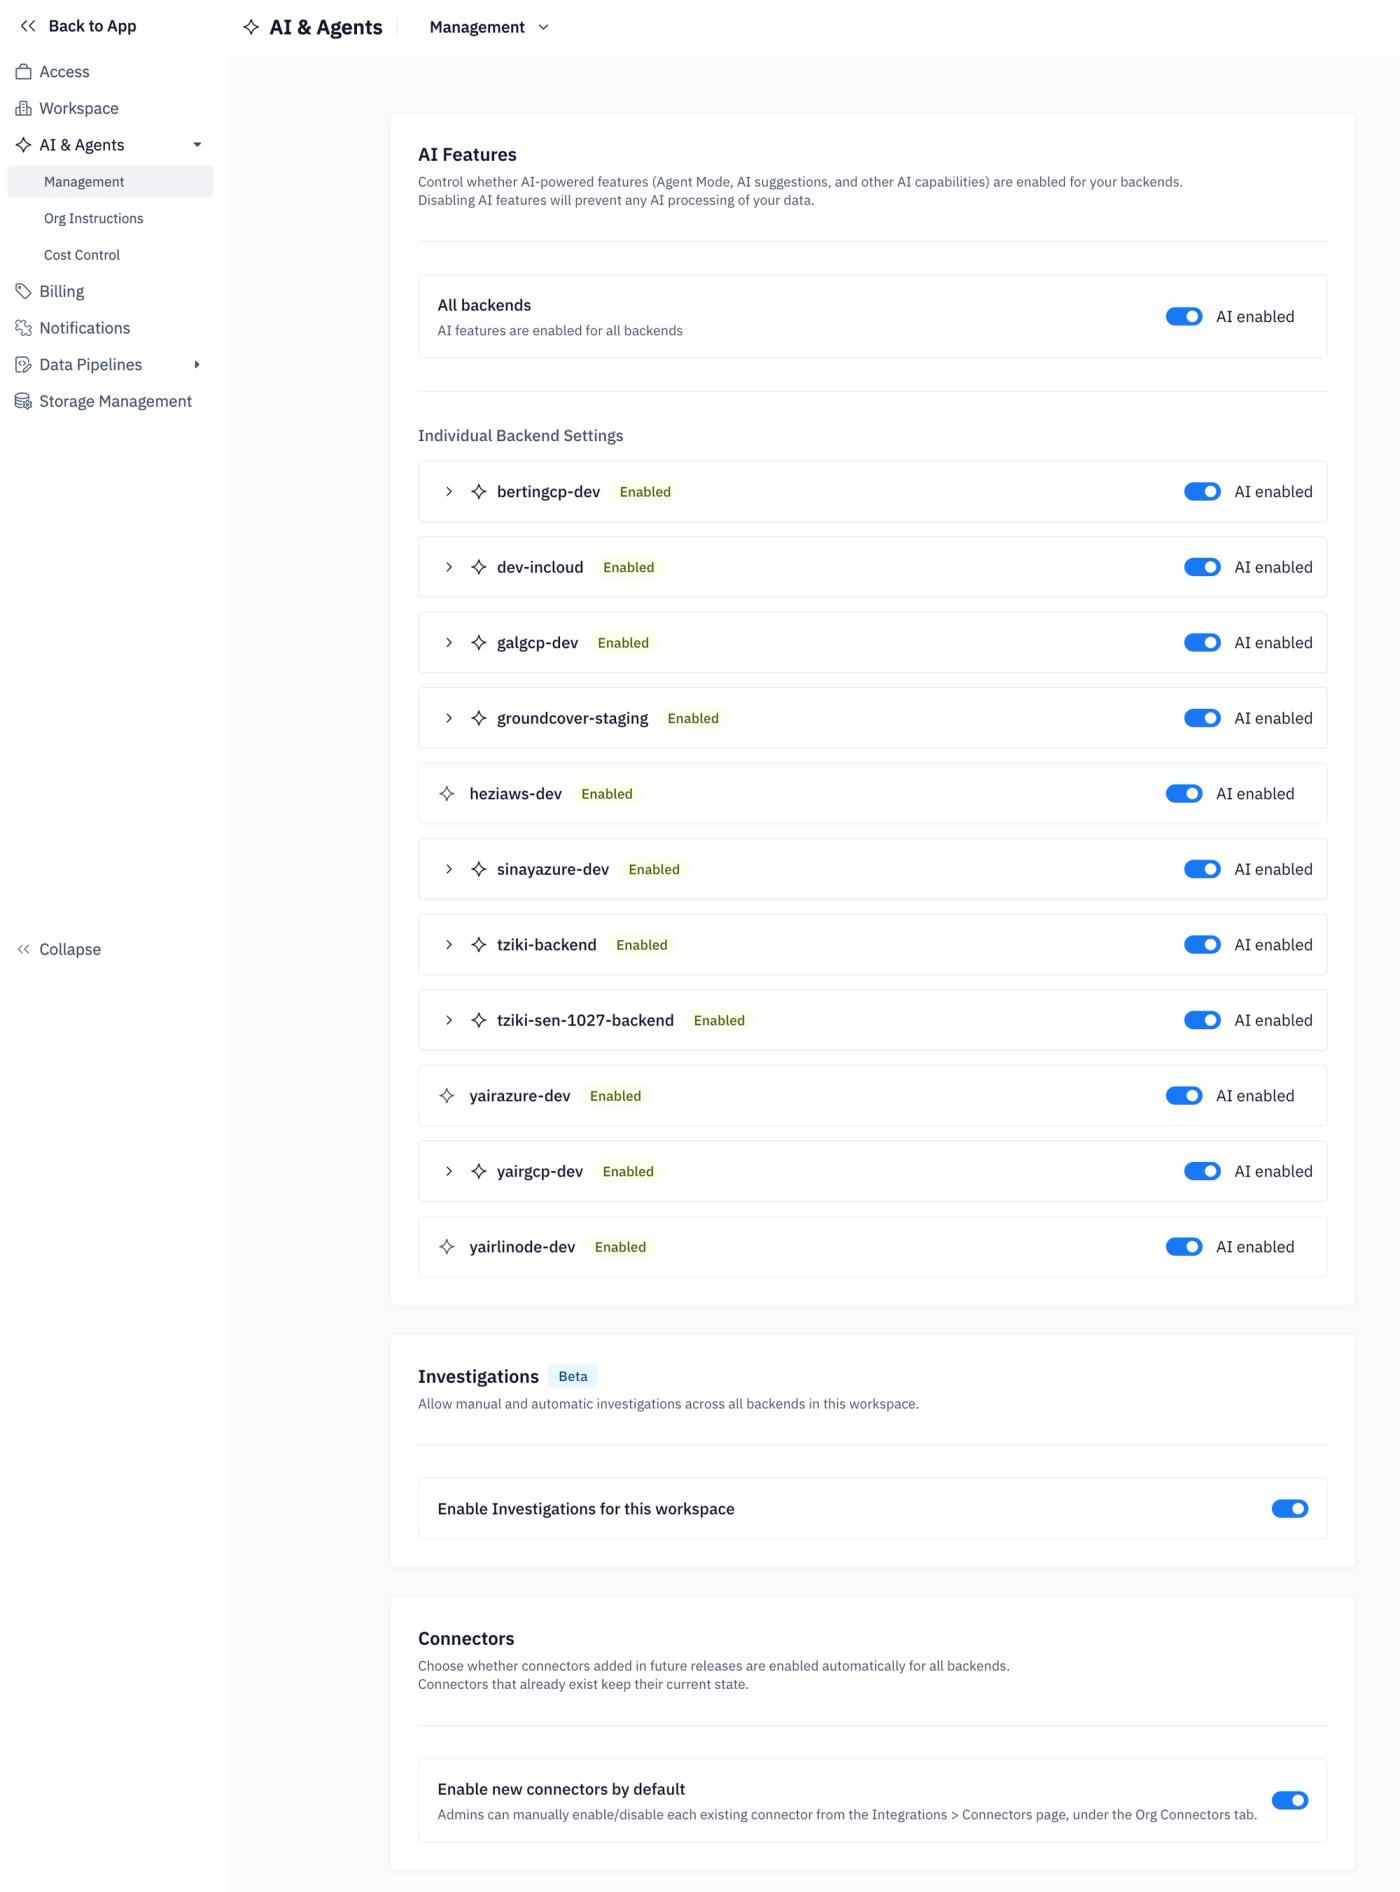
When a monitor issue fires, the groundcover agent can now open an Investigation to find the root cause. The Investigation page lays the work out as a map. The root question sits at the top, the hypotheses the agent proposes sit beneath it, and each hypothesis collects the questions, assessments, and findings that support or refute it. Each finding keeps its query, its source, and its original time range, so you can open the evidence in Explore and check the agent's work yourself. The page header shows counts for every node type, lists the contributors, and states whether a person or an automation started the investigation.
Work inside the investigation alongside the agent to add questions, assessments, and findings to any open node; mark a hypothesis Supported or Refuted; stop a single branch with a reason, or stop the whole investigation. You can also open the conversation of any running investigator to see what it is querying. When the investigation closes, the final conclusion lists the root cause, the impact, a timeline with linked evidence, suggested remediations, and the unknowns the agent could not confirm. Admins enable Investigations for the organization in Settings, and the feature ships as a Beta.
Autonomous Infrastructure: right-sized requests with a dollar figure attached
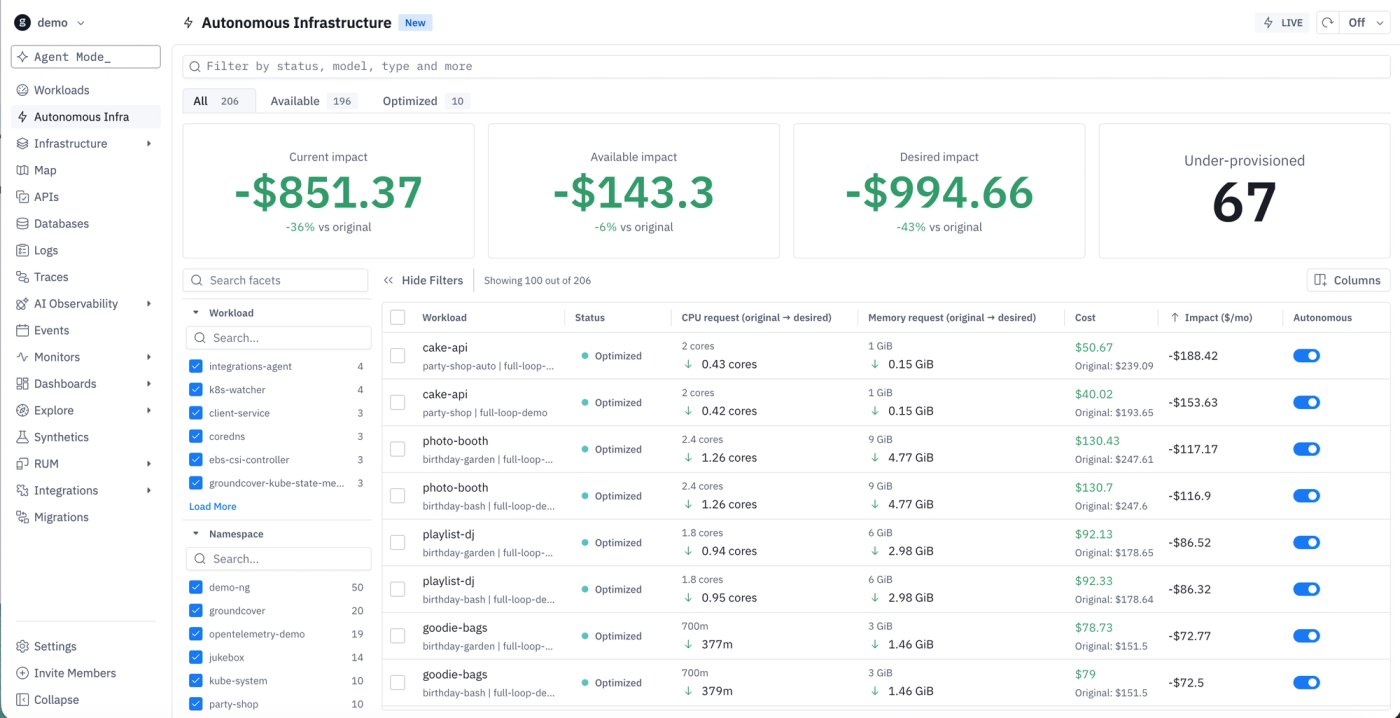
Teams usually set CPU and memory requests when a service launches and rarely revisit them. Over time, workloads reserve capacity they never use or run short during peaks. Autonomous Infrastructure reads each Deployment's actual usage and calculates a desired CPU and memory request for every container. When you turn Autonomous Infrastructure on for a workload, groundcover applies those desired requests for you.
The Autonomous Infrastructure page lists your workloads in All, Available, and Optimized tabs. Each row shows the original and desired CPU and memory requests, the monthly cost, and the monthly impact. Summary cards split the cost impact into Current impact (workloads already turned on), Available impact (workloads you have not turned on yet), and Desired impact (both combined). You enter your own price per vCPU-hour, price per GiB-hour, and discount, so the dollar figures reflect what you actually pay.
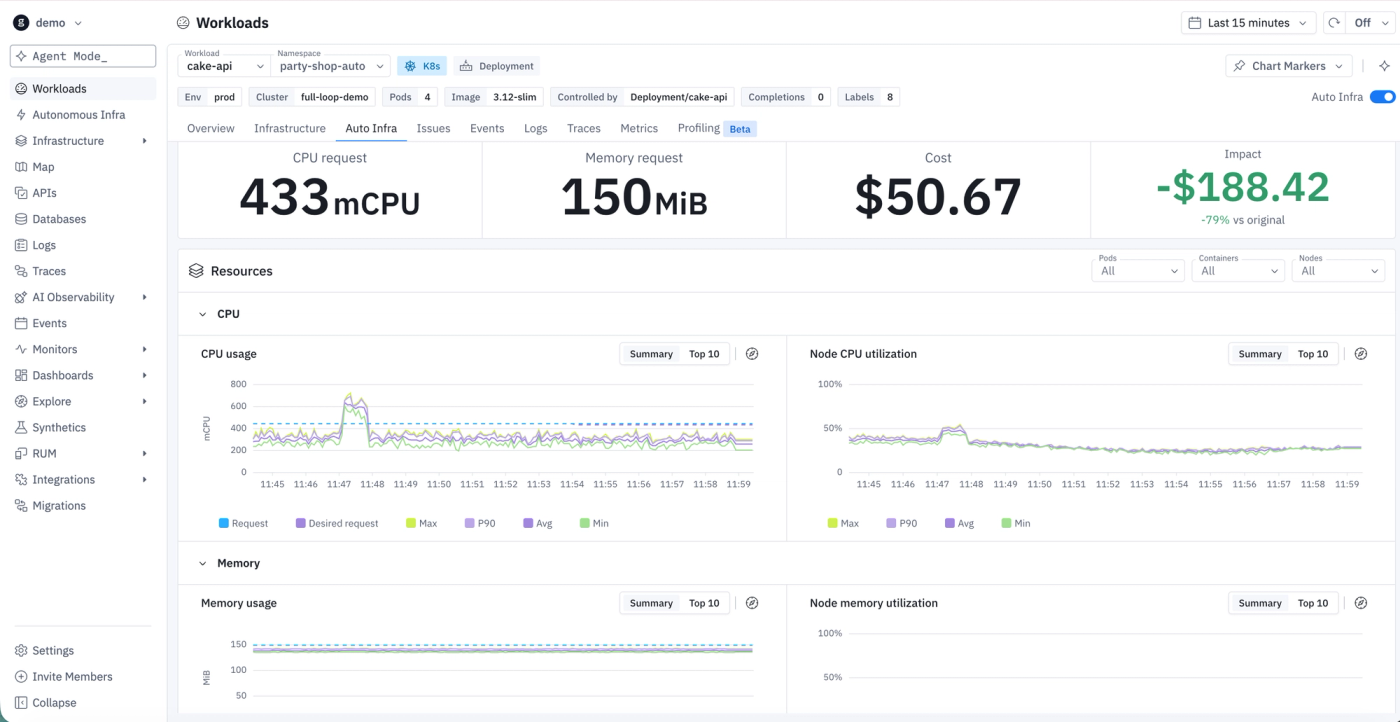
Every workload page also gets a new Auto Infra tab. The tab shows the workload's current and desired requests, its monthly cost and impact, and a toggle to turn Autonomous Infrastructure on or off. Below the summary, the CPU and memory charts plot the current request, the desired request, and actual usage, and the node charts show how much of each node's capacity the pods use.
Profiling: CPU profiles from eBPF, JFR support, and profile comparison
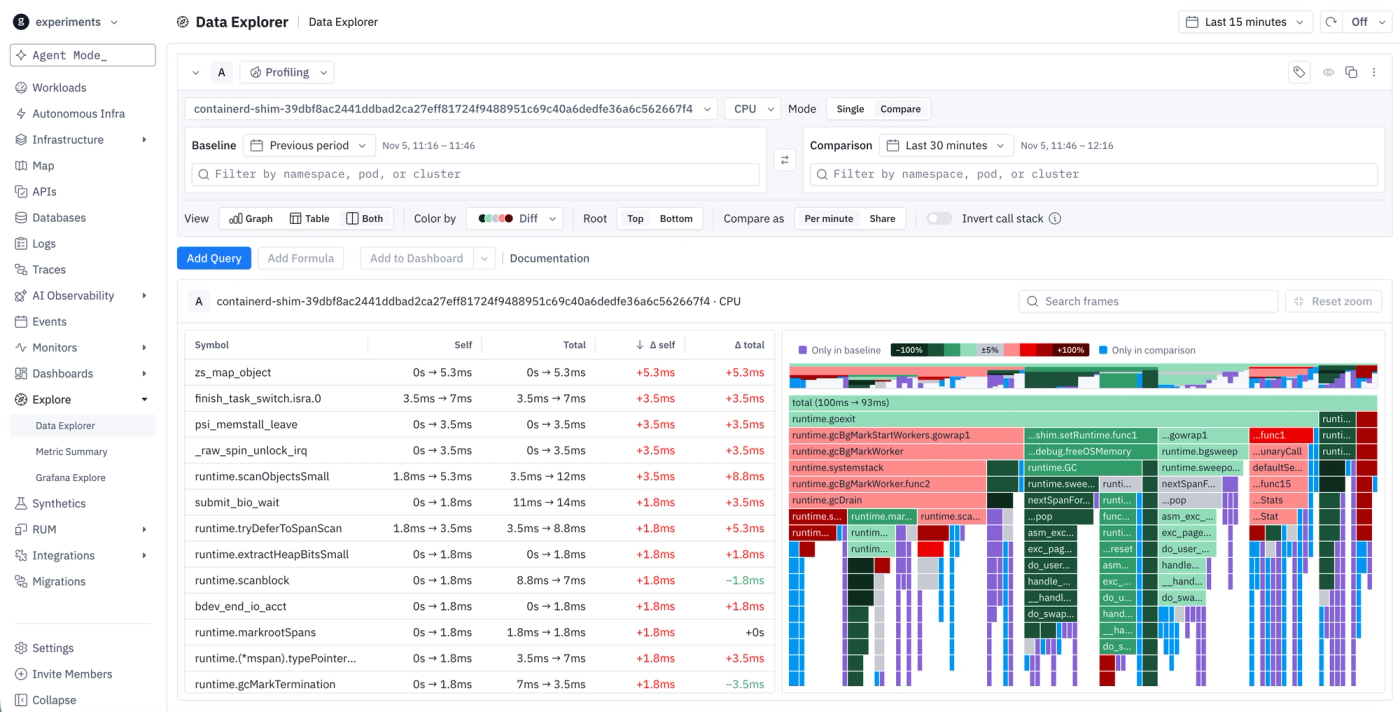
The groundcover sensor can now run the OpenTelemetry eBPF profiler as an opt-in sidecar container. The profiler samples on-CPU stacks on the node (20 Hz by default) and sends them to the sensor, which tags each profile with its Kubernetes workload. You get CPU flame graphs for your services without adding a profiling library or changing application code. You turn the profiler on in the sensor Helm values, where you can also set the sampling frequency, the reporting interval, and the sidecar's own resource limits. groundcover stores these samples as CPU time, so profiles from hosts with different sample rates add up correctly.
Java applications can now send Java Flight Recorder (JFR) profiles through the Pyroscope ingestion path. In Explore, Compare mode shows a differential flame graph of two time ranges or two sets of filters for the same workload, which shows you which functions got more expensive after a deploy. The groundcover MCP server also adds profiling tools that list available profiling data, rank the most expensive functions and their call paths, and compare profiles from before and after a change.
Database monitoring: statement and group drawers
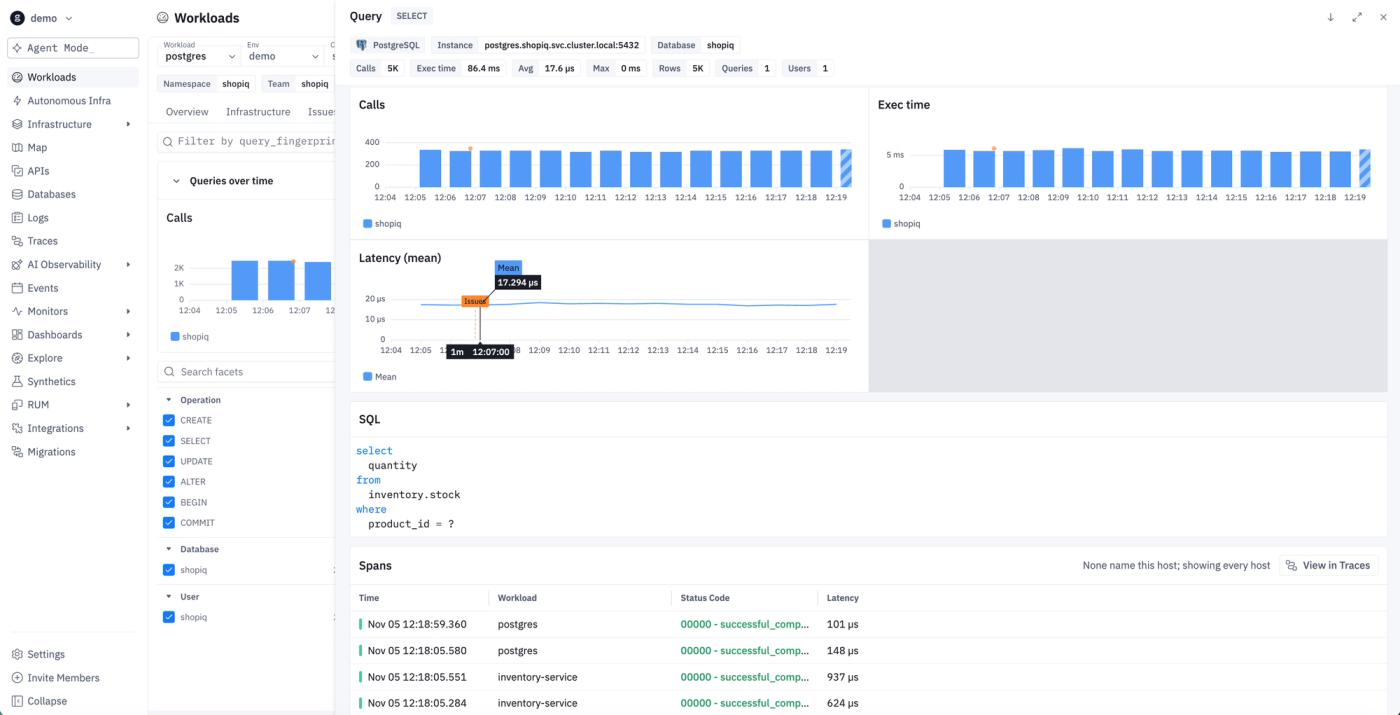
The DB Statements tab on a database workload now opens drawers with the detail behind each row.
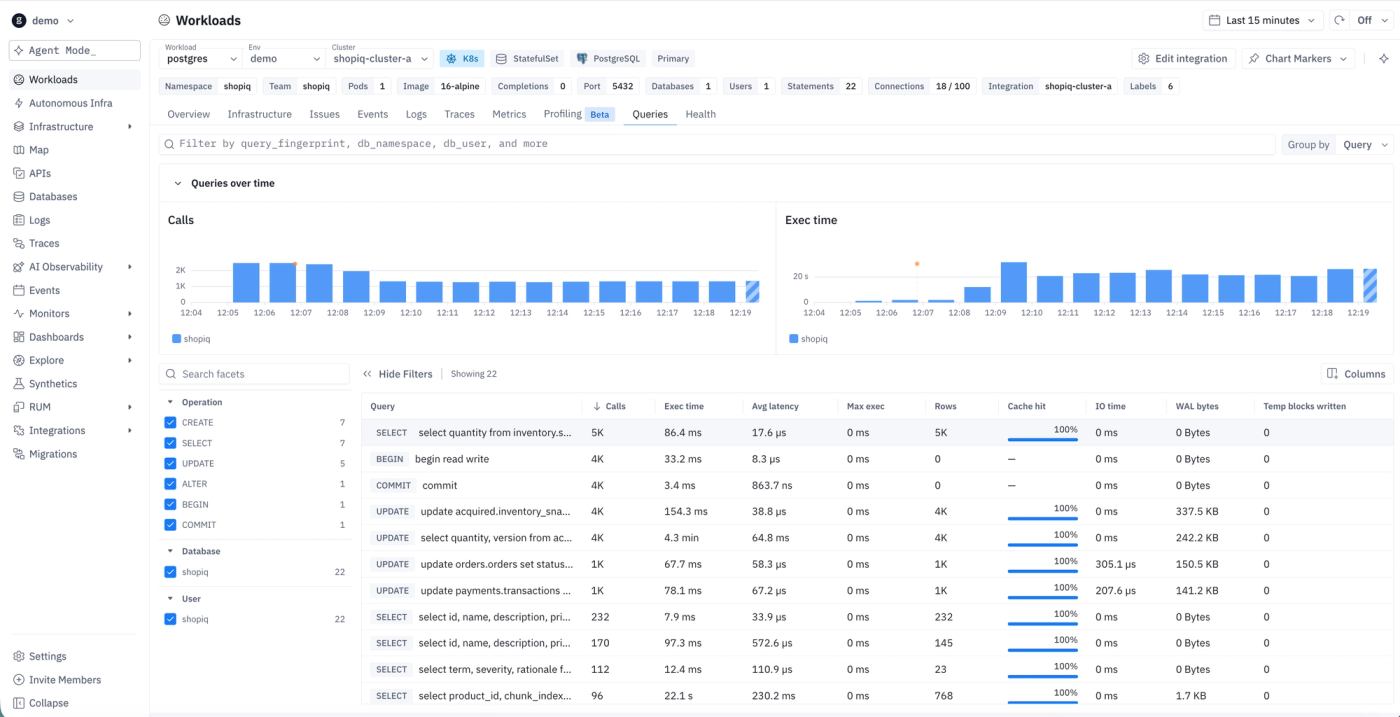
Clicking a statement opens a drawer with its calls, execution time, average and max latency, errors, rows, and clients, plus charts of calls, execution time, latency, and errors over time. The statement drawer also shows the formatted SQL and the most recent spans that ran it, with a View in Traces link that carries the same filters. Clicking a database, user, client, or operation opens a group drawer with the same signals for that group and its top statements by execution time. Each drawer has its own URL, so you can send a teammate a link to the exact statement you are looking at.
Linux sensor: 7+ days of offline buffering
Edge appliances and hosts on unreliable links can lose their connection for days at a time. The Linux sensor now buffers logs and host metrics locally for 7 days or more while the host is offline, including across reboots. When the connection returns, the sensor sends the buffered data with its original timestamps and rate-limits the backfill so the catch-up does not saturate the link. The install script supports hosts with a read-only root and /etc by keeping all sensor state under /data. On a fresh install, the sensor collects the last 24 hours of the systemd journal by default, which keeps a fleet-wide rollout from sending every host's full journal at once.
Other recent updates

Observability
for what comes next.
Start in minutes. No migrations. No data leaving your infrastructure. No surprises on the bill.