

Weekly updates on new features, improvements, and fixes across groundcover.


Faster, higher-quality dashboards from the agent, and an issues page built for investigation
July 30, 2026
Two things anchor this release. groundcover Agent Mode builds for you across the platform and it does so even better. You can create a dashboard faster with the groundcover Agent, and the result is better than the old create flow gave you. The issues page got a real redesign around how customers actually investigate an alert, with that same view now showing up in Slack when a monitor fires. We also released cost monitoring on AWS, easier dashboard management from the outside, and the usual round of improvements and fixes below.
Dashboards the agent builds for you, faster and higher quality
Building a good dashboard by hand takes time, and last update the agent could already add a widget without leaving the dashboard. This goes further. groundcover Agent Mode acts like an engine that builds assets across the product, backed by a set of specialized agents that each know how to put a particular thing together within groundcover. The components Agent Mode builds with were promoted to make that possible and now act like first class citizens.
Ask Agent Mode for a dashboard and you get one that's closer to what you wanted on the first pass, built faster than you'd build it yourself. The creation flow got quicker and the output quality went up with it, so the agent is doing real work for you instead of handing back a rough draft you have to redo.
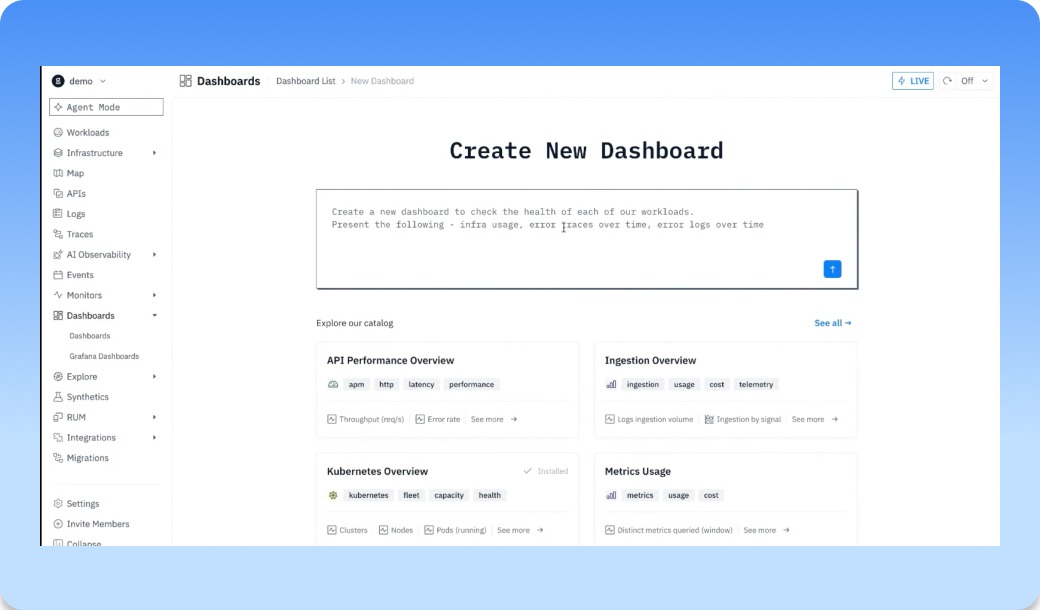
For example, check the health of each workload and the agent knows to bring in infrastructure usage, error traces over time, and error logs over time. You describe the outcome you want, and it figures out which panels that takes. On the back end the groundcover agent is coordinating with other specialized agents to make this happen efficiently and effectively.
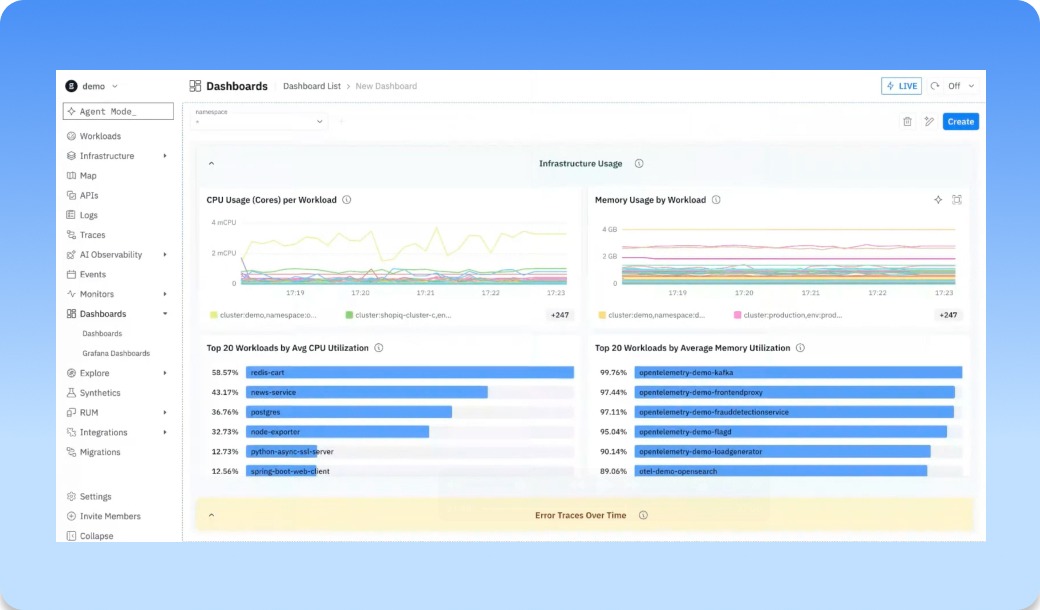
groundcover Agent mode returns a complete, populated dashboard on the first pass. The panels you'd have assembled by hand, are wired to your live data and laid out for you. The success of this creation is a reflection of the way the groundover agent is successfully orchestrating agents and tooling. This is the real magic behind this feature.
An issues page built for investigation, and the same view in Slack
An alert is only valuable if you can act on it, and the old issues page didn't give you enough to go on. It's been redesigned around the investigation. Open an issue and you can see when it fired and which labels are tied to it, follow a much clearer timeline, tell whether a silence rule was in play, and drop into an issue-context section to dig through the related logs without leaving the page. There's a full-page issue view now too, so a busy issue has room to breathe.
The same view follows the alert into Slack. A new export service pulls the issue timeline graph straight from monitors and attaches it to the notification, so when a monitor fires you get the timeline as an image right there in the channel instead of a bare "something's wrong" line. What you'd see on the issues page is what lands in Slack. That export service also backs dashboard PDF and widget PNG exports, so the same plumbing covers the other things you've wanted to send out of groundcover.
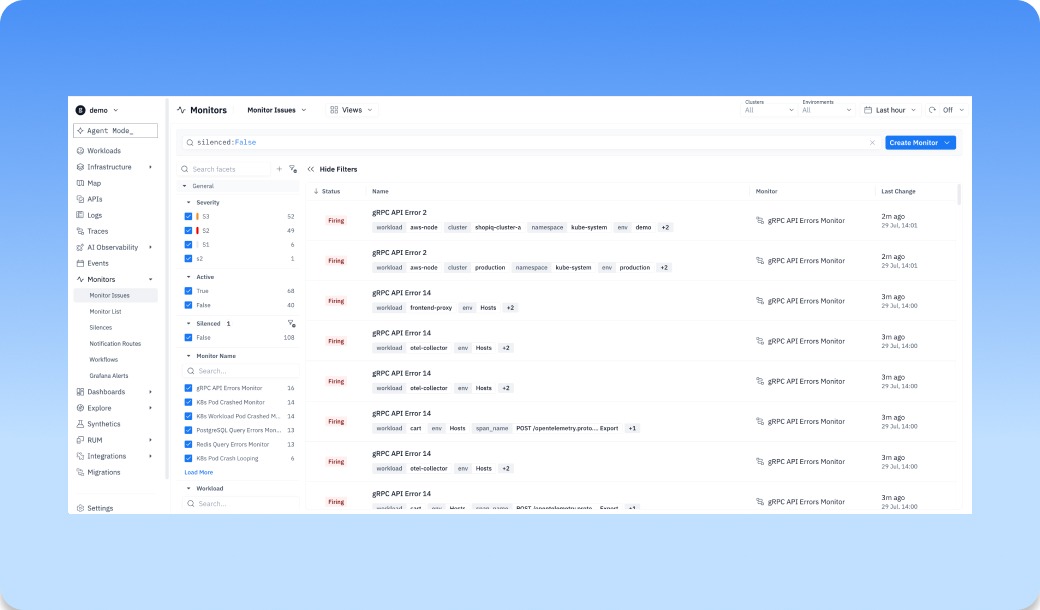
Start here to see everything that's currently firing, then click into any issue to open the full detail view.
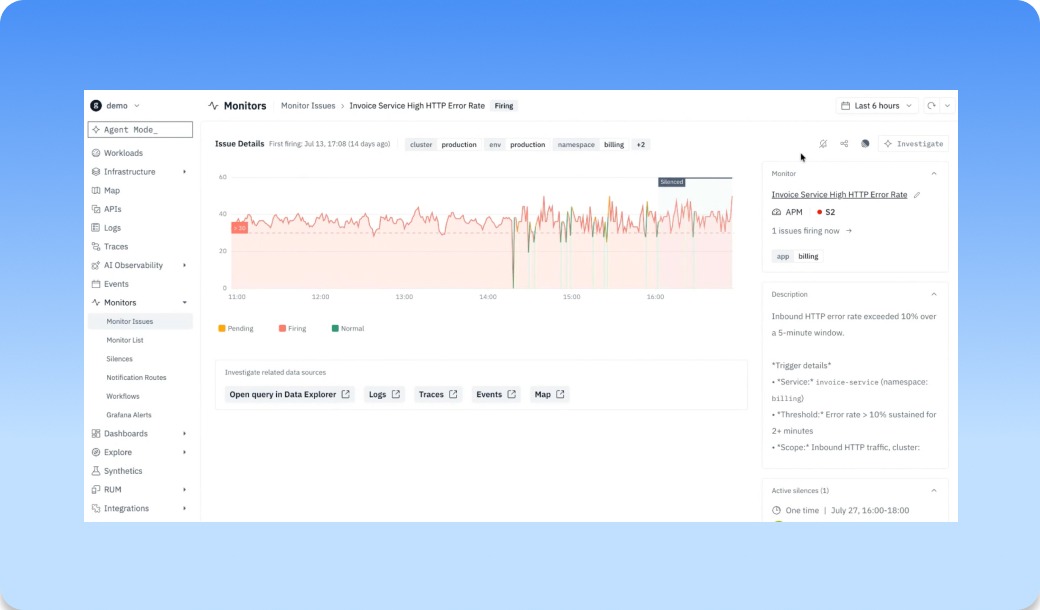
See at a glance when the issue was firing, when it wasn't, and when it was silenced, with a description for context. Questions like "what happened with this monitor, and was it silenced or actually normal?" are answerable without leaving the page.
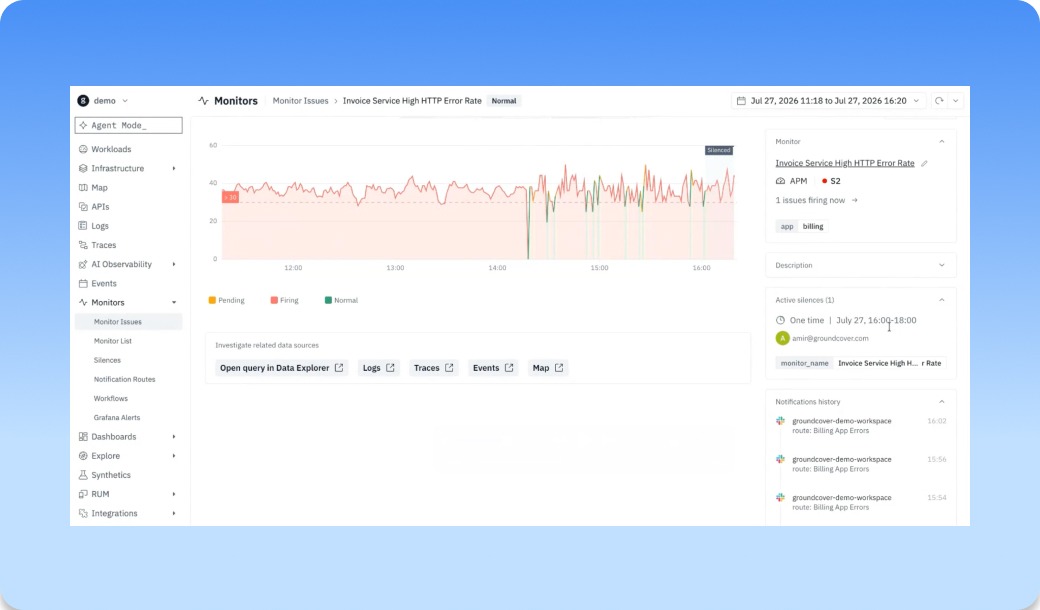
Scroll down and you see which silences were affecting the monitor and a full notification history — who was alerted, and when. It's one place with all the context around the issue, preserved at the granularity it actually happened, so the record reflects the reality of the moment instead of a summary of it.
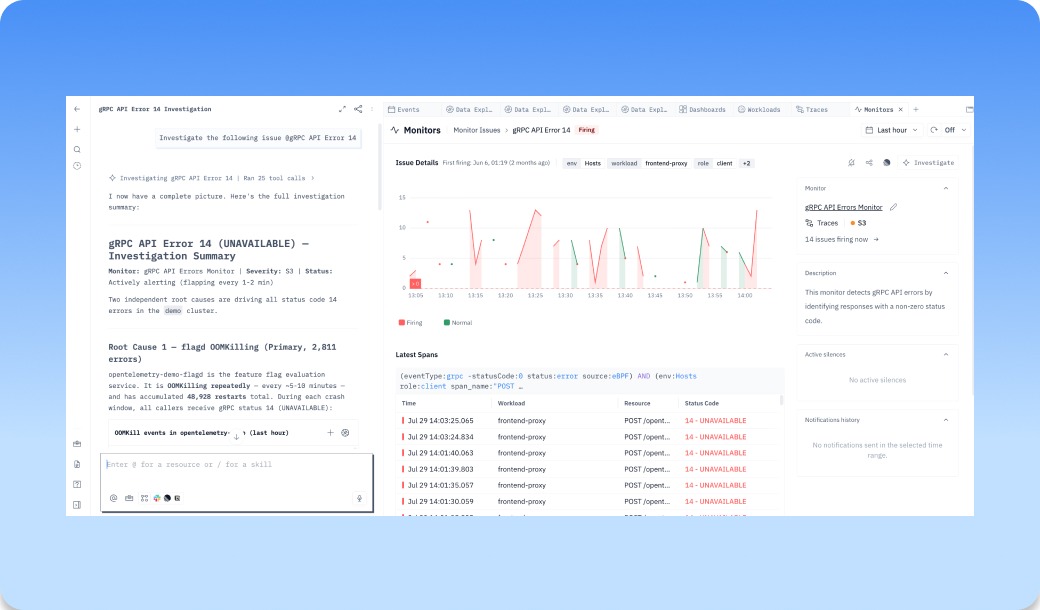
Add any issue to the agent with the Investigate button and it picks up the context and takes the investigation further for you, right from the same page.
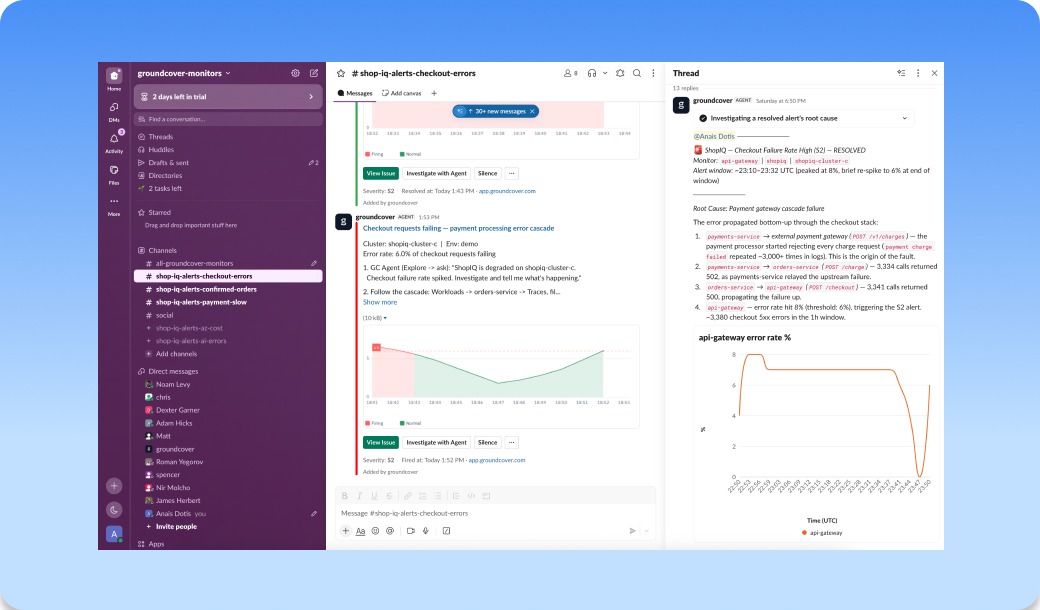
When a monitor alerts in Slack you get the issue timeline right there in the channel, so you can size up what's happening without switching tabs. Then pull @groundcover into the thread to jumpstart the investigation where the conversation already is.
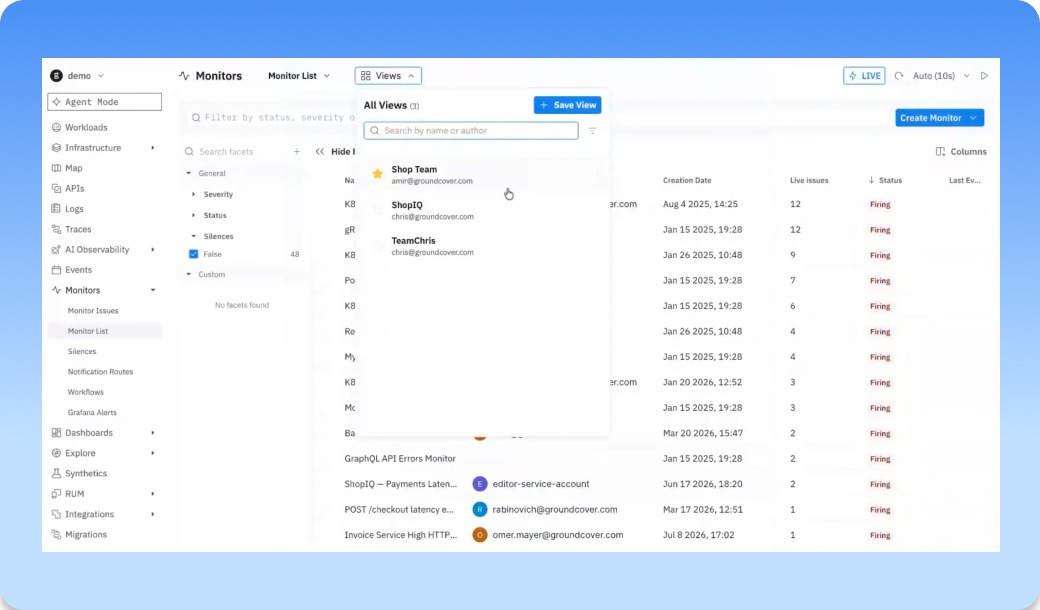
Save a view scoped to your own labels so you can search monitors by what matters to you and land straight on the ones for your service.
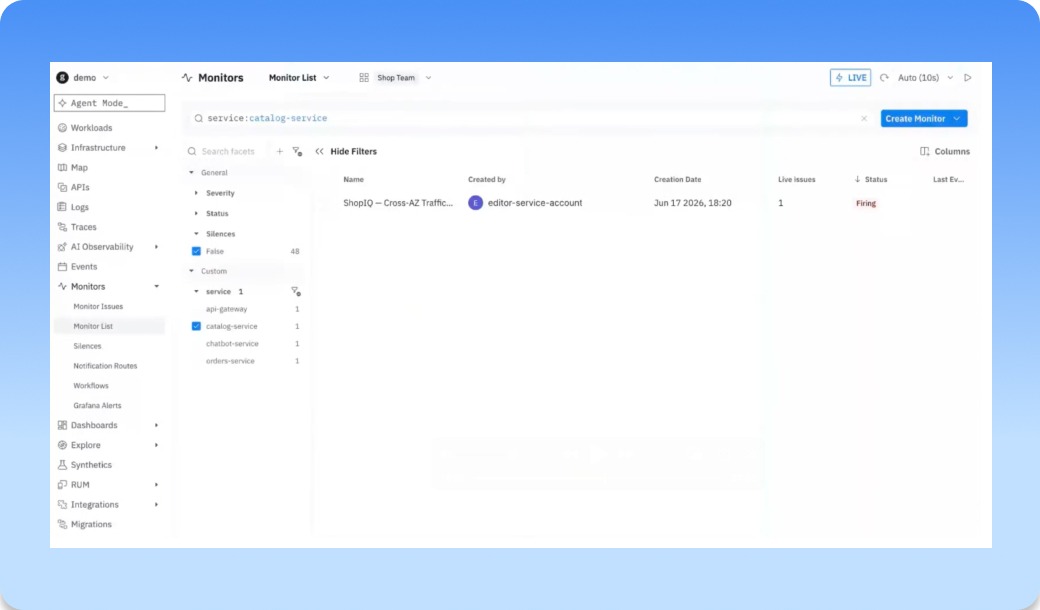
Pick a saved view and the list narrows to exactly the monitors behind that label.
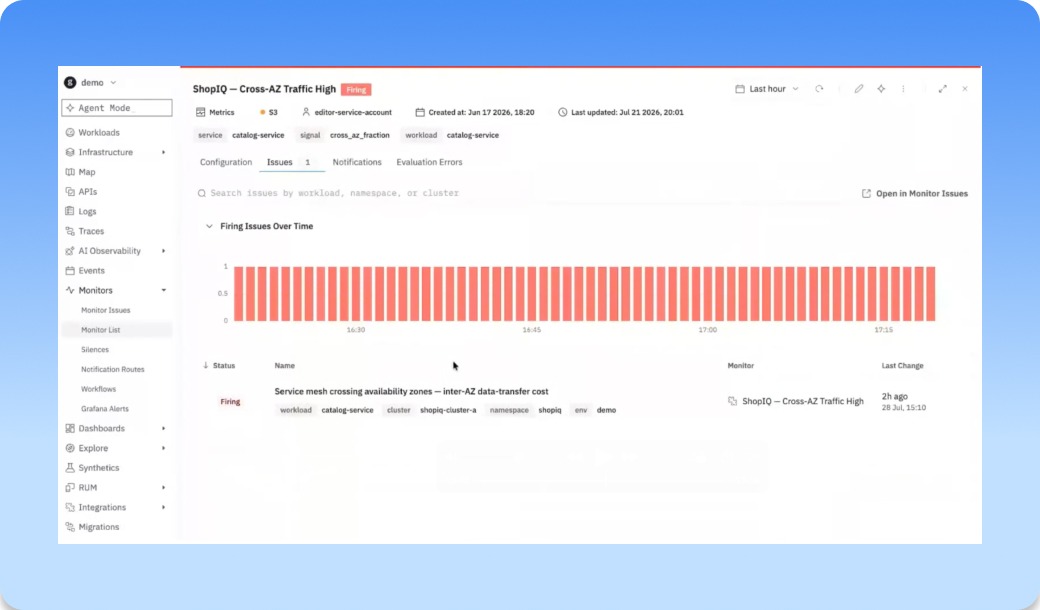
Open a monitor from the Monitors List and the Issues tab charts its firing issues over time, so "was this monitor noisy? does it have a pile of open issues?" is a quick read. The Configuration and Notifications tabs lay out how the monitor is set up and what its notifications are doing.
Monitor your AWS cost and catch it before the bill does
AWS Cost showed up as a data source last update. Now you can put a monitor on it. Build an alert on your cloud spend the same way you alert on latency or errors, and groundcover tells you when cost is trending somewhere you don't want it to go, before the invoice does the telling.
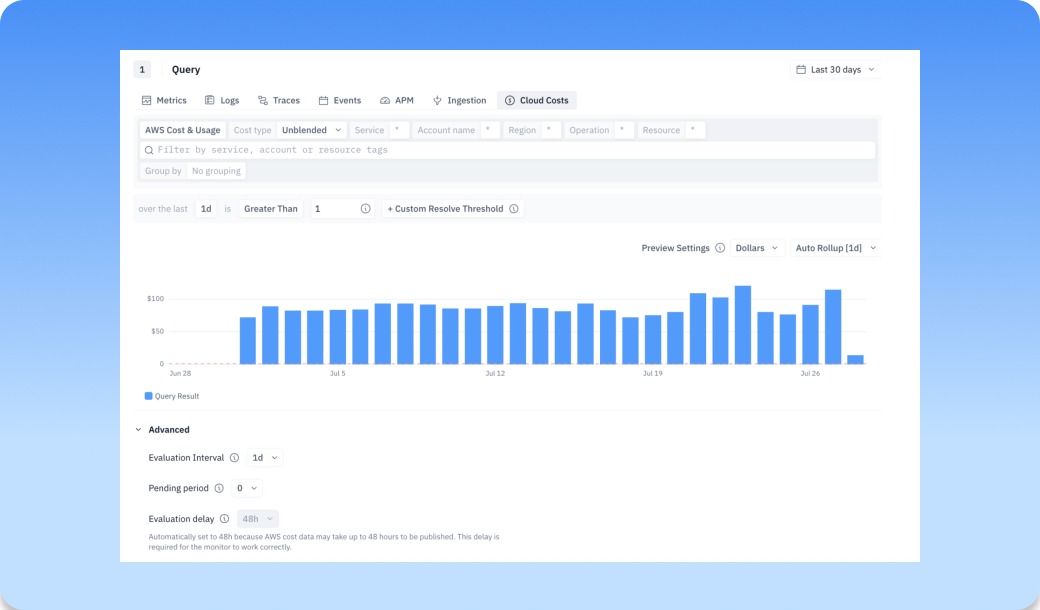
AWS cost metrics arrive late, so groundcover auto-detects them and sets an Evaluation Delay automatically — the monitor only evaluates data that's actually landed, which is what keeps a spend alert accurate instead of jumpy. No Data is a first-class monitor state now too, with a Treat No Data As control, so a gap in cost reporting reads clearly rather than looking like everything's fine. It's a small piece of a bigger value set at groundcover: your o11y tool should put you in control of your data and your spend by providing you with the tools to monitor cost, predict cost, drop data, parse data, and process data. This commitment to giving you control isn’t just inseparable from groundcover's BYOC architecture, BYOC architecture enables and promotes these features.
Dashboards you can manage from the outside
Once you have more than a handful of dashboards, finding the right one becomes the job. You can now search across names, tags, owners, and descriptions to get to it, and tag dashboards so a set stays organized. Tagging has been asked for since we shipped dashboards, and it's the piece that makes a big library manageable instead of a wall of tiles.
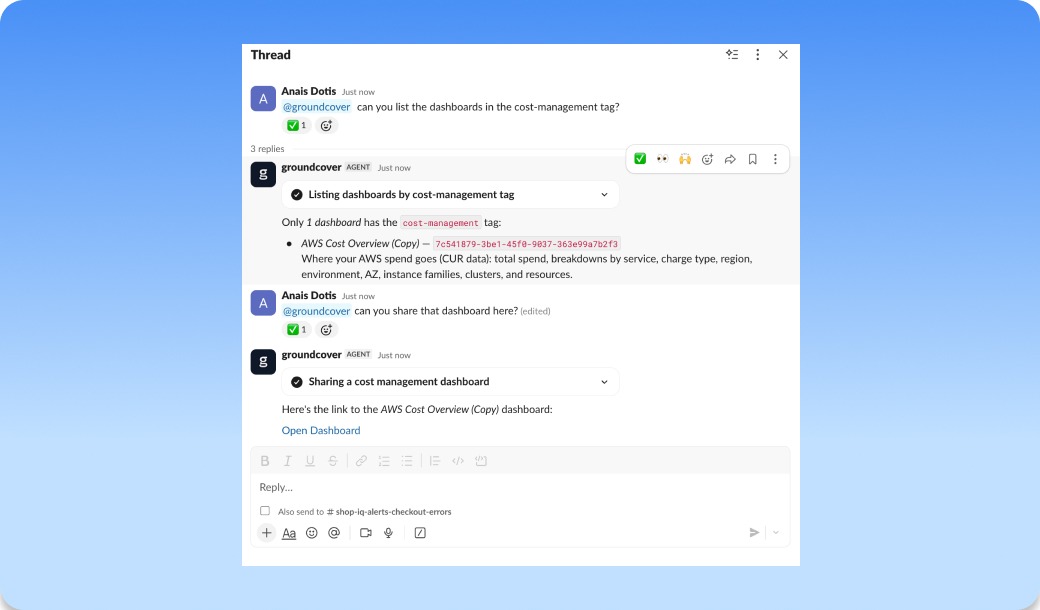
Tag related dashboards and you can pull the whole set by its tag — here from Slack — or browse and organize them by tag inside groundcover, so related resources stay grouped instead of scattered across a wall of tiles.
Variables got more capable in the same spirit. You can apply a variable to specific widgets now, with finer control over where it takes effect, so a templated dashboard bends to what each panel actually needs.
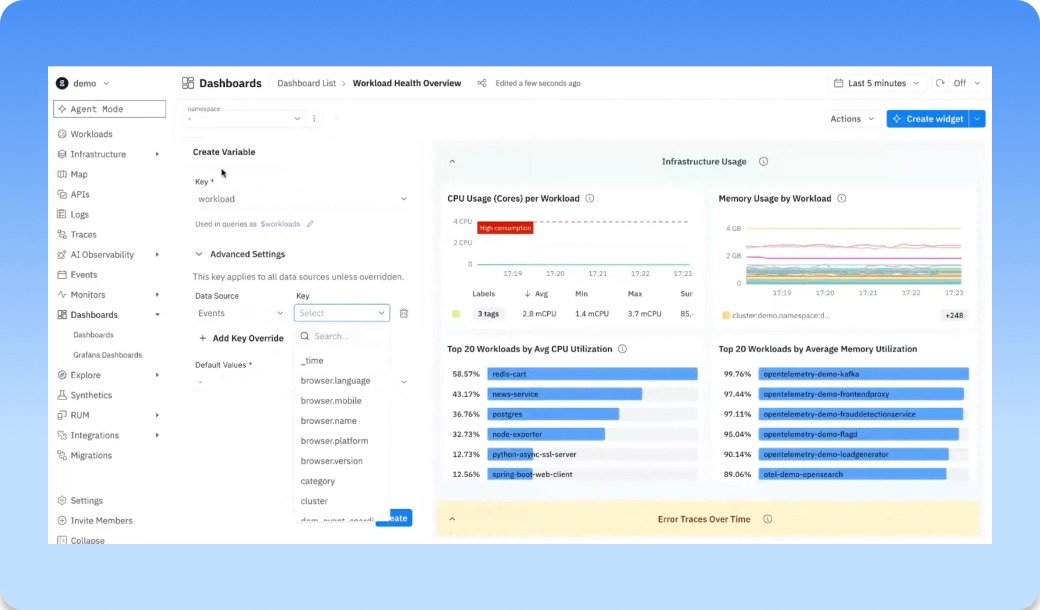
Map one variable to whatever each source calls the field, so a single templated dashboard works across a mix of data sources instead of forcing a duplicate per source.
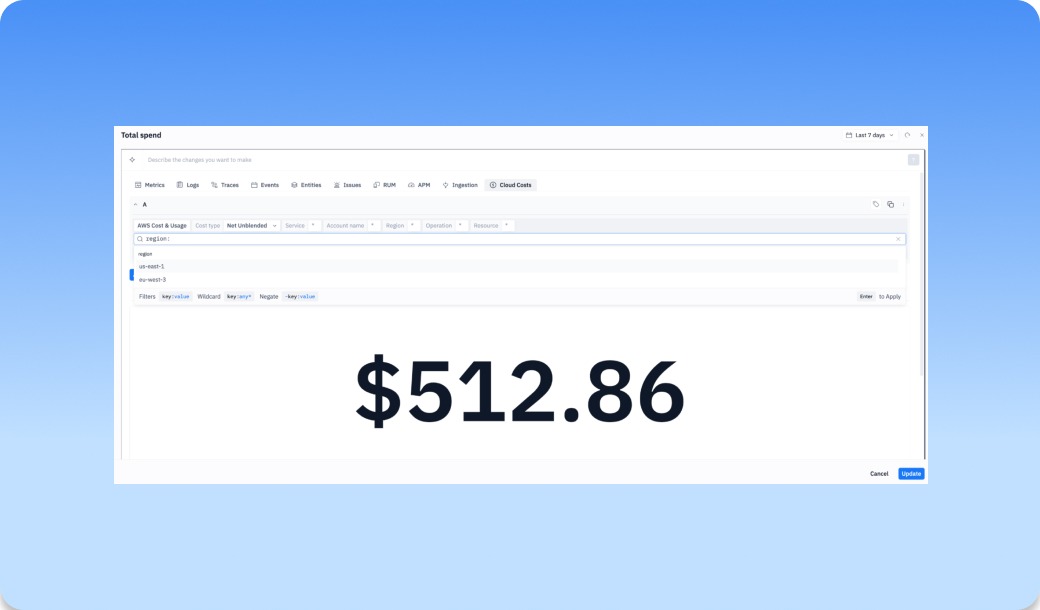
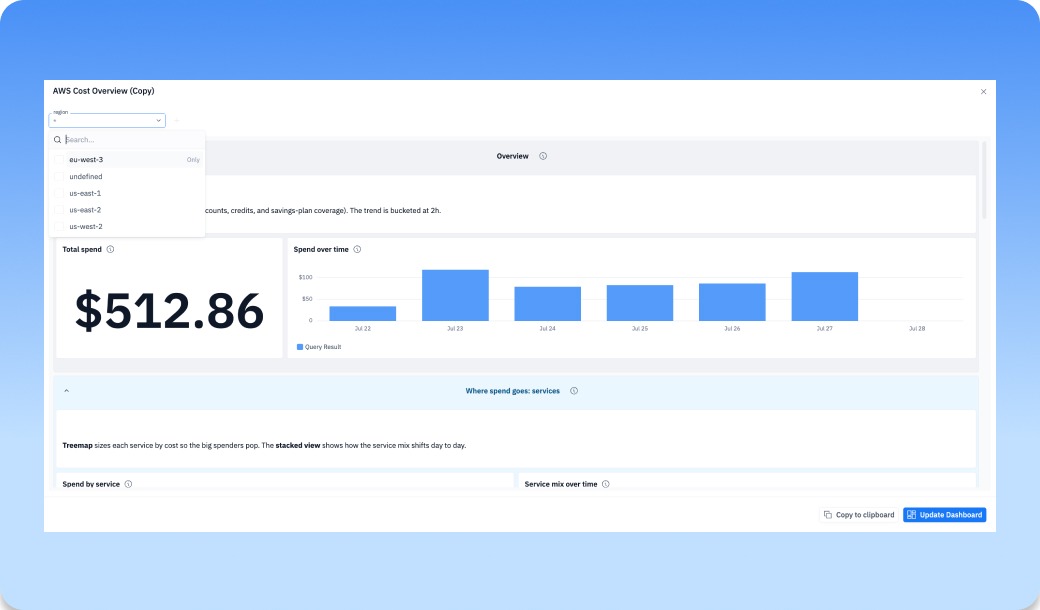
Point a variable at only the widgets that should respond to it, so one panel can filter independently while the rest of the board stays put.
Improvements
- Dashboards | Widgets can carry descriptions and show table row counts
- Dashboard | Explore results can be added straight to a dashboard as a widget.
- Dashboard Catalog | A new APM catalog pack ships ready-made dashboards for API performance, service detail, gRPC, DNS health, and dependencies.
- Integrations | Integrations can run from a specific cluster now, instead of only from the backend.
- Logs & Pipelines | Troubleshooting actions on a pipeline rule jump straight into filtered log and trace views.
- Access | Wider RBAC coverage for ingestion metrics, and steadier Terraform/provider behavior when a data scope comes back empty.
- Terraform | New Terraform resources let you manage storage retention policies as code.
Bug Fixes
- Dashboard Catalog | Catalog previews open on sensible default timeframes, and AWS CUR dashboards are hidden on backends that don't support them.
- Monitors | Fixed active silences blocking resolve notifications, Slack app destinations for Editors, wrong notification thresholds, and monitor-template label collisions.
- RUM & Logs | Non-RUM traces no longer clutter session network views, and session-drawer log links open the exact log drawer.
- Agent | Fixed chat input overflow, and Slack app mentions now trigger AI-backed responses correctly.
- Slack Connector | You can install the Slack app from the destinations page now, not just the connectors page.
Other recent updates
Observability
for what comes next.
Start in minutes. No migrations. No data leaving your infrastructure. No surprises on the bill.













.svg)