


Weekly updates on new features, improvements, and fixes across groundcover.

More of your stack in view, and an agent you can steer
August 27, 2026
This update widens what groundcover can see and tightens how you work with the agent. Mobile joins RUM, databases and Azure Application Insights come in as new sources, the widget builder got rebuilt, and the agent picked up two real controls: run its tools asynchronously so it can talk to other agents, and steer an investigation while it's still running.
Agent to Agent communication via Asynchronous MCP execution
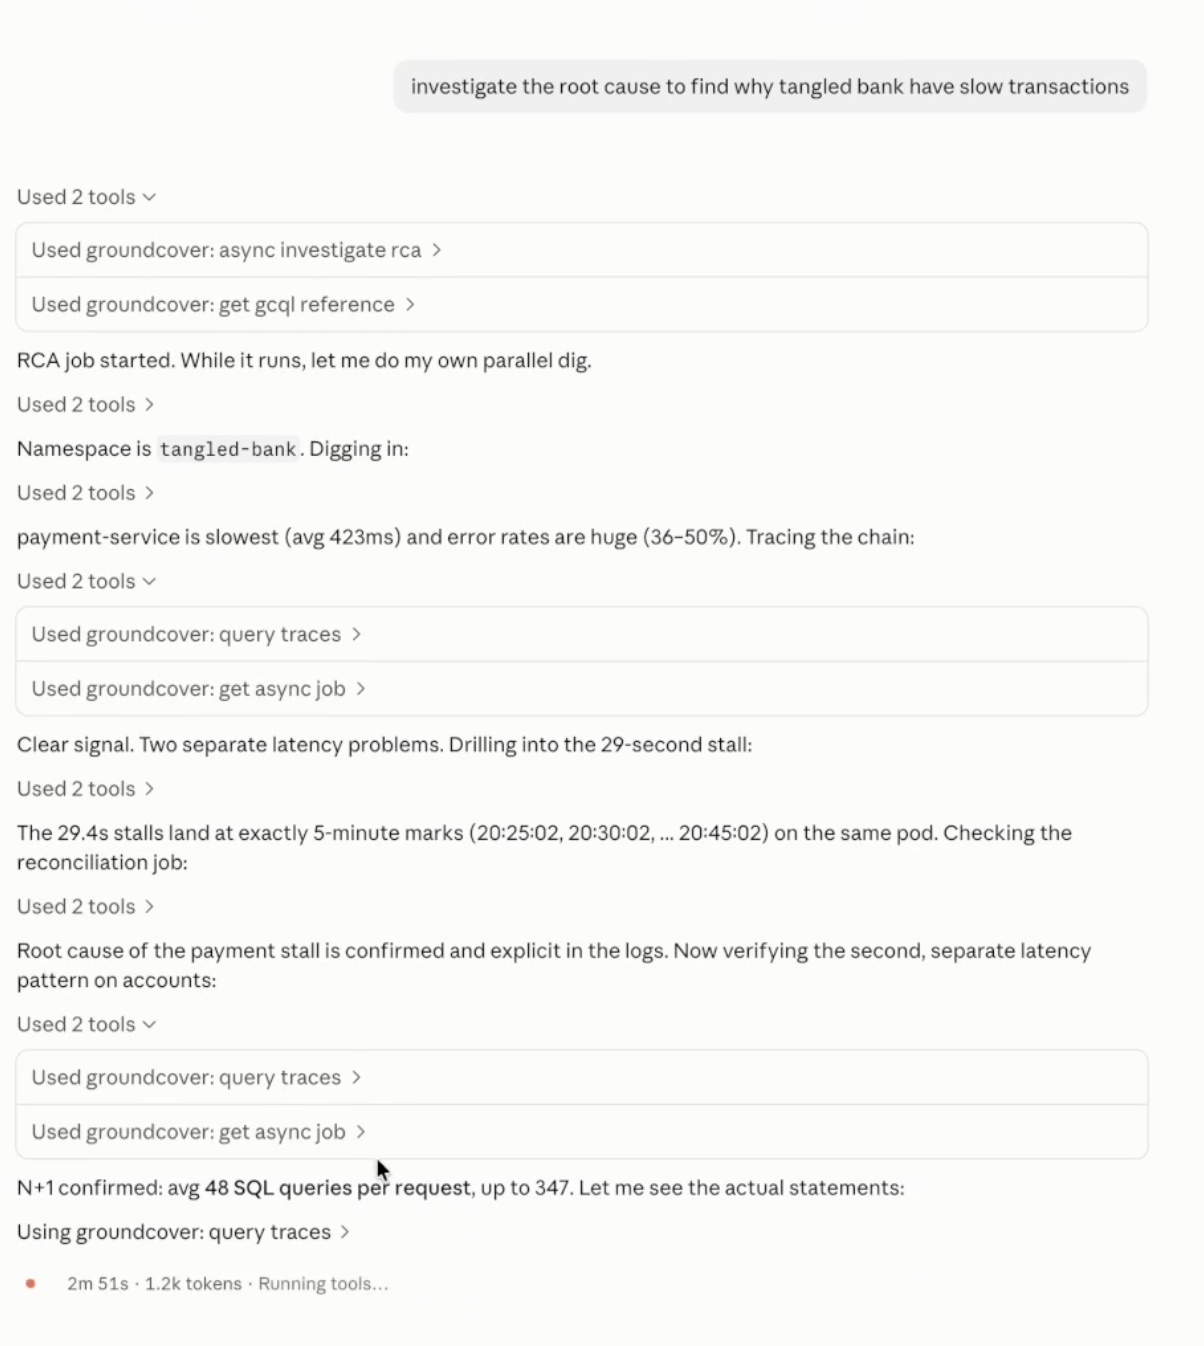
The real unlock here is agent-to-agent communication. groundcover's agent exposes its work as tools over MCP, and until now those tools ran synchronously so the server held the caller's request open for the entire run. In other words, it couldn’t run anything else in parallel. For agent-backed work that's a bad fit: a single run can take anywhere from seconds to minutes, long enough to trip client, gateway, or request timeouts, and it kept a connection pinned the whole time.
Async execution removes the ceiling. An agent-backed tool now starts its run and hands back a job handle right away instead of blocking; the caller checks back for status and collects the result when it's ready, or cancels it, and the run is free to outlast any single request. So another agent can hand work to groundcover's agent over MCP, go do other things, and pick up the result when it lands. The two agents coordinate as peers instead of one sitting blocked on the other. It's the groundwork for groundcover's agent to take part in a larger system of agents, and much of the automation coming next is built on it.
Steer the agent mid-run or add more prompts to the queue
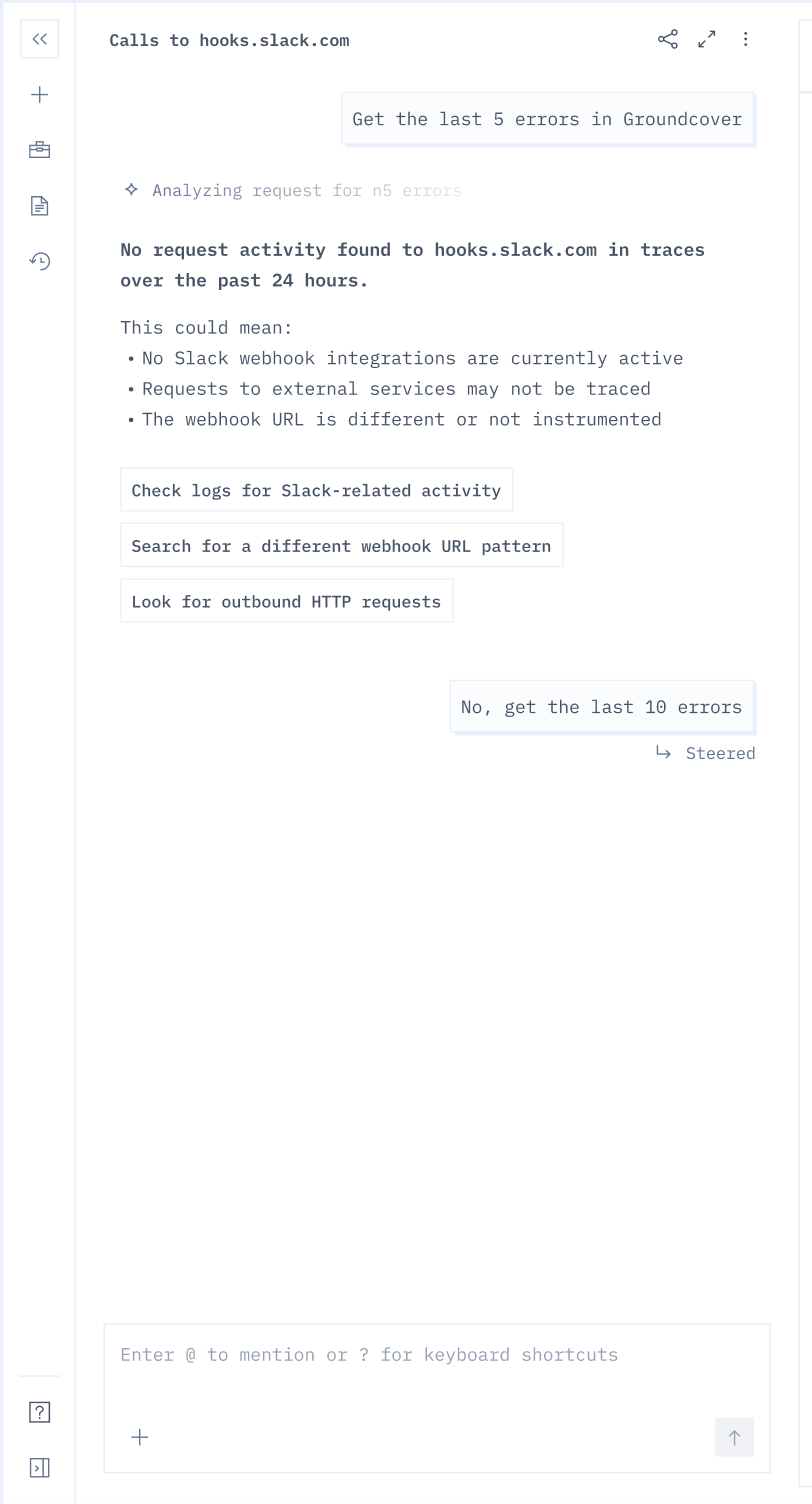
An agent investigation is only as good as the evidence it picks up, and until now, if it latched onto something misleading, you had to let the run finish and start over. Now you can steer it while it's still working. Mid-investigation, you can tell the agent live that a piece of evidence is wrong and to continue without it, or hand it new evidence to fold into its reasoning on the spot. Instead of watching a run head down the wrong path, you correct course in the moment and keep the investigation moving.
It turns the agent from something you kick off and wait on into something you can actually direct, which is what you want when you're the one who knows the extra context it's missing.
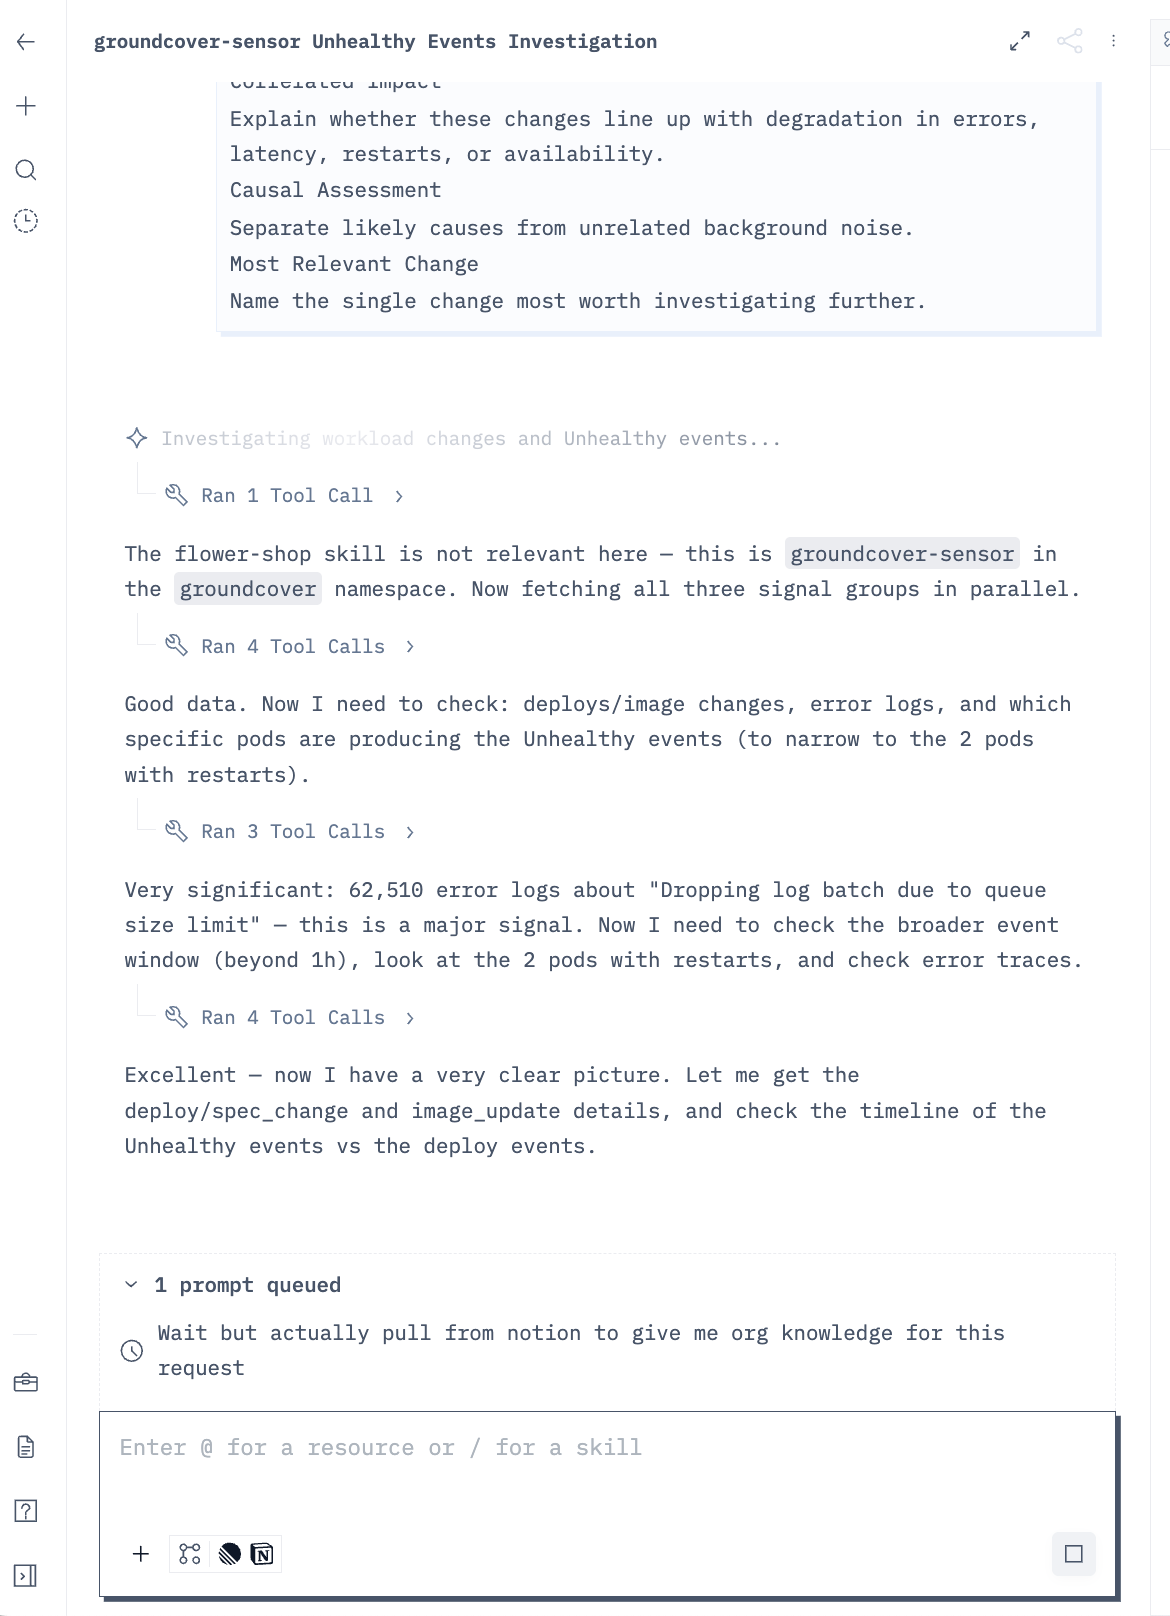
You can also add prompts to the agent’s queue. Adding prompts to the queue enables you to include follow up items you want the agent to tackle after it’s completed its current task. Whereas steering can be used to add urgent feedback to the currently running turn.
Mobile RUM (Alpha for design partners, Beta for customers end of Q3)
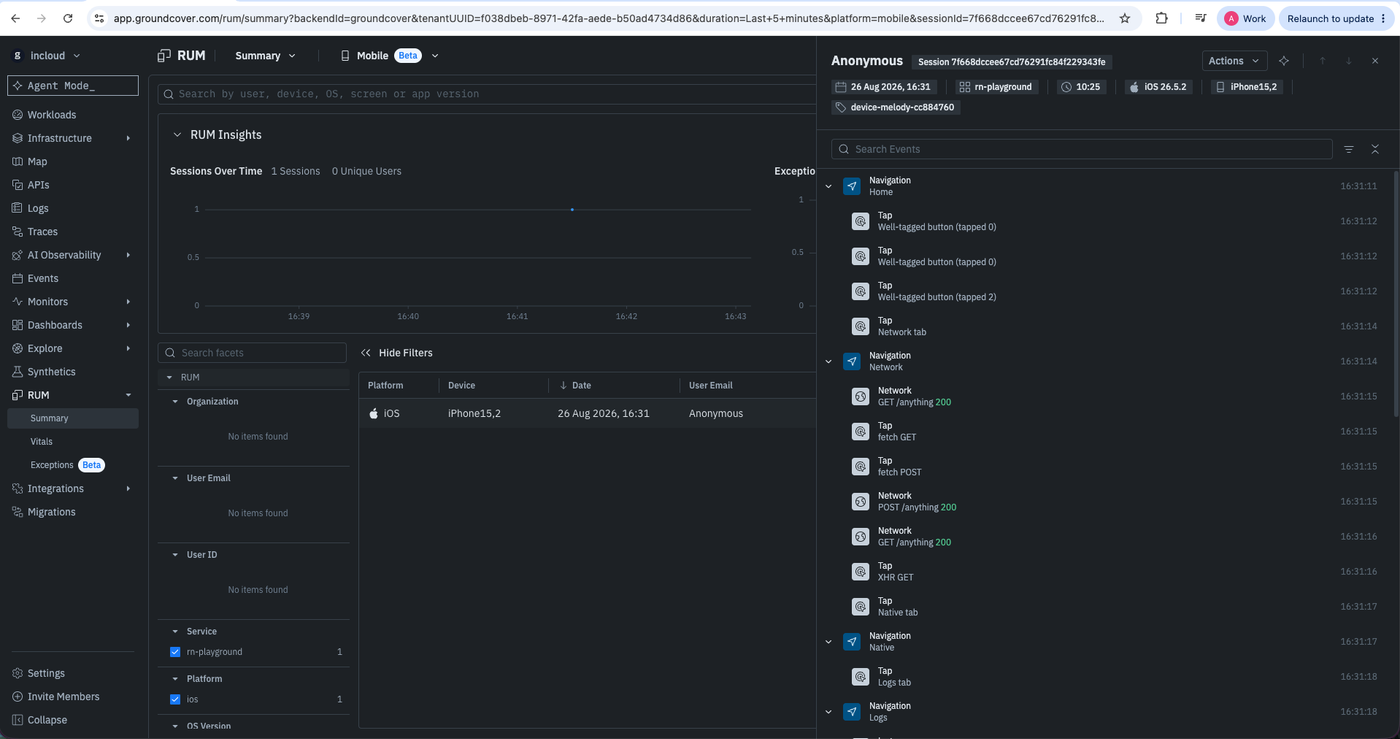
Until now, RUM stopped at the browser, and the mobile app side of your product was a blind spot every time something broke on a phone. Mobile RUM closes it. The groundcover React Native SDK brings your iOS and Android sessions into the same RUM views you already use for web. Each session is laid out event by event (screen navigations, taps and gestures and network calls), so you can retrace exactly what the user did before a crash or a slow screen. On top of that it captures the mobile-native signals a browser SDK structurally can't: native crashes, ANRs and app-hangs, cold and warm app-start with time-to-interactive, and slow and frozen frame rates. It's one of the most-requested features customers have asked us for, and it lands in Beta for customers end of Q3.
Mobile is where a lot of user pain lives and the hardest place to reproduce a bug. Seeing the session broken down into the navigations, taps, and requests behind it is much easier than working backward from a stack trace.
Database Monitoring for PostgreSQL and ClickHouse
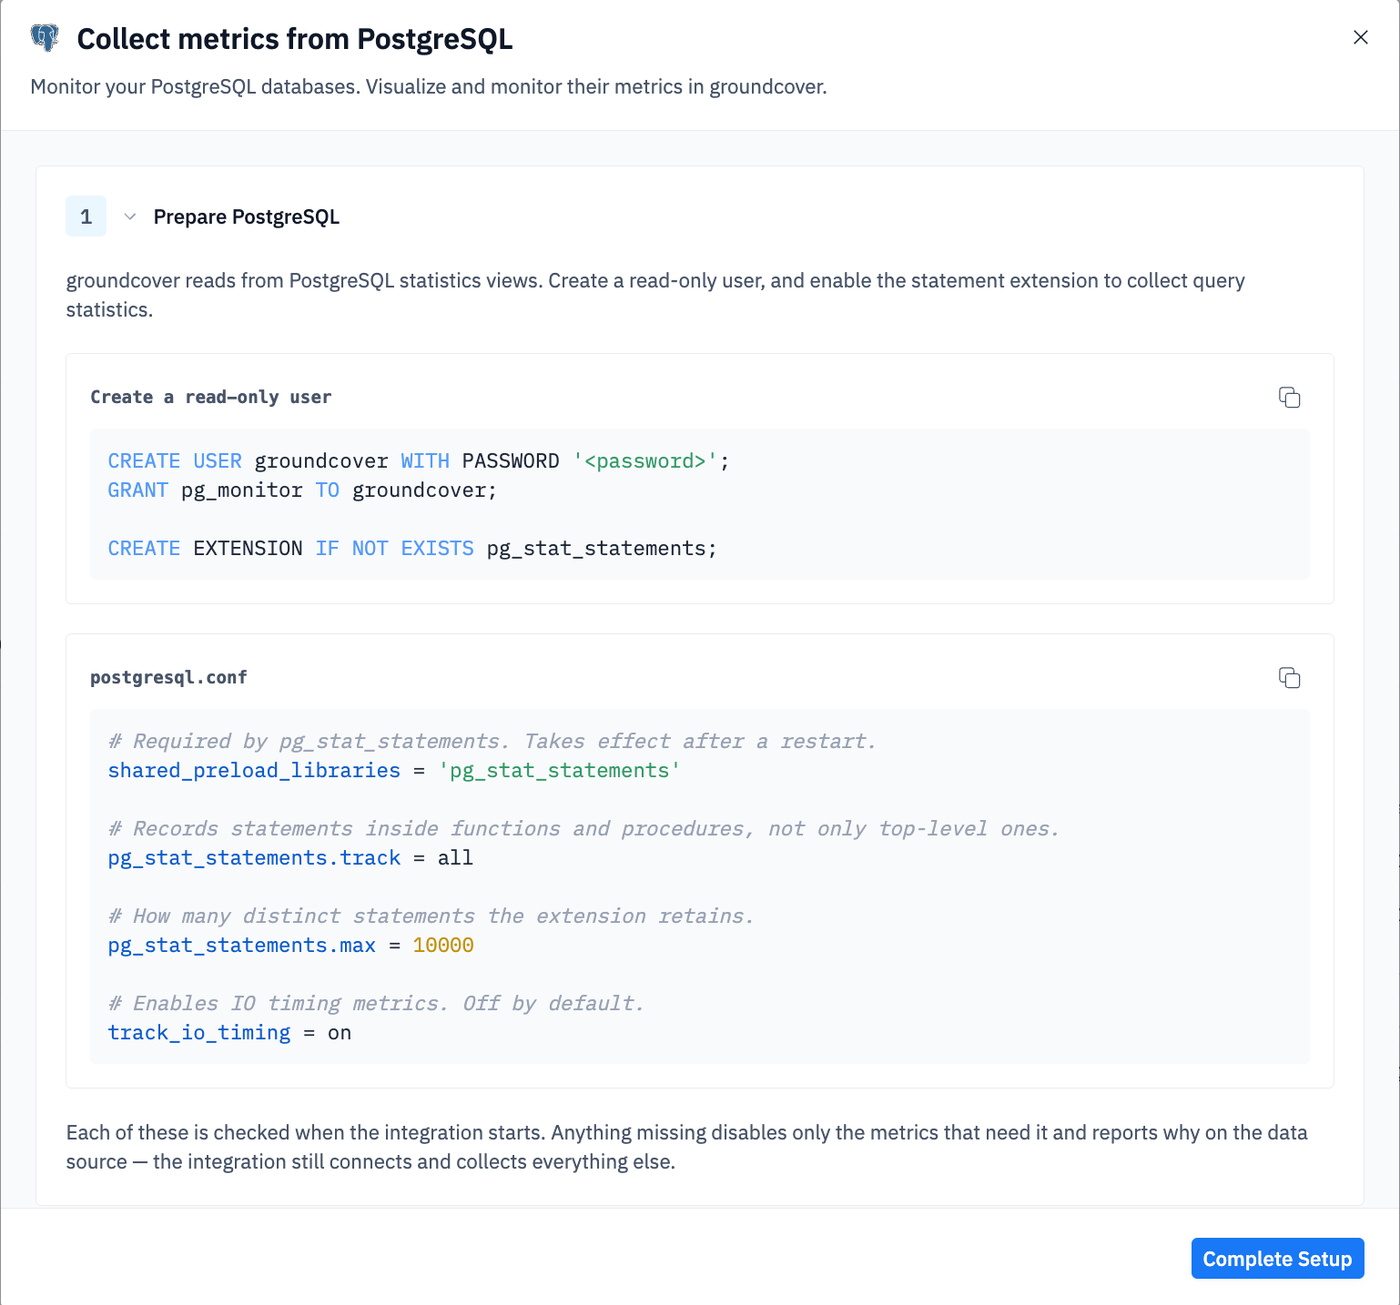
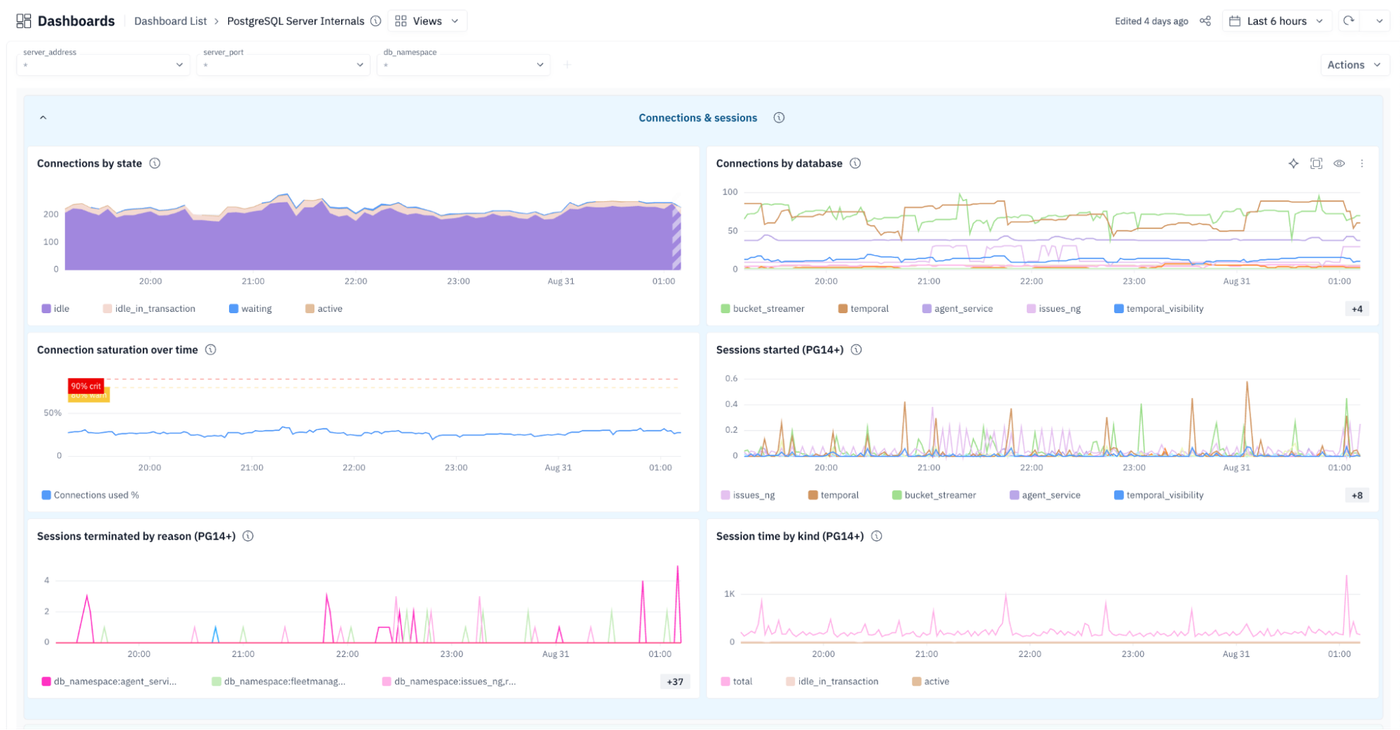
Your databases are usually the thing everything else depends on, and the hardest to see into without bolting an agent onto the host. This release adds PostgreSQL and ClickHouse as new data sources that don't need one. You connect a database and groundcover collects metrics straight from the engine's own statistics tables — and because the database itself reports them, you see activity from every client hitting it, including ones running outside your cluster.
For PostgreSQL that means the health signals you actually reach for: connections and headroom against max_connections, replication lag, transactions and rollbacks, cache hit ratio, WAL and checkpoint activity, transaction ID wraparound headroom, temp file spills, deadlocks, and database size and I/O timing.
For ClickHouse you get part counts, sizes, and merge levels per table, plus query statistics from system.query_log. You choose which metric groups to collect, exclude databases you don't care about, and set the collection interval. Alongside it, the eBPF sensor can now capture ClickHouse-over-HTTP spans out of the box, including metric creation from them, so query-level visibility comes with no extra instrumentation.
Databases are where a slow query or a creeping connection count turns into an outage, and this puts that reading next to the rest of your telemetry instead of in a separate tool.
A rebuilt widget builder
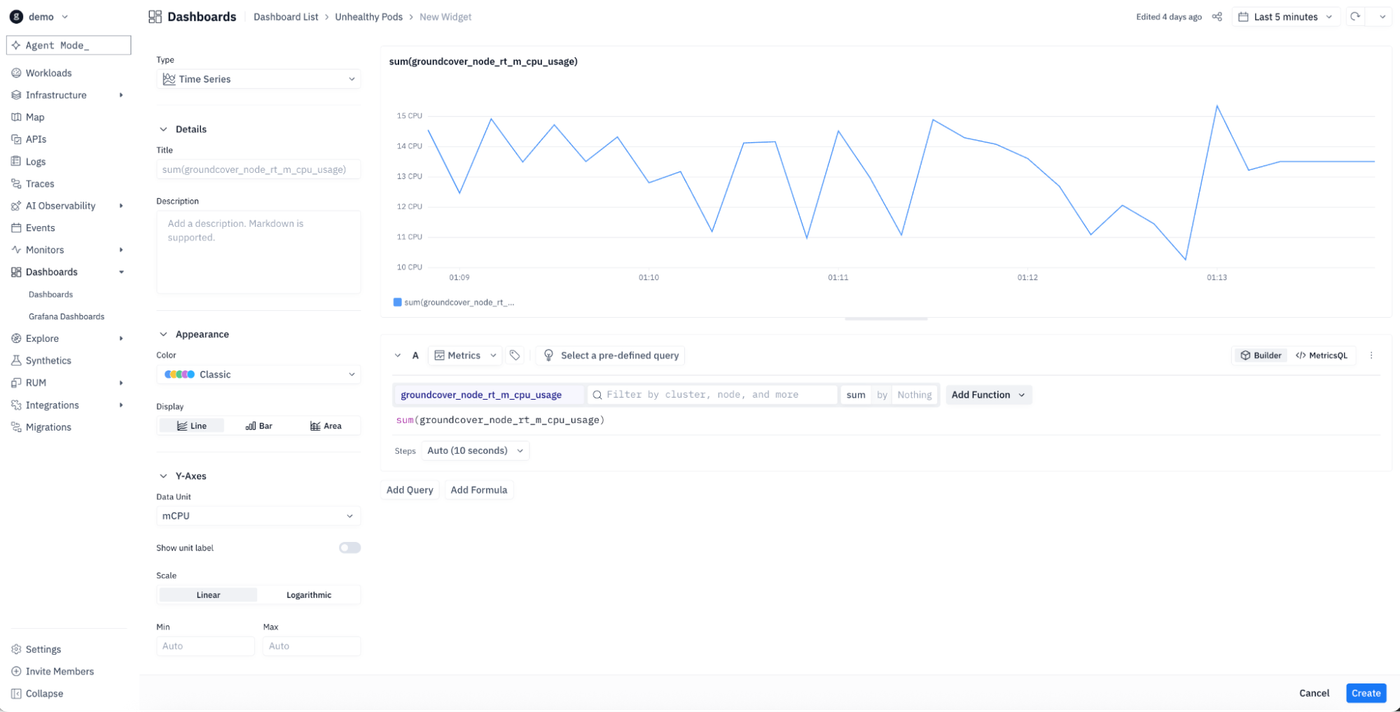
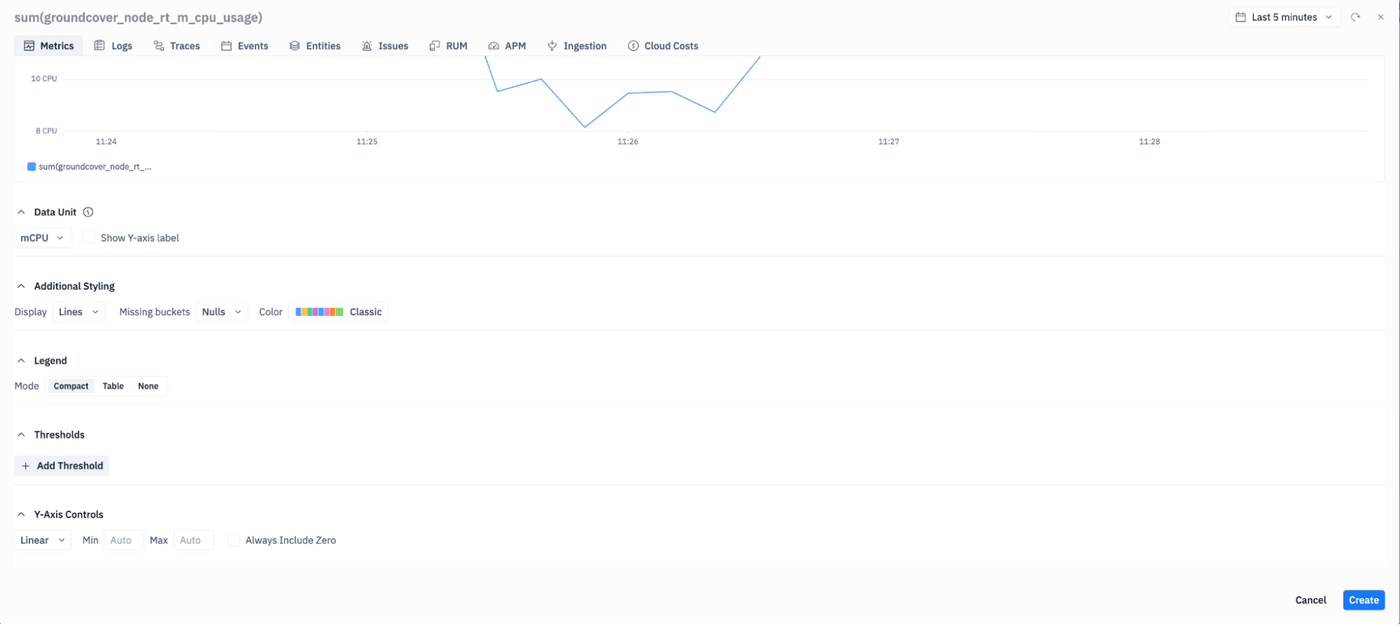
Building a widget used to happen in a cramped modal where you scrolled one long form to find the control you wanted. The builder moved out of that modal into a full page and got reorganized around how you actually build. A view-type switcher sits up top, the configuration is split into widget-level Display settings and per-visualization settings, and a live preview stays pinned in view while your queries sit at the bottom. Pick the chart type time series, table, stat, top list, pie, or treemap and the controls that matter for it (data units, color, legend, thresholds, Y-axis) surface for that type instead of all at once.
The result is a builder you can move through quickly, so the time goes into deciding what to show instead of hunting for the setting that shows it.
Azure Application Insights, deployed with Bicep
Application Insights is Azure's application telemetry. If you already run it, getting that data into a second tool usually means hand-building an Event Hubs pipeline first. This release ships a complete Bicep template that stands the whole thing up for you: it creates the Event Hub, adds a diagnostic setting for each Application Insights resource you list, and deploys a forwarding Function App that streams the telemetry into groundcover — all as code, from one parameter file. Add or remove a resource by editing the list and redeploying; repeated deployments converge on the same resources instead of piling up new ones.
Delivering it as Bicep means the integration is reproducible and reviewable like the rest of your infrastructure, which is what you want the first time you set it up and every time you change it.
Other recent updates

Observability
for what comes next.
Start in minutes. No migrations. No data leaving your infrastructure. No surprises on the bill.


