Weekly updates on new features, improvements, and fixes across groundcover.

MySQL Database Monitoring, Investigations from Slack, and Feature-Level Permissions
November 19, 2026
This changelog covers the past two weeks of work, which focused on rounding out recently released features. MySQL database monitoring collects statement performance and server health from your MySQL instances and tells you which grant is missing when it can't read something. Investigations can now start from a Slack thread, run on the model and effort you choose, and post a one-line root cause back to Slack. Feature-level permissions and expiring API keys let admins give each role and each key only the access it needs. This cycle also adds bulk enablement and autoscaler awareness to Autonomous Infrastructure, tags and clearer status colors to Monitors, per-query rollups to Dashboards, and a time-axis flame chart to the trace drawer.
MySQL database monitoring: statement performance, server health, and setup diagnostics
Teams running MySQL need to know which statements take the most time and whether the server itself is healthy. groundcover now connects to MySQL through an integration and measures each statement by calls, execution time, errors, rows examined, and sort work. The health metrics cover connections, throughput, the InnoDB buffer pool and I/O, locks, open transactions, deadlocks, lock-wait timeouts, table and index sizes, wait events, and the state of each replication channel. A replica whose replication has stopped always reports as unhealthy. Aurora MySQL instances also report whether they are the writer or a reader, along with native replica lag.
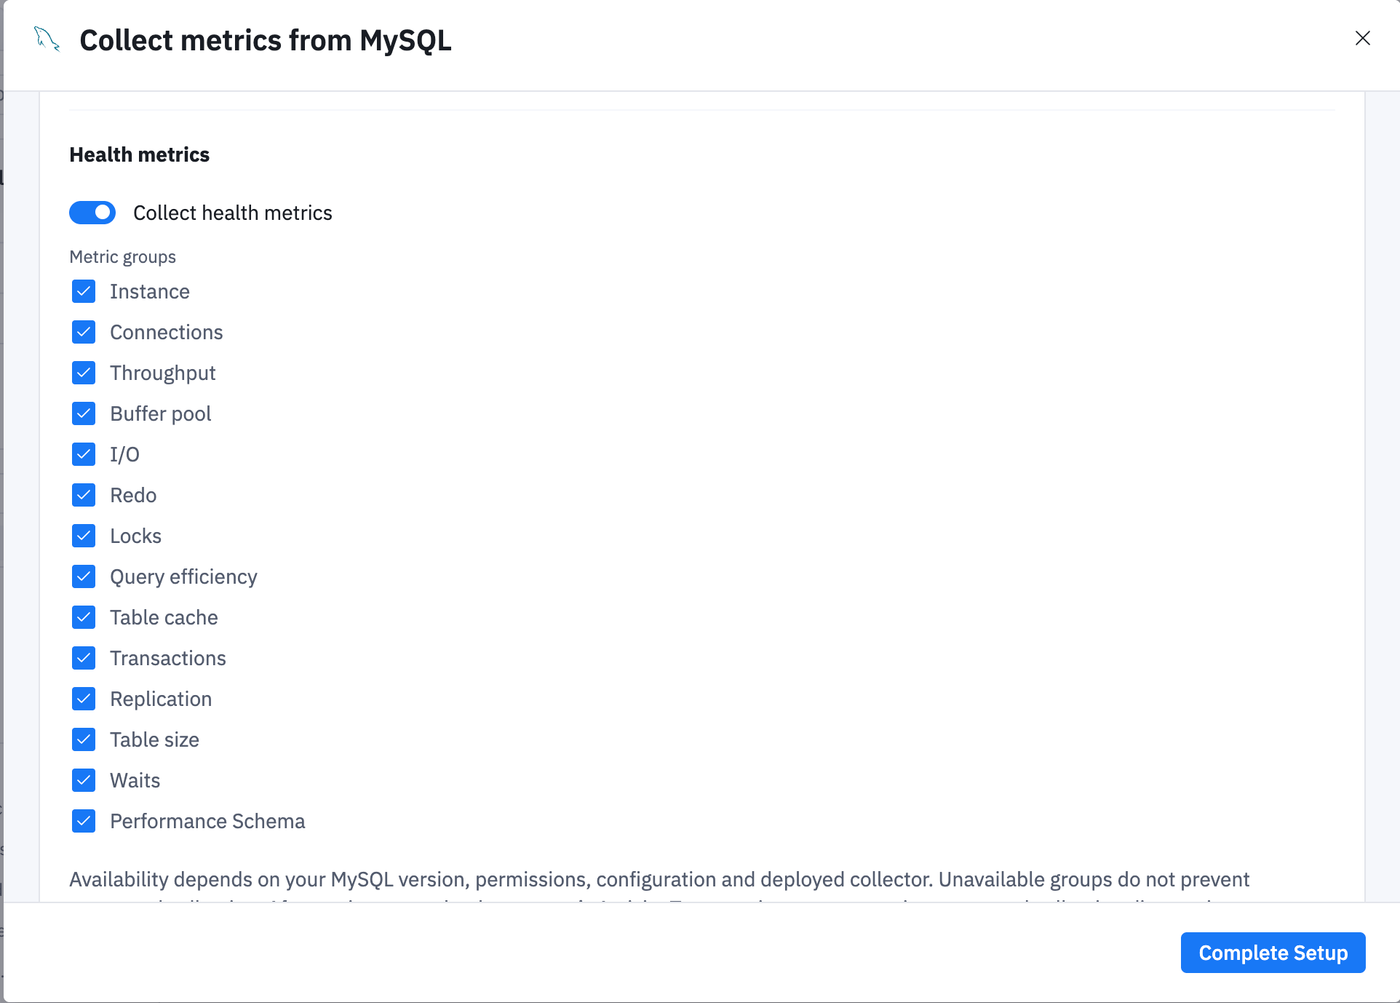
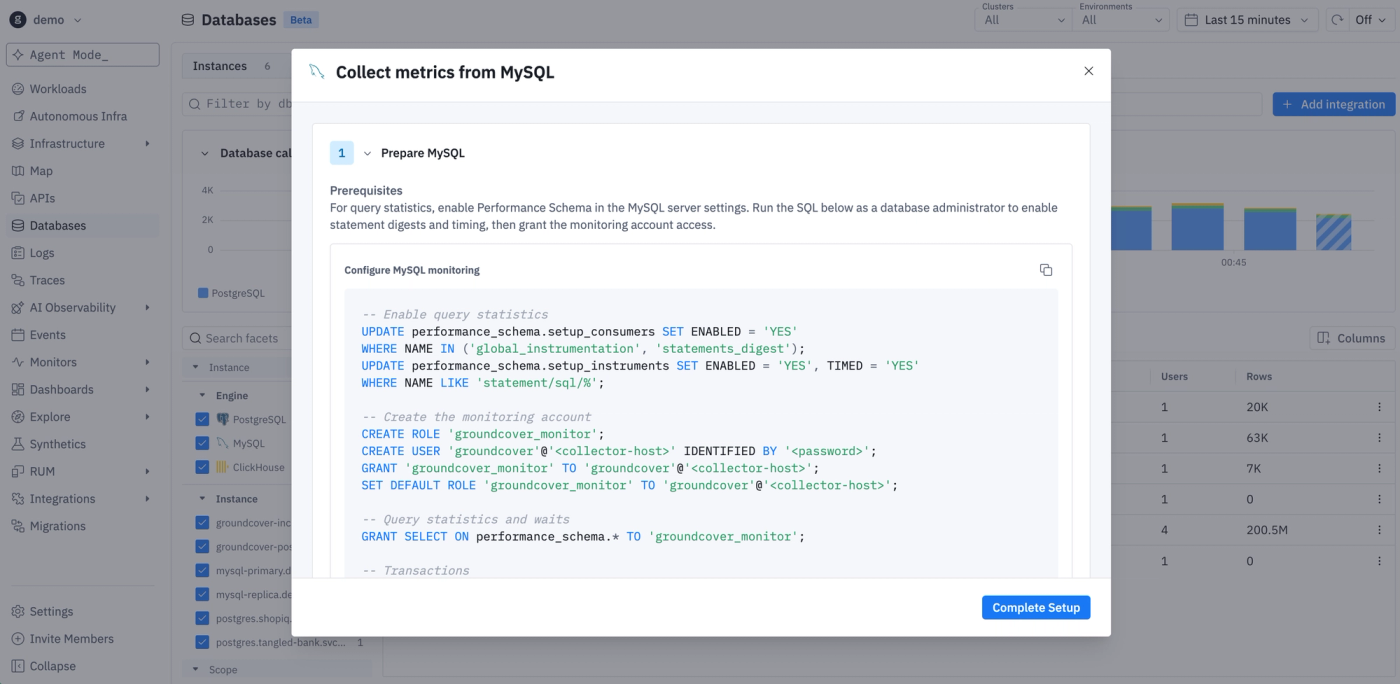
The MySQL setup wizard walks you through the endpoint, credentials, TLS, and collection interval, and it explains connection, permission, and TLS problems when they occur. When the monitoring user lacks a privilege such as PROCESS, groundcover shows one summary with the GRANT statement to run and keeps collecting every metric the user can already read. You can add MySQL from the Add integration menu on the Databases page, or from a discovered MySQL row with the host already filled in. The groundcover agent and the public MCP server can also query MySQL statement data, so you can ask which statements got slower without writing the query yourself.
Investigations: start from a Slack thread, choose the model, and read the root cause in one line
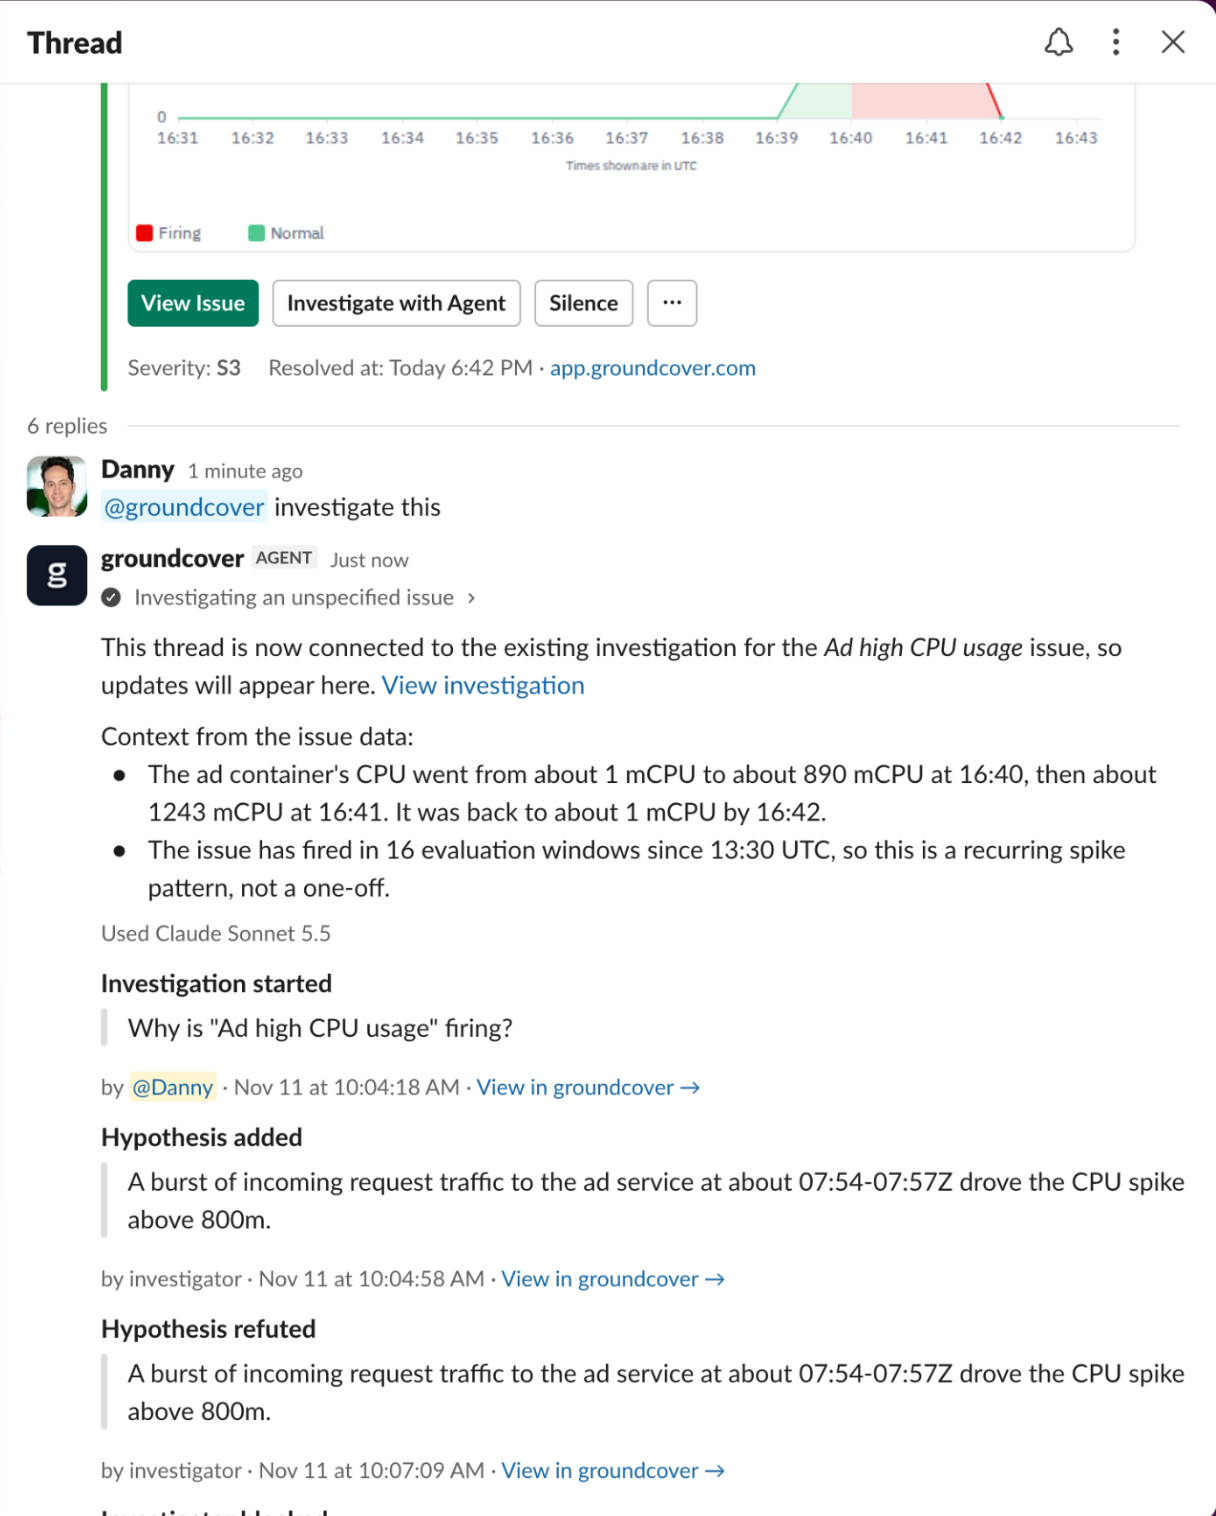
You can now mention @groundcover in a Slack thread to request an investigation of a monitor issue. Review the question, scope, and time range in a private approval, then approve to start. Investigation updates and the conclusion are posted in the same thread.
Choose the model and effort level for manual investigation starts and the automatic Investigation Triggers.
Conclusions now lead with a concise root-cause sentence, followed by impact and a numbered timeline.
Separately, the activity timeline identifies contributions from groundcover, Claude Code, and Codex with agent icons.
The header shows investigator stop reasons and offers resume controls. Expand findings to inspect the evidence and open the underlying query in Explore.
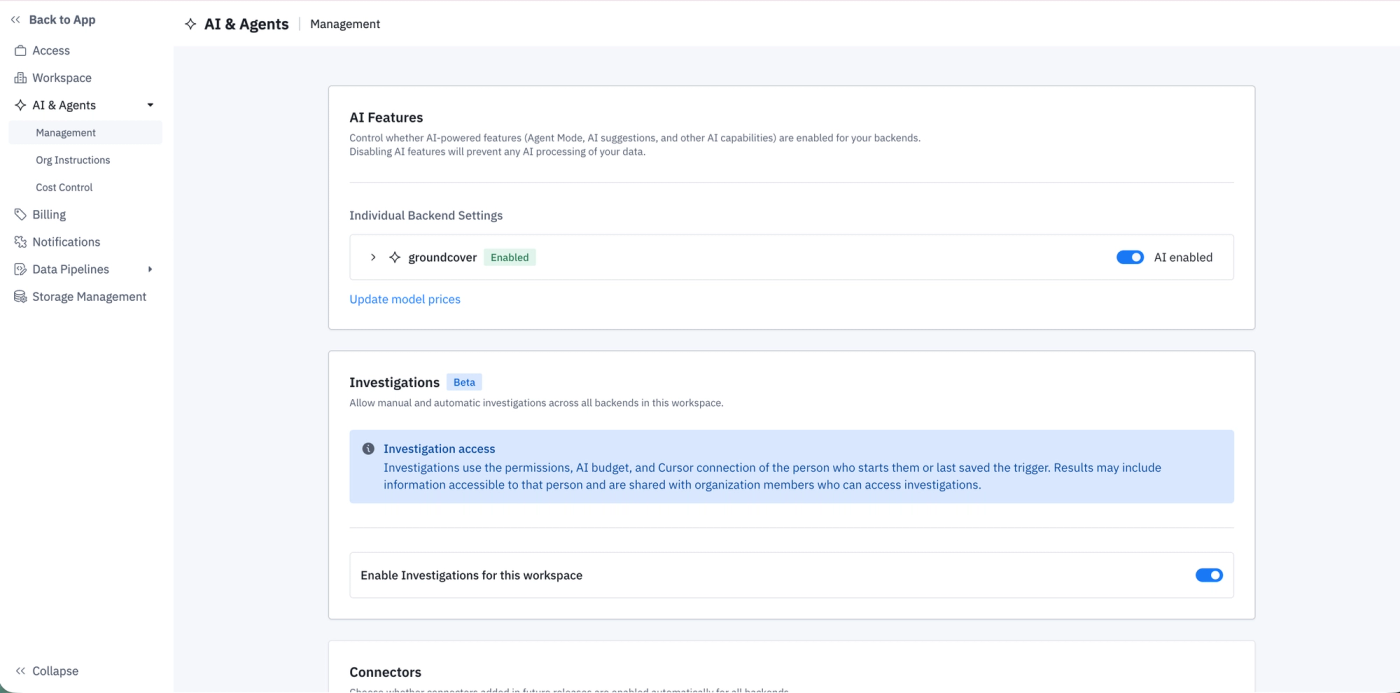
Investigations remains in Beta; admins can enable it in AI-enabled workspaces with a supported backend.
Enable Investigations under Settings > AI & Agents.
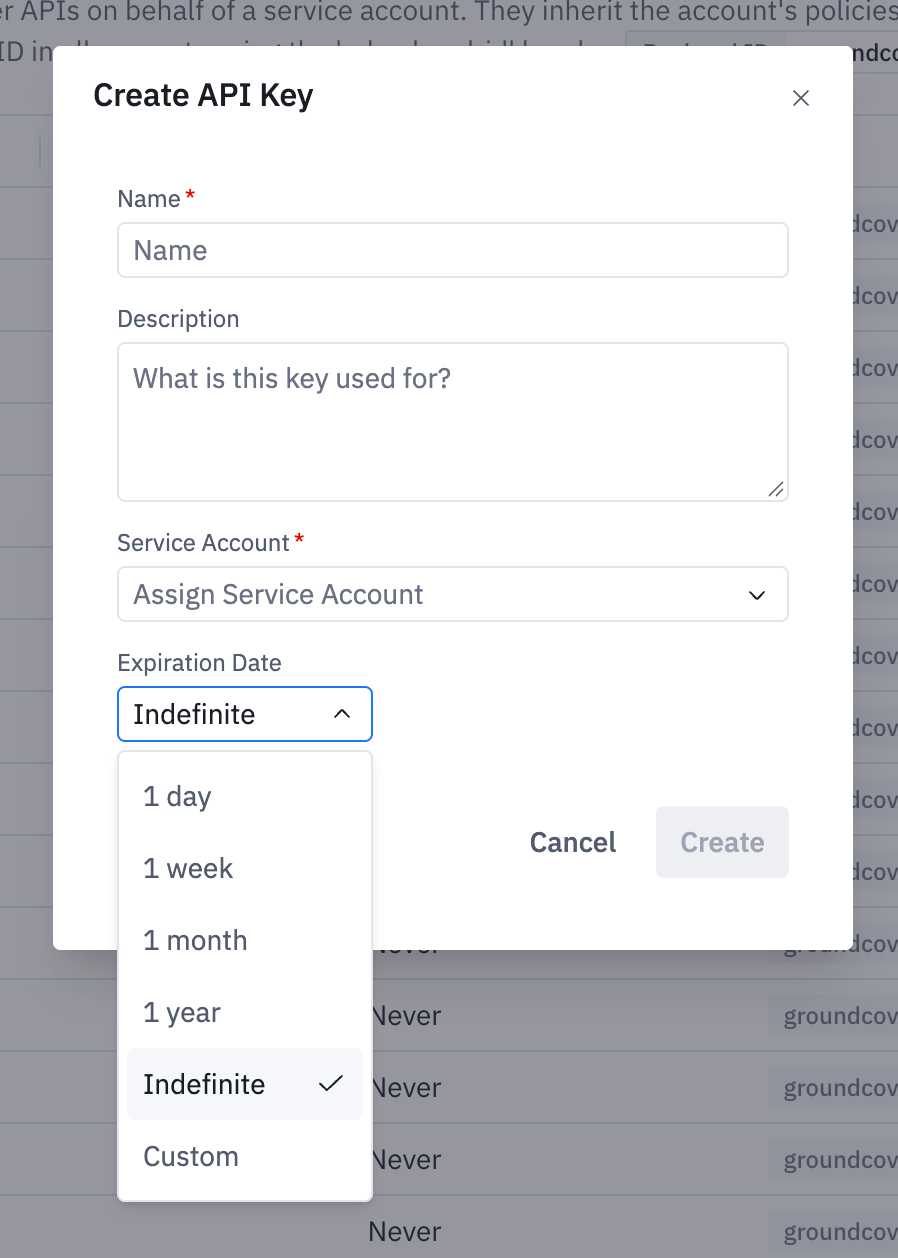
Expiring API keys
API keys now take a description and an optional expiration date. When you create a key, you choose 1 day, 1 week, 1 month, 1 year, indefinite, or a custom date, and groundcover rejects an expired key on every request. A short-lived key gives a script or a temporary integration access only for as long as it needs it.
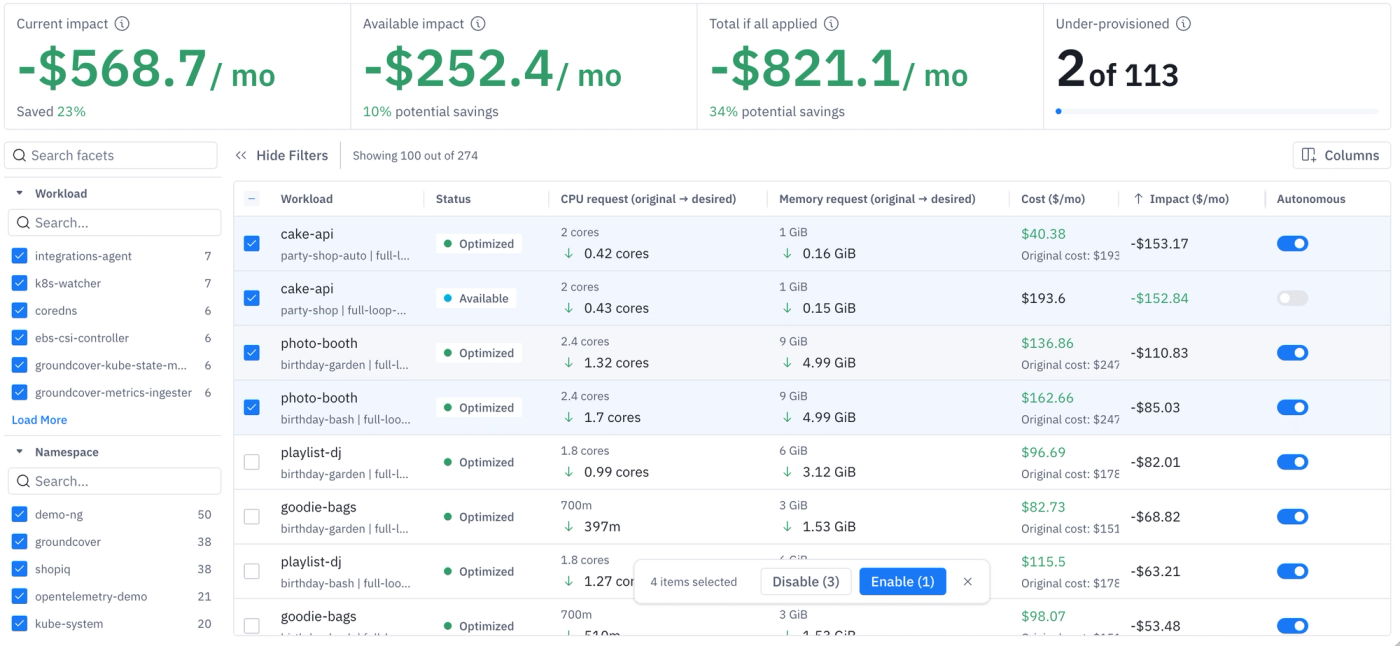
Autonomous Infrastructure: bulk enablement and autoscaler awareness
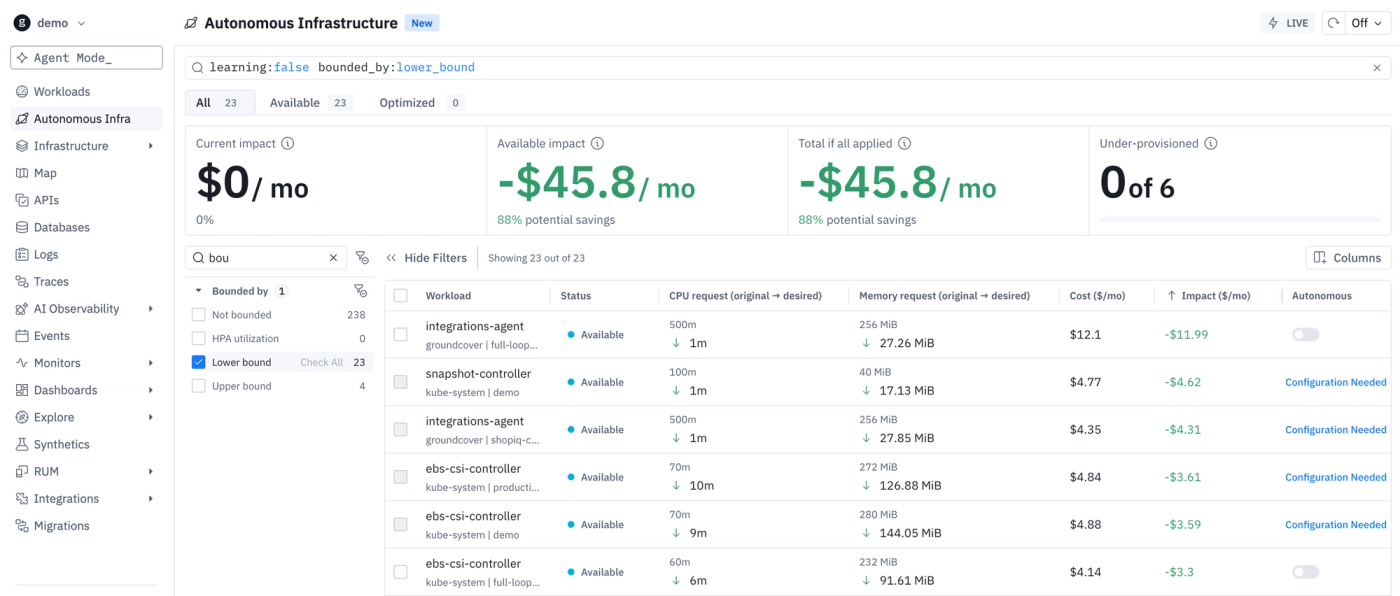
Autonomous Infrastructure calculates CPU and memory requests for each Deployment from about 48 hours of real usage and applies them for you. You can now select many workloads on the Autonomous Infrastructure page and turn them on or off in one action. Workloads scaled by a Horizontal Pod Autoscaler (HPA) or KEDA on a CPU or memory utilization target need care, because a new request changes the utilization the autoscaler reads. Autonomous Infrastructure now detects those targets per container and leaves those resources unchanged, while it continues to size the other resource and the other containers.
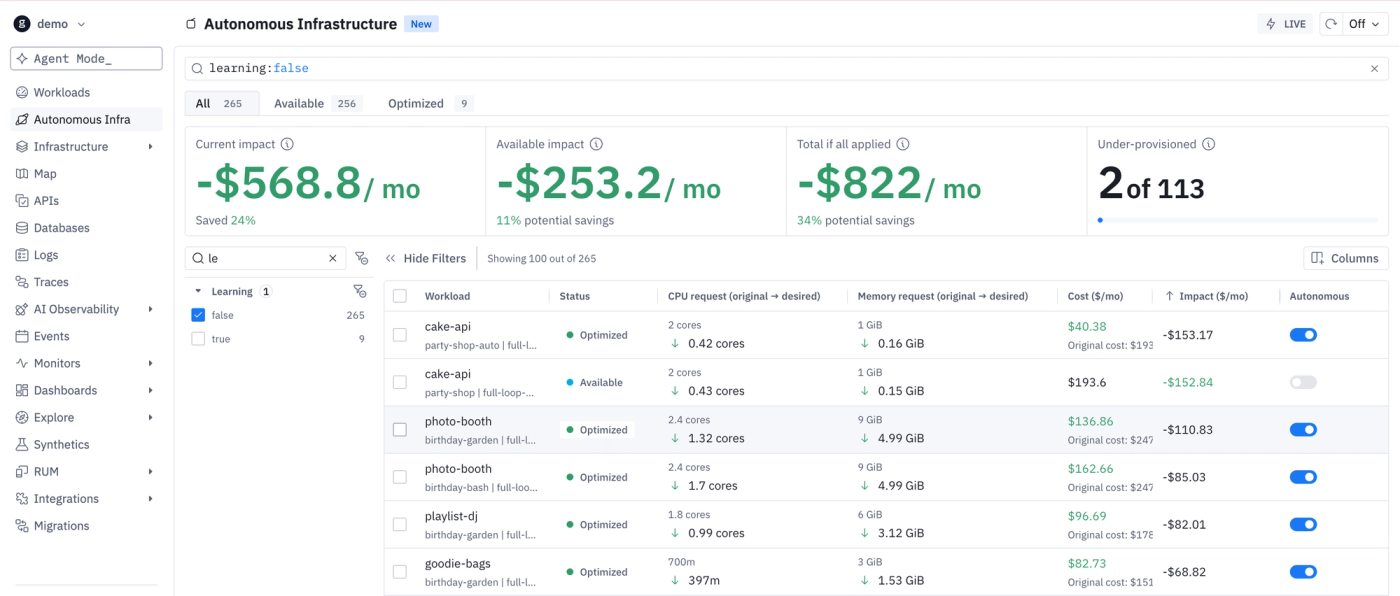
The Autonomous Infrastructure page adds Learning and Bounded by facets. Learning shows the workloads that are still collecting usage data, and Bounded by shows what holds a request in place: an HPA utilization target, the lower bound, or the upper bound. The workload header has a labeled on/off switch with a confirmation dialog. The groundcover agent and MCP server can also explain why a workload received its recommendation. Autonomous Infrastructure is in Beta, and access requires beta approval.
Monitors: tags, a redesigned catalog, and clearer status
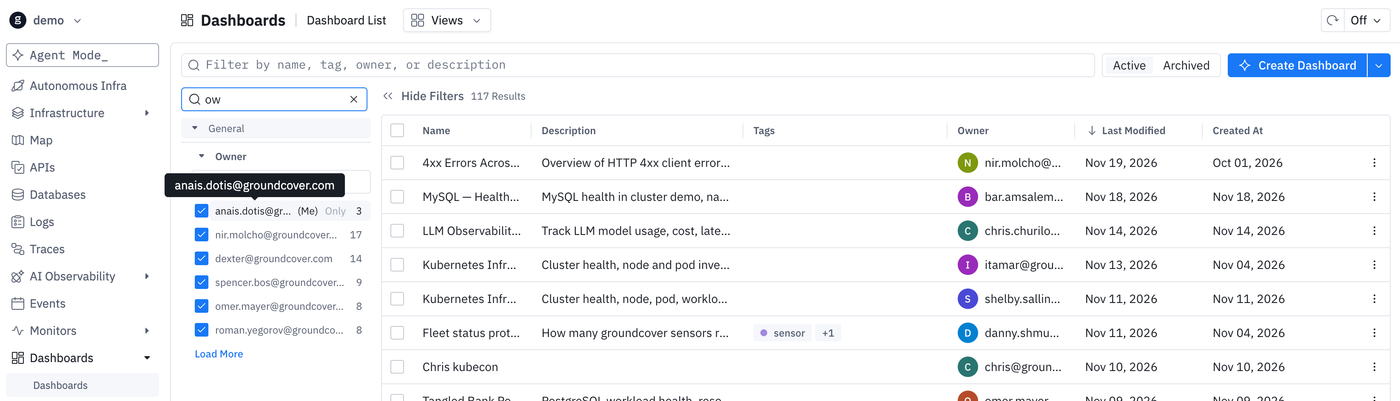
Teams with hundreds of monitors need a way to group and find them. Monitor tags now appear as a facet in the Monitors list and as suggestions in autocomplete, and the API updates tags on many monitors in one call. The Monitors list opens with Status, Live issues, Name, Created by, and Creation date, and the Created by facet lists your own row first, labeled (Me). A firing monitor shows in red even when it is silenced, and a paused monitor shows in gray, so you can see which silenced monitors are still firing.
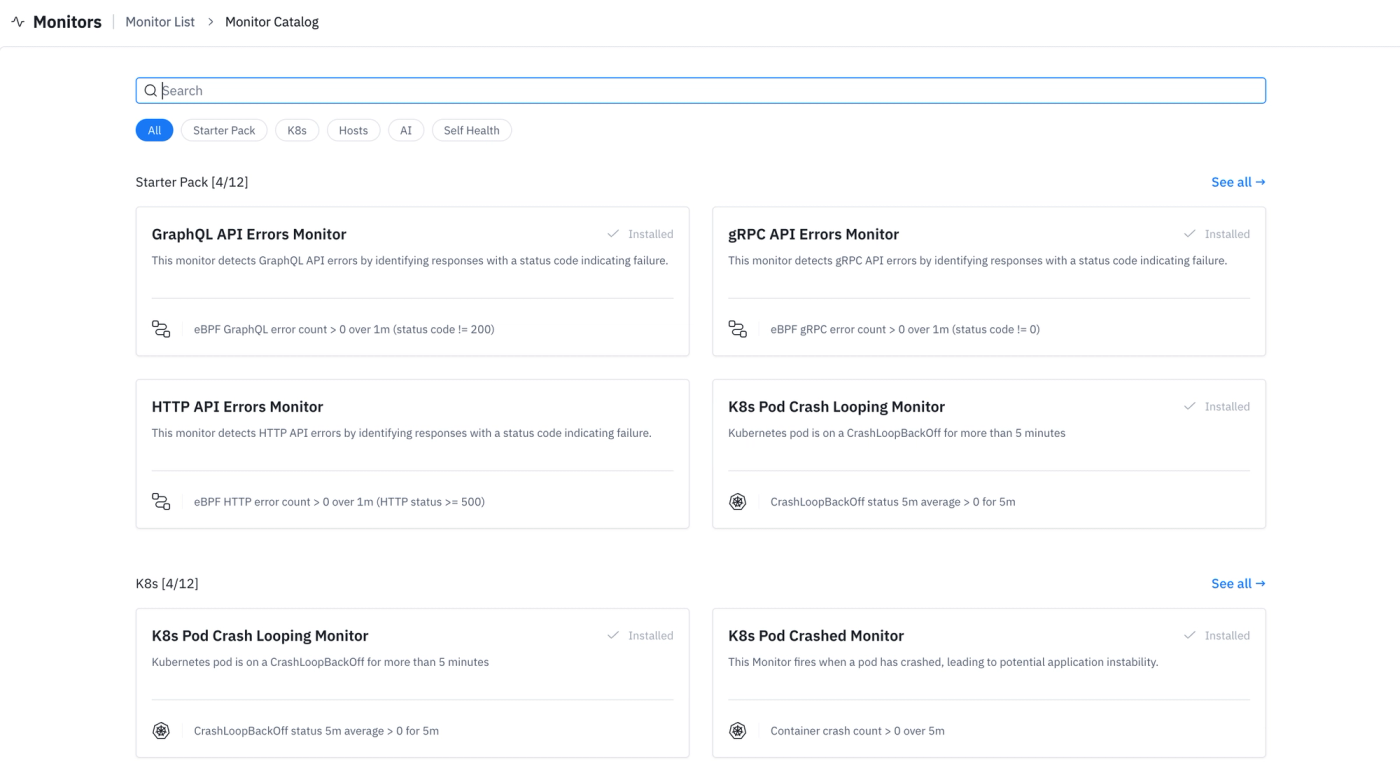
The redesigned monitor catalog explains what each monitor covers and what it requires. Monitor issue drawers now show their own traces, logs, and events regardless of the global cluster filter. For teams that manage monitors as code, the v2 API imports many monitors in one call and reports errors per item, and Terraform notification routes support disable_renotification.
Dashboards: a rollup for every query, and variable display names
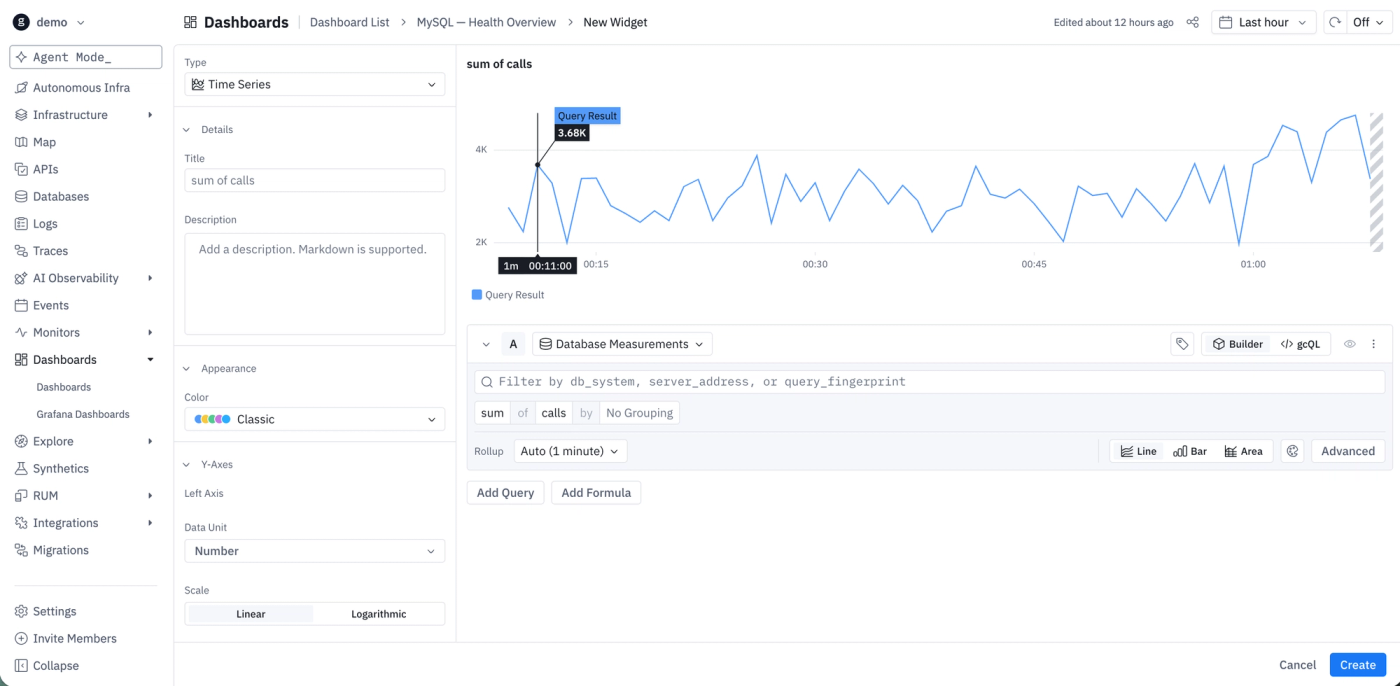
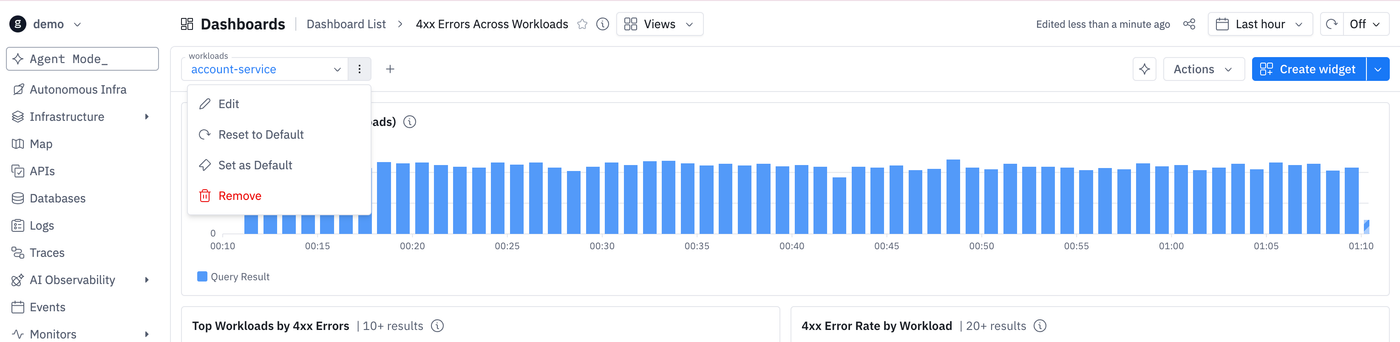
A variety of improvements were made to Dashboards this cycle including:
Traces: a time-axis flame graph in the trace drawer
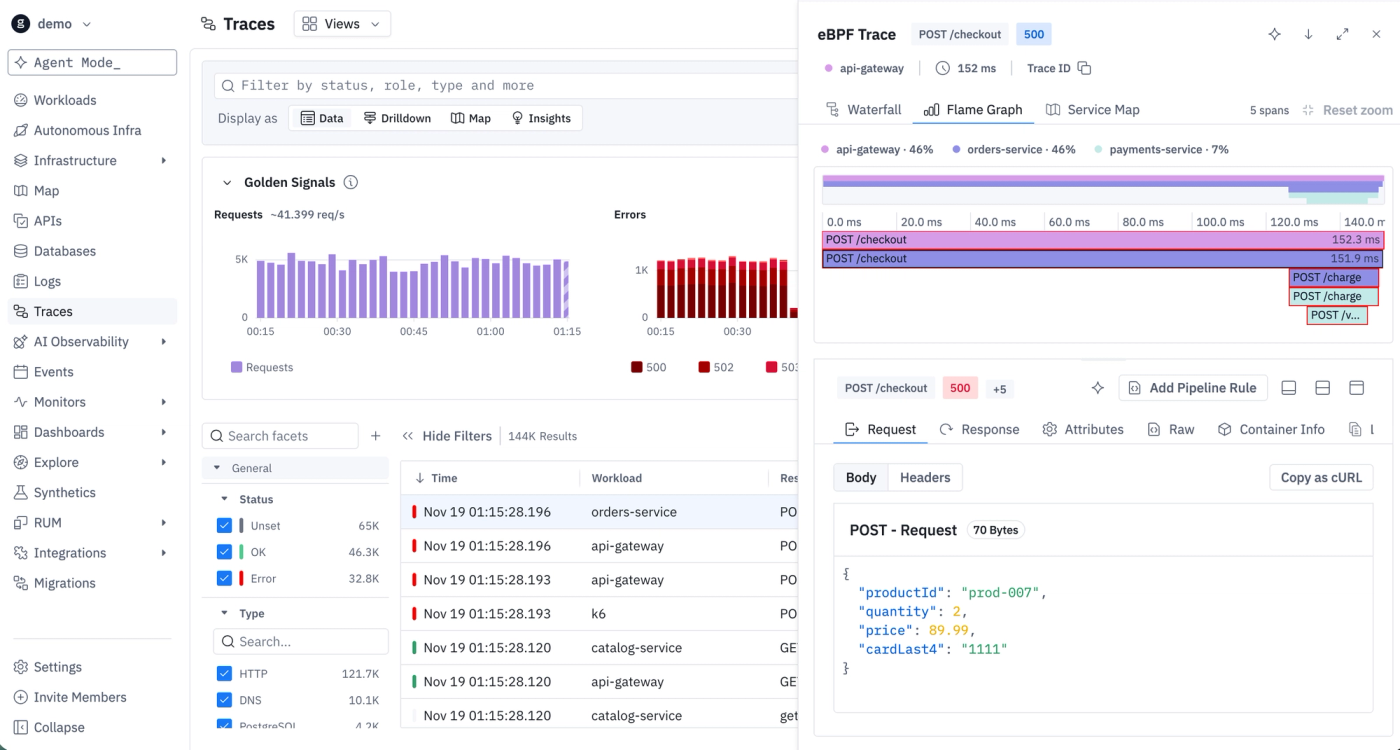
A trace with hundreds of spans is hard to follow as a list. The trace drawer now has a Flame Graph tab that places each span on a time axis and colors it by workload. Click a span to open it, double-click to zoom to it, and press Escape to return to the whole trace. The workload legend highlights a workload's spans when you hover over it and pins them when you click. The flame chart handles async spans that outlive the root and traces with several roots. Traces with more than 5,000 spans show their key spans first, with a Show all option.