
August 20, 2025

Aviv Zohari • Aug 20, 2025
Learn about Kubernetes observability and find out how logs, metrics, and traces enhance system performance. Explore top tools and best practices in our guide.
If you work in software development or operations, you've probably heard all about the so-called "pillars of observability." There are three of them, and when you put them together, you theoretically learn everything you need to know to keep your cloud-native applications healthy, wealthy, and wise beyond their years – or at least performing adequately.
It's one thing to talk about the pillars of observability. It's quite another, however, to collect that data that power them. No matter how many you choose to believe in, actually getting at the metrics, logs, traces and whichever other data source you require for observability can be hard work – especially when you're dealing with complex cloud-native environments, like Kubernetes.
Let's start by defining what Kubernetes observability actually means.
Kubernetes is a so-called cloud-native platform because it's designed to orchestrate cloud-native applications, meaning those that use loosely coupled, scalable, and flexible architectures. (Confusingly, cloud-native doesn't necessarily mean your apps have to run in a cloud environment, but we'll save that discussion for another day.) So, if you want to monitor your Kubernetes clusters – you need a cloud-native observability strategy that’s tailored specifically for Kubernetes and can handle the complex and dynamic nature of cloud-based systems.
Cloud-native Kubernetes observability refers to the ability to monitor and analyze the behavior and performance of Kubernetes clusters in a cloud-native environment, while also being able to understand the Kubernetes context of each event in the system. By wisely leveraging your logs, metrics, and traces combined with the cloud native observability approach, you can gain a comprehensive understanding of the behavior and performance of your Kubernetes cluster. You can then use this information to troubleshoot issues, optimize performance, and improve the overall reliability of your system.
Life for Kubernetes admins would be pretty easy if all of the logs, metrics, traces, and other data they needed for Kubernetes observability were centralized in the same place. Sadly, it isn't. Observing Kubernetes requires a means of collecting observability data from all components of your cluster. There are a few different ways to go about this.
One approach to Kubernetes observability is to go out and deploy monitoring agents on each node and/or pod in your cluster. The agents can collect metrics, logs, and potentially other data from the components that they have access to.
This method – which is the traditional approach to Kubernetes observability, and the one that you'll still find at the heart of conventional Kubernetes monitoring and observability tools – will get you most of the data you need to understand what's happening in your clusters. Deploying each agent is a lot of work. Worse, those agents consume a lot of resources when they run, so they can end up starving your actual workloads of the resources they require to operate optimally.
The metrics API is a native Kubernetes feature that exposes data about resource usage for pods and nodes. At first glance, the metrics API probably sounds great. Why wouldn't you simply collect your observability data from across the cluster using a centralized API, without having to deal with monitoring agents?
Well, mainly because the metrics API only exposes a fraction of the data you need to observe Kubernetes effectively. As its name implies, the metrics API generates metrics, not logs, traces or other data. And the metrics it produces reflect the health of only certain Kubernetes components.
So, while the metrics API is convenient, it doesn't provide all of the data you need for complete Kubernetes observability. You either have to settle for limited insights, or you have to combine the metrics API with other Kubernetes observability methods.
A third method for getting Kubernetes observability data – and one that is not subject to the drawbacks of the other two – involves using the extended Berkeley Packet Filter, or eBPF, to collect traces.
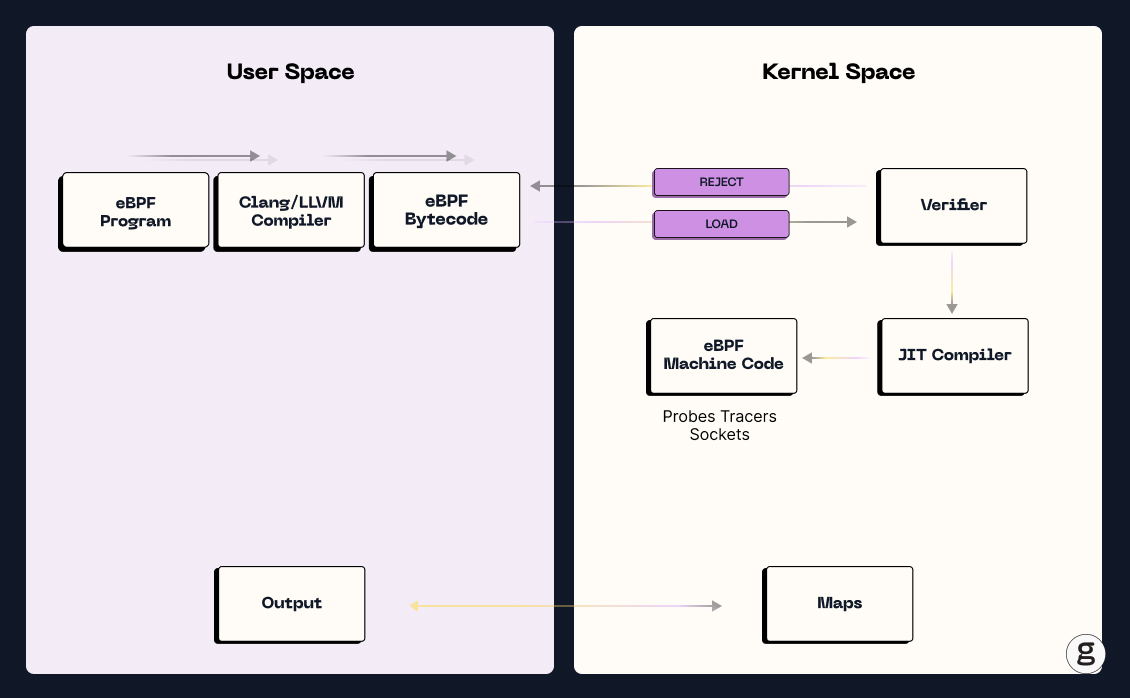
eBPF is a framework that enables you to run programs in the kernel space of Linux-based servers. Because software that runs in the kernel is hyper-efficient, eBPF lets you deploy monitoring and observability software (in addition to other kinds of tools) tools that consume minimal resources, so you avoid the resource overhead issues associated with using traditional software agents. In addition, eBPF programs run in sandboxed environments, so they are very secure.
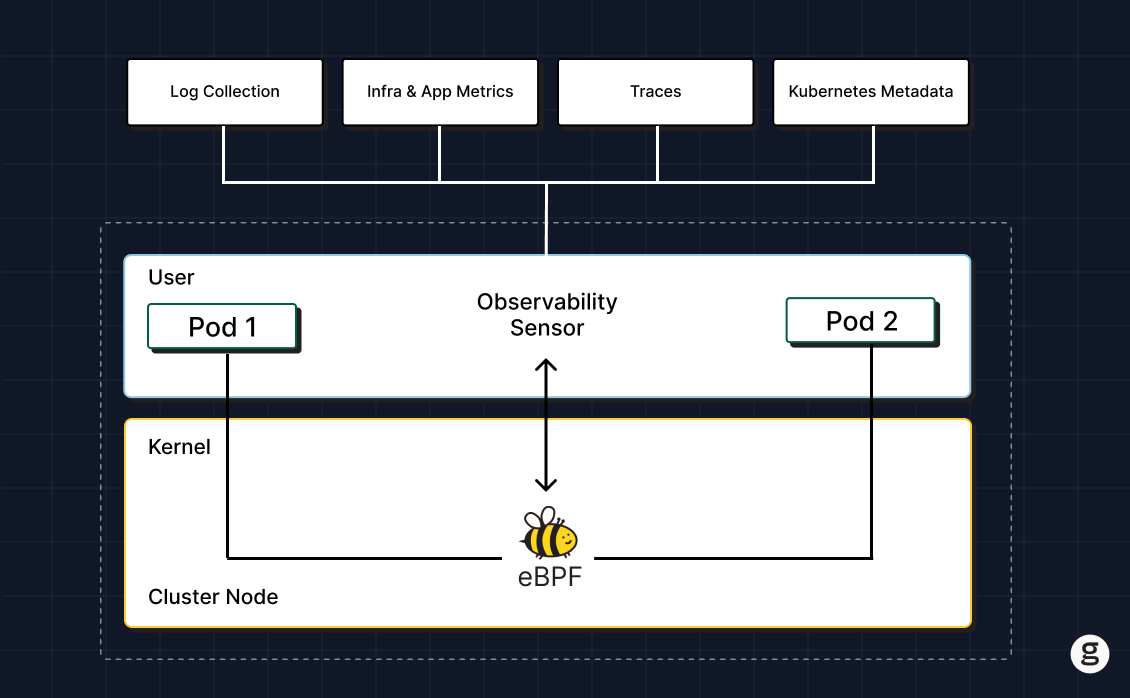
Typically, you'll want to pair eBPF with some other data sources and tools. You'll want to monitor Kubernetes metadata and log data, for example. But by using eBPF as the foundation of your Kubernetes observability and container monitoring strategy, you get as much visibility and context as possible, with as little waste as possible.
Observability is important in almost any type of software system because it helps to identify and troubleshoot problems. For example, being able to observe a conventional, monolithic application running on a virtual server to detect performance anomalies and trace their root cause is valuable.
But when it comes to Kubernetes in particular, observability is especially important. The main reason why is that Kubernetes is a complex system with many moving parts. This can make it challenging to identify and remediate performance or availability issues without a sophisticated observability strategy in place.
For instance, if one of your Kubernetes workloads stops responding quickly to client requests, there are a number of possible reasons why. It could be a problem with your networking configuration. It could be bugs in the application itself. It could be memory pressure or CPU throttling on the node hosting the application. It could be that Kubernetes is in the process of rescheduling the app on a different node. It could be a bunch of other things, too.
To figure out what's actually causing a performance issue like this in Kubernetes, you need to be able to inspect and correlate data from a variety of sources – the control plane, Pods, containers, services, worker nodes, and more. This is what Kubernetes observability allows you to do.
For the sake of clarity, let's make clear that when we talk about Kubernetes observability, we're referring to something distinct from Kubernetes monitoring.
There’s no shortage of blog posts, conference presentations, and videos that dive into long discussions of how monitoring is different from observability. But suffice it to say that the main difference is that monitoring mostly boils down to collecting data that tells you what's happening with a system. Through monitoring, for example, you can determine whether an application has stopped responding or monitor how long requests take to process.
Observability, on the other hand, is all about understanding why something is happening in a system. When you observe a system, you get insights that help you understand what's causing an application to crash, or which specific microservice within a distributed application is creating performance bottlenecks. These insights enable performance tuning, help with cluster performance optimization and maximize the scalability of your cluster.
So, if you were to monitor Kubernetes, you'd merely be collecting data that shows you what the state of your cluster is at any given point in time. When you observe Kubernetes, however, you go deeper. You can understand the context necessary to know how containers, pods, nodes, key-value stores, API servers, and so on are interacting with each other, and how their interactions influence the overall health and performance of the Kubernetes environment.
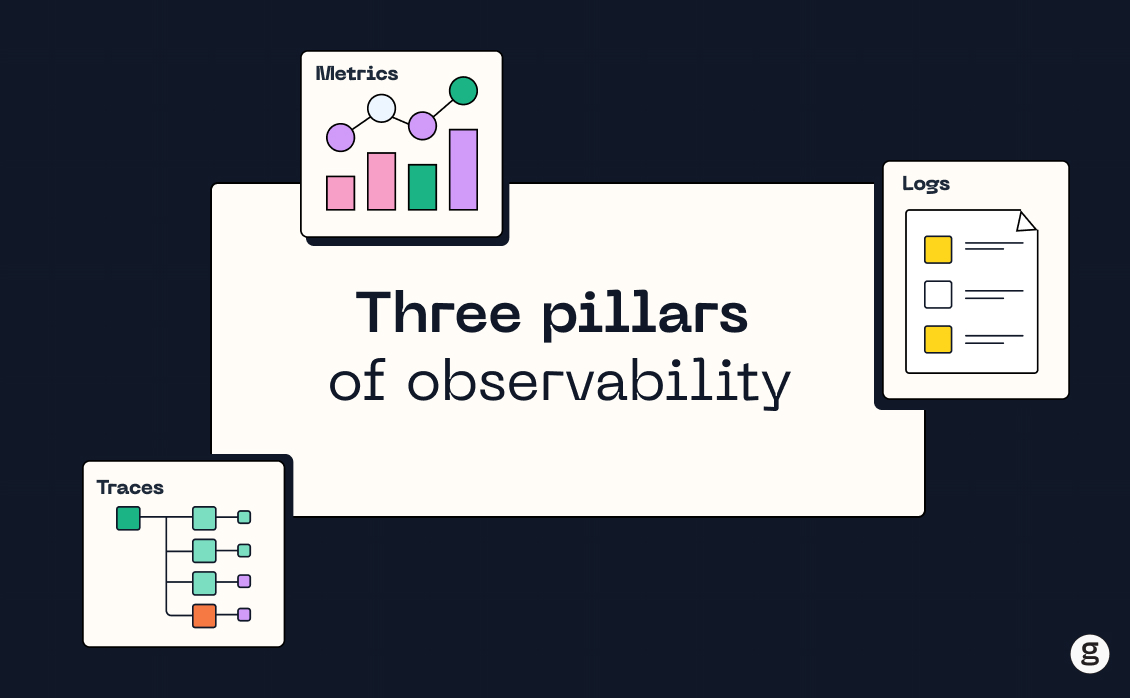
As we mentioned above, there are three key data sources for Kubernetes observability – the so-called "three pillars" of observability:
There are other types of data that can potentially inform Kubernetes observability, such as Kubernetes metadata like how Pods are mapped to nodes, which you won't find in logs, metrics or traces. But we don't want to get into a semantic debate about whether data like this falls within the scope of the three-pillars model. Instead, let's just say that the more data you have to drive Kubernetes observability, and the more effectively you can correlate all of that data, the better.
We explained why Kubernetes observability is important, but no one's saying it's easy. On the contrary, establishing an effective and efficient Kubernetes observability strategy requires overcoming several key obstacles.
Here's guidance on how to solve Kubernetes observability challenges.
Again, Kubernetes doesn't neatly store all relevant observability data in one central place. Instead, the logs, metrics, and traces you'll need are spread across control plane nodes, worker nodes, containers and, potentially, external observability tools that you use for tasks like running traces.
To ensure that you can collect all the observability data you need, you must deploy collectors in every place where data originates. One way to do this is using traditional agents, although as we said above, we think an approach like eBPF – which allows you to collect data in a much more efficient and secure way – is preferable.
In a typical Kubernetes environment, there is no "normal" when it comes to performance. Resource utilization metrics, application performance indicators, and so on change constantly based on factors like how much traffic apps are receiving.
Because of this, you can't establish an observability strategy by simply defining a static baseline and measuring anomalies against it to detect performance issues. Instead, you need to be able to analyze context to understand what's a true issue and what's a mere change in state. You can do this by correlating data sources – for instance, by checking whether a spike in resource utilization metrics correlates with error events registered in a container's logs.
In many (though not all) cases, Kubernetes clusters run on top of external infrastructure – such as a public cloud platform. This introduces another layer of complexity to Kubernetes observability because admins need to be able to distinguish issues that originate within their clusters from external problems.
For instance, if an application experiences high latency, that might be because of problems with your cluster networking configuration. But it could also be with network settings you've configured through your cloud provider.
Here again, context and data correlation is critical for gaining insight. For instance, knowing whether a spike in latency correlates with changes to either internal or external networking policies will help you trace the root cause of this type of problem.
Observability is essential, but it's not always cheap. There's a cost associated with collecting, processing and storing all of the data that powers Kubernetes observability. And we're talking here not just about costs linked to the data itself (like egress fees and storage fees), but also the compute and memory expenses associated with running agents to collect data.
One way to streamline observability costs is to ensure that the data collection and analysis process is as efficient as possible. Here again, we'll mention eBPF, which is great from a cost-management perspective because eBPF data collectors use minimal CPU and memory resources, which can translate to significantly lower costs than traditional, agent-based approaches to observability data collection.
There are a variety of tools to help implement Kubernetes observability. They fall into three main categories.
Kubernetes offers a handful of built-in tools and utilities to help with observability. The most obvious, perhaps, is kubectl, which you can use to collect basic metrics data using commands like kubectl top.
In addition, the Kubernetes project provides a default Kubernetes dashboard that displays some observability data.
The built-in observability tools are limited in the types of data they can collect and the types of analyses and correlations they support, so you typically shouldn't rely on these tools alone to enable an observability strategy. But they can help with basic data collection and troubleshooting.
Some Kubernetes vendors offer additional observability tools as part of their Kubernetes distributions. For example, you can use Amazon CloudWatch Container Insights if you run Kubernetes on Amazon Web Services (AWS) using the Elastic Kubernetes Service (EKS) platform. Similarly, Rancher offers some observability features that go beyond the ones built into Kubernetes itself.
In most cases, vendor tools like these provide more sophisticated observability capabilities than you'll get from tools like kubectl or the default Kubernetes dashboard. But these tools typically only work with specific Kubernetes distributions, and they're not always designed to be totally complete, one-stop-shopping types of Kubernetes observability solutions. They're just another tool to add to your arsenal.
The third category of Kubernetes observability tools consists of platforms designed first and foremost to enable observability. Typically, these solutions support Kubernetes in addition to other types of environments.
Because solutions in this category are designed specifically for observability and come from vendors who specialize in observability, they typically provide the richest set of observability features and capabilities. They also usually support any type of Kubernetes distribution. And in many cases, they can correlate external observability data (like data from a cloud provider's platform) with data from inside Kubernetes, enabling the deepest level of visibility.
Now that we've walked through the essentials of Kubernetes observability – and highlighted how next-generation tools like eBPF make it possible to achieve Kubernetes observability insights in ways that once seemed unimaginable – let's talk about best practices for getting the most out of Kubernetes observability.
Arguably the most important Kubernetes observability best practice is selecting the right tools and frameworks. Above, we made the case – and we think we made it well – that eBPF-based tooling is the best solution in most cases. But in addition to evaluating whether your tools use eBPF or not, you'll also want to think about ease of implementation. Is your observability software fast and simple to deploy, or does it require complex setup? Do you have to configure data visualization and analytics software separately, or is it all built into your tooling?
Think about pricing as well – including not just the direct purchase or licensing costs of observability tools themselves, but also about secondary costs like data ingestion and storage fees. Kubernetes observability tools that seem affordable on the surface may turn out to cost more than you counted on due to add-on costs like these.
As we mentioned, Kubernetes observability software can place a hefty burden on your clusters. Monitoring software may suck up considerable memory and CPU, depriving your actual workloads of those resources. If this happens, the observability strategy that you've established to help optimize Kubernetes performance can have the paradoxical effect of reducing performance levels.
That's another reason to opt for eBPF-based solutions, which take advantage of kernel space to collect observability data with minimal resource overhead and performance impact.
In a perfect world, every application and service in Kubernetes would perform optimally. In the real world, resource constraints, noisy neighbors, and other challenges to performance exist, making it impossible in many cases to achieve totally perfect, optimal levels of performance across your cluster.
For this reason, it's a best practice to set realistic goals about which performance objectives you want to meet. For instance, define the latency thresholds your applications can tolerate, or the number of errors you can accept, under normal operating conditions. Then, use these goals as a foundation for determining how sophisticated and aggressive your observability strategy needs to be. Sometimes, you don't need to know about every single failure or degradation in performance because the issues are not significant enough to affect your overall performance goals.
Even by the standards of cloud-native software, which is always more complex than earlier software architectures, Kubernetes is especially complex. It consists of a plethora of multiple components, and it's full of complicated abstractions.
To sort through all of this complexity, context is key. By context, we mean collecting observability data that allows you to understand how different components relate to each other, as well as to see through abstractions in order to get at the underlying causes of Kubernetes performance issues.
The point here is that the more Kubernetes observability data you collect, and the greater your ability to interrelate different types of data, the more effective your observability strategy will be.
As we mentioned, observability can be expensive. To ensure that data collection and processing doesn't break your budget, you should take steps to make Kubernetes observability as cost-effective as possible.
Again, one way to do this is by minimizing the cost of data collectors using approaches like eBPF. In addition, practices such as deleting historical observability data, or archiving it on low-cost storage solutions like Amazon S3 Glacier, can help reduce storage costs.
To ensure that your team is aware of and ready to respond to problems identified by your Kubernetes observability tools and processes, you should configure alerts. But given the vast amount of data and components at play within the context of Kubernetes observability, alerting on every single event or slight anomaly is a recipe for noise and alert fatigue – meaning that your team will receive so many alerts that they begin to ignore them, or simply can't review them all.
To avoid this risk, configure intelligent, context-based alerts. For instance, you might not want to alert based on a sudden change in a Pod's memory consumption because the change could simply be due to an increase in traffic. But if the spike correlates with errors in logs within the Pod's containers, it probably does merit an alert.
If you've read this far, you're probably thinking, "I'm super stoked about eBPF! But how do I actually use it?"
That's a good question, because eBPF is a very complex tool. Creating eBPF monitoring tools from scratch requires a lot of coding, probably followed by a lot of troubleshooting when your code doesn't work as expected. And then you have to figure out how to interpret the data that eBPF collects, which is a whole gargantuan task unto itself because it requires choosing a data visualization and/or analytics tool and then setting up a pipeline to move eBPF-generated data into it.
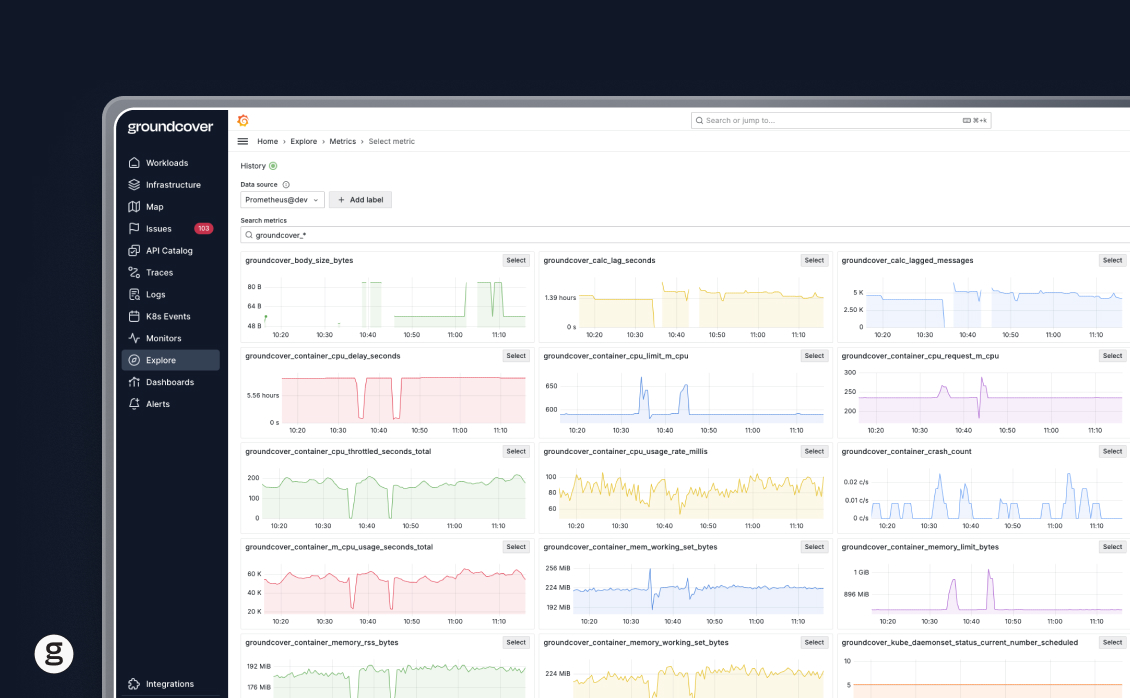
That's why the real-world way to leverage eBPF for Kubernetes observability is to take advantage of Kubernetes observability tools, like groundcover, that are powered by eBPF under the hood. At groundcover, we use eBPF to help collect traces. We also tag that data automatically with cloud-native metadata – such as container names, pod names, and nodes – so that it's immediately actionable. And we expose it through an interface that makes it easy for you to glean actionable insights based on the data.
For example, in the following video, we use groundcover to troubleshoot an HTTP trace with a 500 status code in the frontend service. groundcover identifies that there are error logs at the same time as the trace, and we can see that the required product ID was not found.
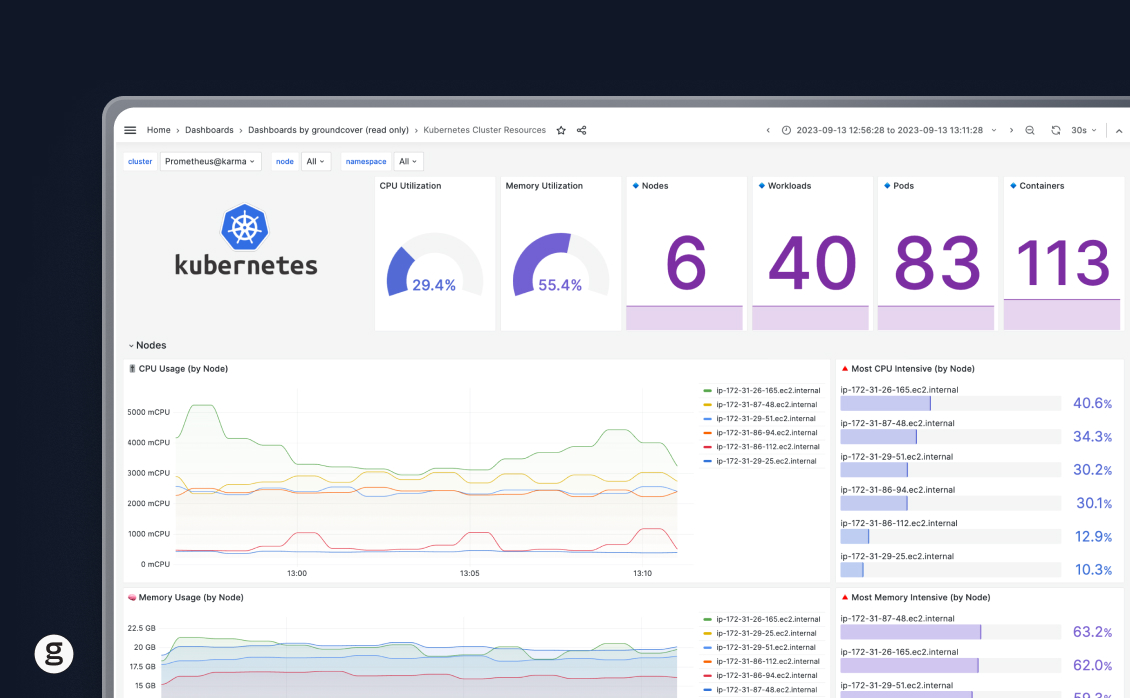
In this example, we use Kubernetes events and metrics to catch memory leaks in one of our workloads.
In closing, let us point out that until just a few years ago, devising a Kubernetes strategy was a lot of work. At that time, eBPF wasn't yet mature enough for production usage, and collecting observability data from Kubernetes required making a lot of compromises – such as accepting the inefficiency of agent-based monitoring, or settling for sampled data that didn't always provide accurate insights.
Fortunately, those limitations are a thing of the past. Today, anyone can use observability solutions like groundcover to achieve simple, efficient, secure, and effective Kubernetes observability powered by eBPF.
DevOps is a philosophy that prioritizes collaboration between software developers and IT engineers. Kubernetes is a platform for managing applications that run using containers.
Thus, the difference between Kubernetes and DevOps is that Kubernetes is a tool, whereas DevOps is a concept or idea. That said, Kubernetes can help put the DevOps philosophy into practice by providing a shared environment where developers can build and test applications, and where IT teams can then deploy them. In this way, Kubernetes can help reduce friction between developers and IT teams, which is one of the core goals of DevOps.
There are two main approaches for monitoring Kubernetes jobs, meaning one-off tasks executed using Pods. One is to push metrics about job operations to a monitoring tool like Prometheus. Another is to use the kube-state-metrics to track jobs.
For details, check out our article on monitoring Kubernetes jobs.
The best monitoring tool for Kubernetes is one that allows you to collect and analyze all relevant performance data, from across all of the various components inside Kubernetes, in an efficient and cost-effective way.
Obviously, we're biased in favor of groundcover, which we think excels as a Kubernetes monitoring tool because it uses eBPF to collect data from across all parts of Kubernetes in a hyper-efficient way. Most other Kubernetes monitoring tools rely on agent-based data collection, which is much less efficient.
The main benefit of Kubernetes compared to Docker is that Kubernetes offers sophisticated orchestration features. That means it automates processes like deciding which node within a cluster of servers should host each container you want to run, setting up replicas of containers, and managing a large set of containers.
Docker provides some orchestration features as well, most notably through its Swarm tool, but they are not as extensive as those available from Kubernetes. In addition, the popularity of Kubernetes has made it a de facto orchestration standard for running containers at scale.
Docker is useful if you just want to run one or two containers on a single server without having to set up a complete orchestration environment. But you'll probably want Kubernetes if your goal is to run a large set of containers across a cluster.
Keep up with all things cloud-native observability.
We care about data. Check out our privacy policy.

Monitor everything, deploy in minutes.
Cover your entire Kubernetes stack instantly
with no code changes.
Auto-detect issues across your entire cluster.
See it all. Store what matters. Pay Accordingly.

Meet the groundcover team for a 30 minute live session
Explore how groundcover provides instant, out of the box insights across logs, traces, metrics, and more.
Get a walkthrough of the platform, pricing model, and real world use cases tailored to modern observability challenges.
Ask anything- our team will address your specific stack, scale, and deployment needs.


By submitting this form you agree to our friendly privacy policy.

.svg)
.jpg)
