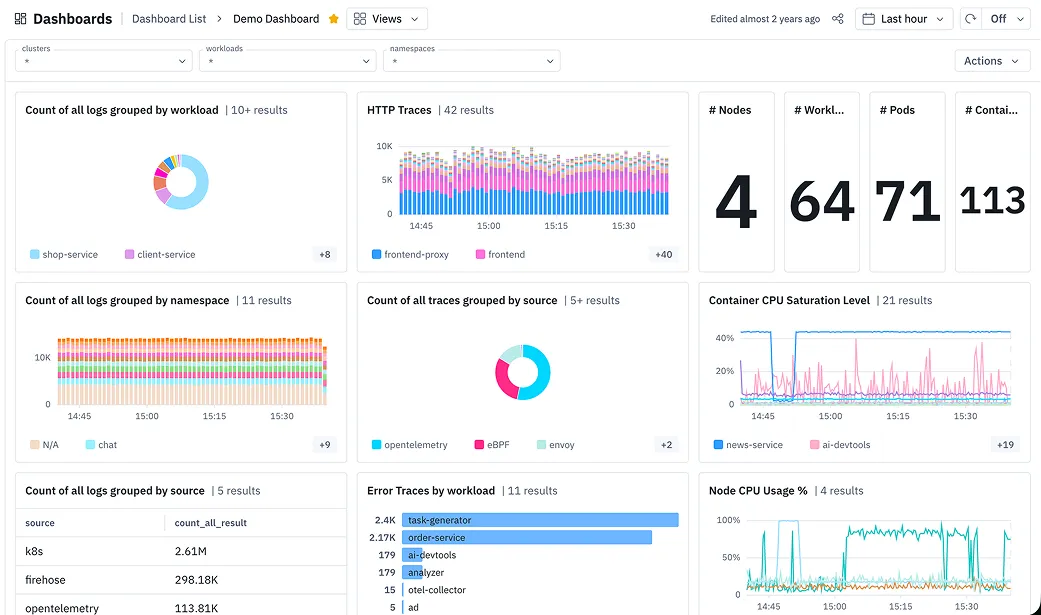


OpenTelemetry isn’t the only option for collecting and analyzing application telemetry. Although it standardizes how applications generate and export traces, metrics, and logs, you still need to configure instrumentation, operate Collectors, and connect a backend for storage and analysis. Alternatives such as eBPF-based observability platforms, managed APM tools, and independent telemetry collectors offer different ways to reduce that work, depending on what you need to replace.
This article compares OpenTelemetry alternatives based on their capabilities, limitations, instrumentation requirements, OTLP compatibility, deployment options, and pricing. You’ll also learn which parts of your existing OpenTelemetry setup you can retain when switching to another tool.
What Can You Replace in an OpenTelemetry Stack?
In an OpenTelemetry-based observability stack, you can replace application instrumentation, the Collector, or the backend without replacing the entire setup. Each serves a different purpose:
- Application instrumentation: OpenTelemetry APIs, SDKs, and zero-code instrumentation generate telemetry from applications. Proprietary agents and eBPF-based tools can collect supported request and dependency data without manual SDK instrumentation. Custom spans and business attributes still require application-level instrumentation.
- Collection and processing: The OpenTelemetry Collector receives, processes, and exports telemetry. It can batch, filter, and sample data before forwarding it to a backend. Alternatives such as Vector and Fluent Bit can replace parts of this pipeline, but their signal support and processing capabilities differ.
- Telemetry transport: OTLP carries traces, metrics, and logs over gRPC or HTTP. It is a protocol rather than a separate agent or backend. Keeping OTLP allows compatible replacements to receive existing telemetry without changing application instrumentation.
- Storage and analysis: OpenTelemetry does not provide a backend for storing, querying, or visualizing telemetry. You can replace these systems with a managed observability platform while retaining existing OpenTelemetry SDKs or Collectors.
These components can also work together. For example, you can keep OpenTelemetry SDKs for custom spans while using groundcover’s eBPF sensor to capture supported application traffic and ingest those spans over OTLP. Alternatively, you can retain your existing backend and replace only the Collector.
Top OpenTelemetry Alternatives at a Glance
This table gives you a quick snapshot of the nine OpenTelemetry alternatives we’ll cover in detail.
Best OpenTelemetry Alternatives Compared
Let’s take a closer look at each OpenTelemetry alternative, including its capabilities, compatibility with existing instrumentation, deployment requirements, pricing, and limitations.
1. groundcover: Best for Full-Stack Kubernetes Observability and AI-Assisted Root Cause Analysis
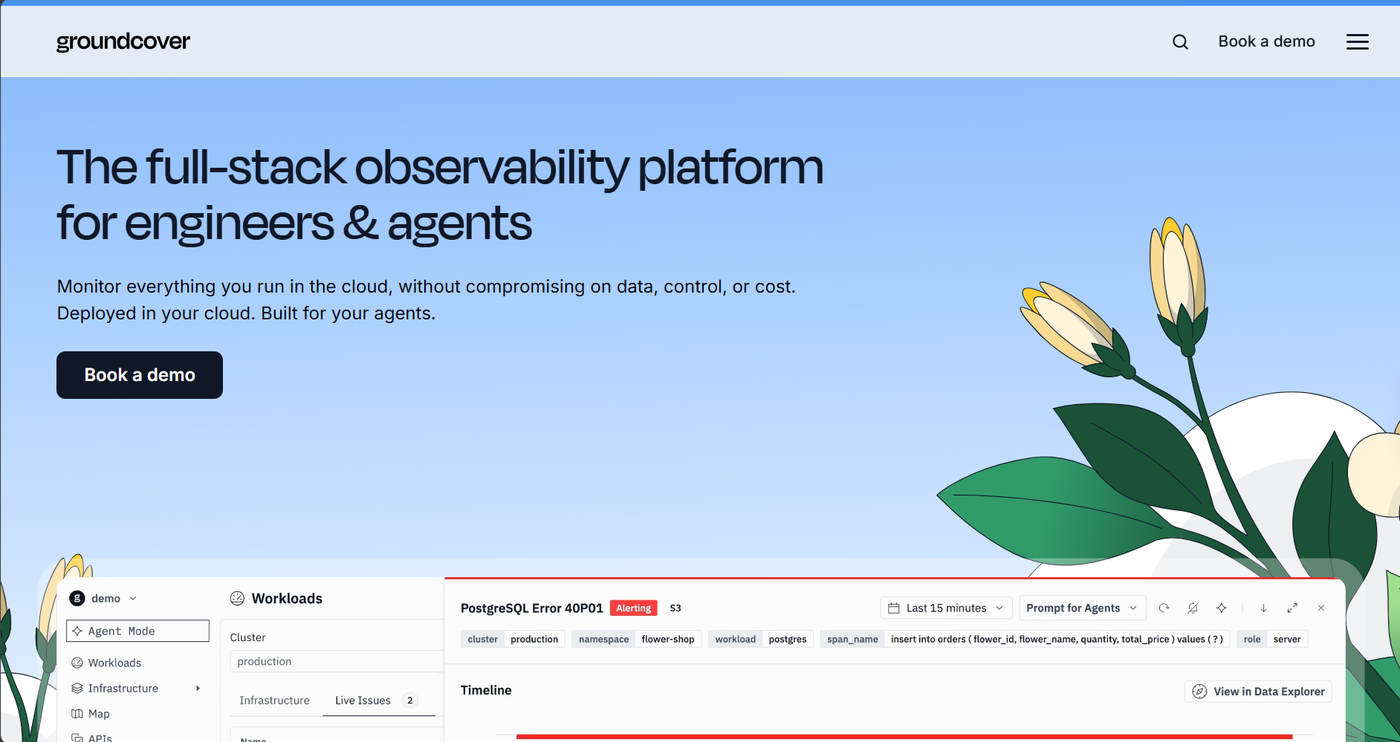
groundcover is a full-stack observability platform that uses eBPF to collect application and infrastructure telemetry without requiring SDK instrumentation in every service. Its sensor runs as a Kubernetes DaemonSet, automatically discovering supported application traffic and service dependencies while collecting logs, metrics, traces, and Kubernetes events. Existing OpenTelemetry instrumentation can also send telemetry to groundcover over OTLP, while its Bring Your Own Cloud (BYOC) architecture keeps the observability backend in your cloud account.
Key Capabilities
- Automatic application monitoring: eBPF auto-instrumentation captures supported HTTP, gRPC, database, and messaging traffic without code changes, providing request latency, error rates, throughput, and service dependency maps. The sensor observes supported requests while using configurable sampling to determine which detailed traces are retained.
- Correlated telemetry and service maps: groundcover connects traces, logs, metrics, and Kubernetes events with workload context, helping you investigate slow requests, failed database operations, and affected dependencies. Its log and trace correlation also makes it easier to move between application errors and the infrastructure involved.
- OpenTelemetry integration: Existing applications can export telemetry over OTLP/gRPC or OTLP/HTTP without replacing their SDKs. groundcover enriches incoming spans with Kubernetes metadata and can derive APM measurements from OpenTelemetry spans, even when eBPF isn’t used for application tracing.
- Telemetry processing: groundcover supports filtering, enrichment, transformation, and sensitive-data obfuscation through OTTL-based trace pipelines. You can also use its agent to generate and preview OTTL rules against actual spans before applying them, reducing manual pipeline configuration work.
- AI-assisted troubleshooting: Agent Mode investigates issues across logs, metrics, traces, and Kubernetes events using natural-language queries. It can also create dashboards, monitors, and queries. Through the groundcover MCP Server, external AI assistants and coding agents can access production observability data directly from their development workflows.
-
Collaborative AI Investigations (beta): groundcover Investigations provides a shared workspace where engineers and AI agents investigate incidents through hypotheses, findings, and supporting evidence. You can inspect the queries behind each finding, challenge suspected causes, and collaborate with agents rather than relying solely on a generated incident summary. - BYOC and deployment flexibility: The BYOC architecture keeps telemetry processing and storage in your cloud account while groundcover manages the backend. ClickHouse stores logs, traces, and Kubernetes events, while VictoriaMetrics stores metrics. On-premises and air-gapped deployments provide additional options for environments with stricter data residency requirements.
Cons
- Application-specific instrumentation: eBPF cannot generate custom spans for internal application functions or business events. However, groundcover can ingest and correlate these spans through OpenTelemetry, allowing you to combine kernel-level visibility with application-specific context.
Pricing
groundcover pricing is based on the monthly average of monitored Kubernetes nodes or Linux hosts. The Free plan costs $0 with 12-hour retention, Pro costs $30, Enterprise $35, and On-Premise $50 per host per month. There are no separate ingestion, custom-metric, or per-user fees. BYOC infrastructure costs are billed separately by your cloud provider.
2. Datadog: Best for SaaS Monitoring Across Multi-Cloud Environments
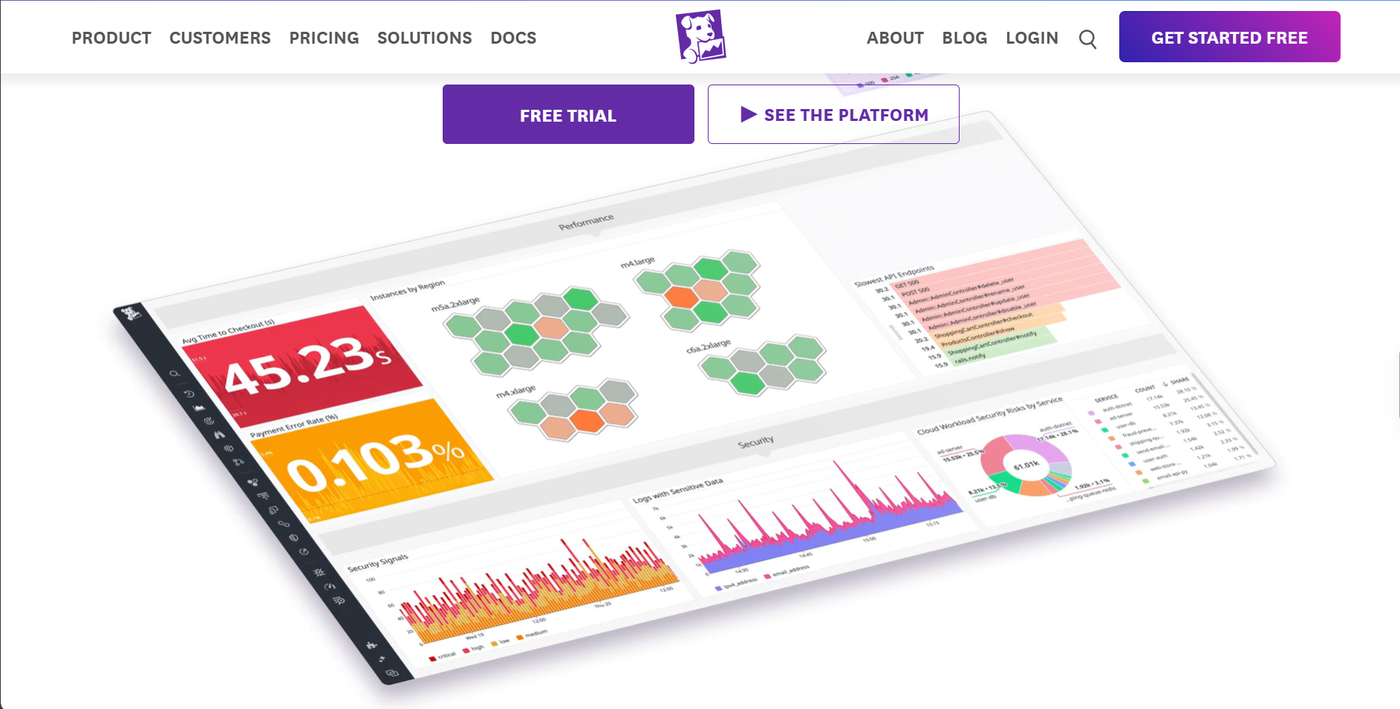
Datadog is a SaaS observability platform that combines application performance monitoring, infrastructure metrics, logs, and distributed tracing. It collects telemetry through language-specific tracing libraries and the Datadog Agent, while supporting OpenTelemetry ingestion through OTLP. Teams can retain their existing OpenTelemetry SDKs and move telemetry storage, analysis, dashboards, and alerting to Datadog.
Key Capabilities
- OpenTelemetry ingestion: Datadog accepts OTLP traces, metrics, and logs through its Agent, an upstream OpenTelemetry Collector, or direct ingestion endpoints. Its DDOT Collector also supports OpenTelemetry Collector configurations and export to multiple destinations, although the standalone distribution remains in Preview.
- Application performance monitoring: Datadog’s language-specific tracing libraries collect request latency, errors, and distributed traces. Service maps connect instrumented services, while APM metrics help identify slow endpoints and failing dependencies.
- Automatic service discovery: Universal Service Monitoring uses eBPF to discover supported services and collect request, error, and latency metrics without application instrumentation. Detailed distributed tracing and custom application spans still require instrumentation.
- Cross-signal analysis: Datadog connects application traces with infrastructure metrics, logs, and deployment changes. Additional products support continuous profiling, real user monitoring, synthetic monitoring, and AI-assisted incident investigations.
Cons
- OpenTelemetry feature differences: Telemetry generated through OpenTelemetry SDKs does not support certain Datadog features, including App and API Protection, Continuous Profiler, and Ingestion Rules.
- Trace retention and indexing: Datadog retains selected spans through its retention filters rather than automatically preserving every ingested span for long-term searches. You can configure additional retention rules, but indexing more spans can increase costs.
- SaaS-based APM storage: Datadog hosts application telemetry in its managed backend. Its BYOC logs offering does not provide an equivalent customer-hosted APM backend.
- Multiple billing components: APM, infrastructure monitoring, log management, custom metrics, and additional trace ingestion or indexing have separate billing considerations.
Pricing
Datadog APM starts at $31 per host per month on annual billing with separately billed Infrastructure Monitoring, which starts at $15 per host per month. Standalone APM starts at $36 per host per month. Each APM host includes 150 GB of ingested spans and one million indexed spans monthly. Additional ingestion, indexing, and monitoring products incur separate charges.
3. New Relic: Best for Custom APM Analytics and Performance Investigation
New Relic combines application performance monitoring, infrastructure metrics, logs, and distributed tracing in a managed SaaS platform. It supports native OTLP ingestion, allowing applications already instrumented with OpenTelemetry to export telemetry without installing New Relic’s language agents. New Relic also offers language-specific APM agents and eBPF monitoring for Linux and Kubernetes workloads.
Key Capabilities
- Native OpenTelemetry ingestion: New Relic accepts traces, metrics, and logs over OTLP/gRPC or OTLP/HTTP through regional endpoints. Existing OpenTelemetry SDKs and Collectors can export directly to its backend using a license key for authentication.
- Hybrid instrumentation: Supported New Relic language agents can capture telemetry created through OpenTelemetry APIs while retaining existing New Relic instrumentation. This allows teams to introduce vendor-neutral custom spans gradually.
- eBPF application monitoring: New Relic’s eBPF agent discovers services and collects application and network performance data on Linux hosts and Kubernetes without code changes.
- Telemetry analysis: New Relic connects application traces, logs, infrastructure metrics, and errors. NRQL supports custom queries, dashboards, and alerts, while additional monitoring capabilities cover browser and mobile applications.
Cons
-
SaaS-only backend: New Relic stores application telemetry in its managed cloud rather than offering a customer-hosted observability backend. - Language-dependent OpenTelemetry API support: Hybrid agent capabilities vary by language. For example, the Python agent supports the OpenTelemetry Tracing API but does not enable its Metrics API.
- Multiple pricing dimensions: Under user-based pricing, telemetry ingestion and paid user access contribute to the bill. Consumption-based Core Compute is an alternative currently in Preview, while advanced capabilities can introduce additional compute charges.
Pricing
New Relic pricing includes 100 GB of free monthly ingestion and one free full-platform user. Additional ingestion costs $0.40 per GB for Original Data or $0.60 per GB for Data Plus. Under user-based pricing, Core users cost $49 each, Standard full-platform access costs $10 for the first paid user and $99 for each additional user (up to five), and Pro costs $349 per full-platform user per month with an annual commitment. Compute-based pricing is available under separate terms.
4. Dynatrace: Best for Automated Enterprise Application Monitoring
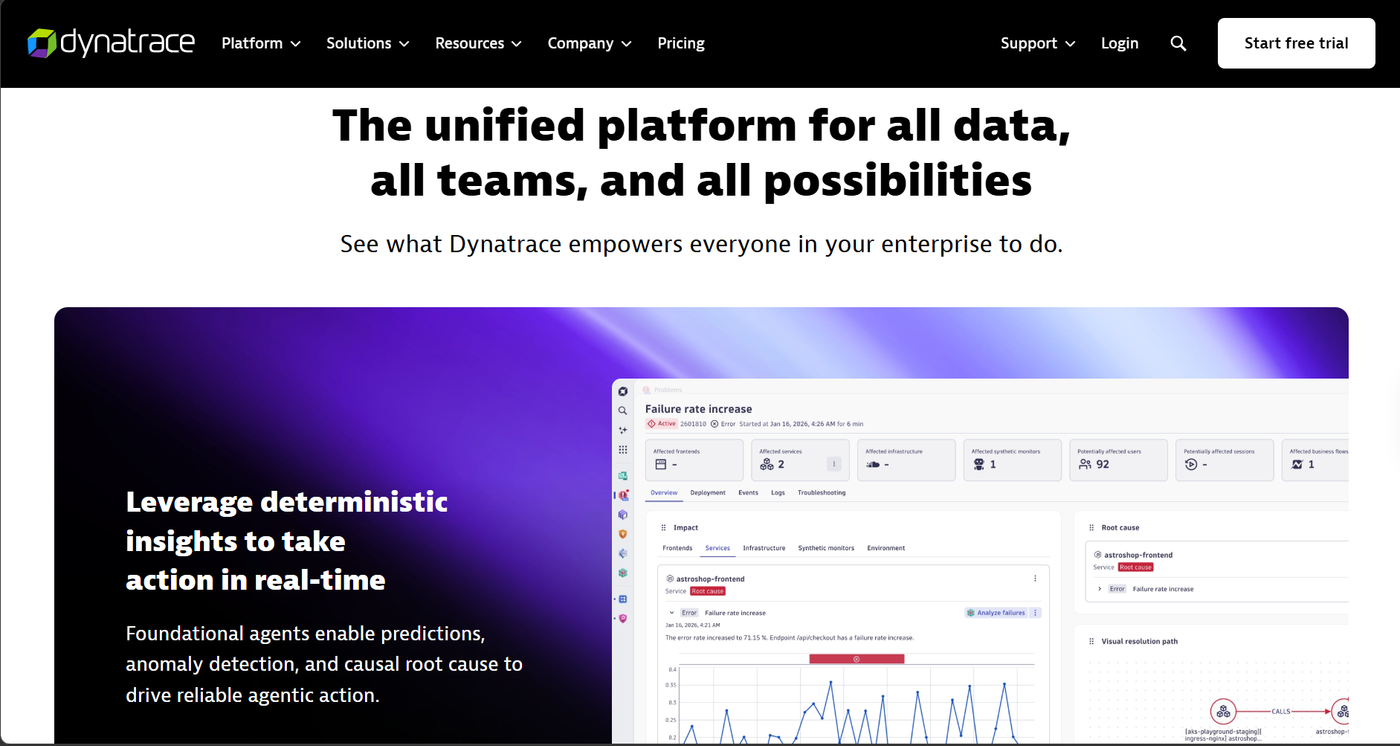
Dynatrace provides application and infrastructure monitoring through OneAgent, which automatically instruments supported runtimes, discovers service dependencies, and collects performance telemetry. Its managed backend also accepts OpenTelemetry traces, metrics, and logs through OTLP, allowing teams to retain existing SDK instrumentation while using Dynatrace for analysis and incident investigation.
Key Capabilities
- Automatic application instrumentation: OneAgent discovers supported applications and collects request latency, errors, distributed traces, and code-level performance data without manual SDK instrumentation. Service dependency maps connect application behavior with the underlying infrastructure.
- OpenTelemetry integration: Dynatrace accepts traces, metrics, and logs through OTLP/HTTP, either directly or through an OpenTelemetry Collector. Existing OpenTelemetry spans can also be combined with OneAgent instrumentation for supported applications.
- Automated problem analysis: Dynatrace correlates performance anomalies with service dependencies, infrastructure health, and deployment changes to identify suspected causes and affected services.
- Cross-signal analysis: Dynatrace combines application traces with infrastructure metrics, logs, and Kubernetes data. Its Grail backend supports querying and analyzing telemetry across these signals.
Cons
- Limited OTLP transport support: Dynatrace’s native OTLP API accepts HTTP with binary protobuf but does not accept gRPC or JSON. Applications exporting over OTLP/gRPC must change their exporter configuration or route data through a Collector that converts it to HTTP.
- OneAgent-dependent capabilities: Direct OTLP ingestion provides access to existing telemetry, but some automatic application discovery and code-level diagnostics depend on OneAgent. Retaining OpenTelemetry SDKs alone does not reproduce every OneAgent feature.
- Multiple billing components: Full-Stack Monitoring is priced by monitored host memory, while additional log and trace processing, retention, queries, and AI operations can introduce separate consumption charges.
Pricing
Dynatrace Full-Stack Monitoring costs $0.01 per memory-GiB-hour, approximately $58 per month for an 8 GiB host. Infrastructure Monitoring starts at $0.04 per host-hour. Log and trace ingestion starts at $0.20 per GiB, with separate retention and query rates where applicable. Full-Stack Monitoring includes certain telemetry allowances, and additional usage draws against the platform’s consumption commitment.
5. Splunk Observability Cloud: Best for Enterprise Metrics and Distributed Tracing
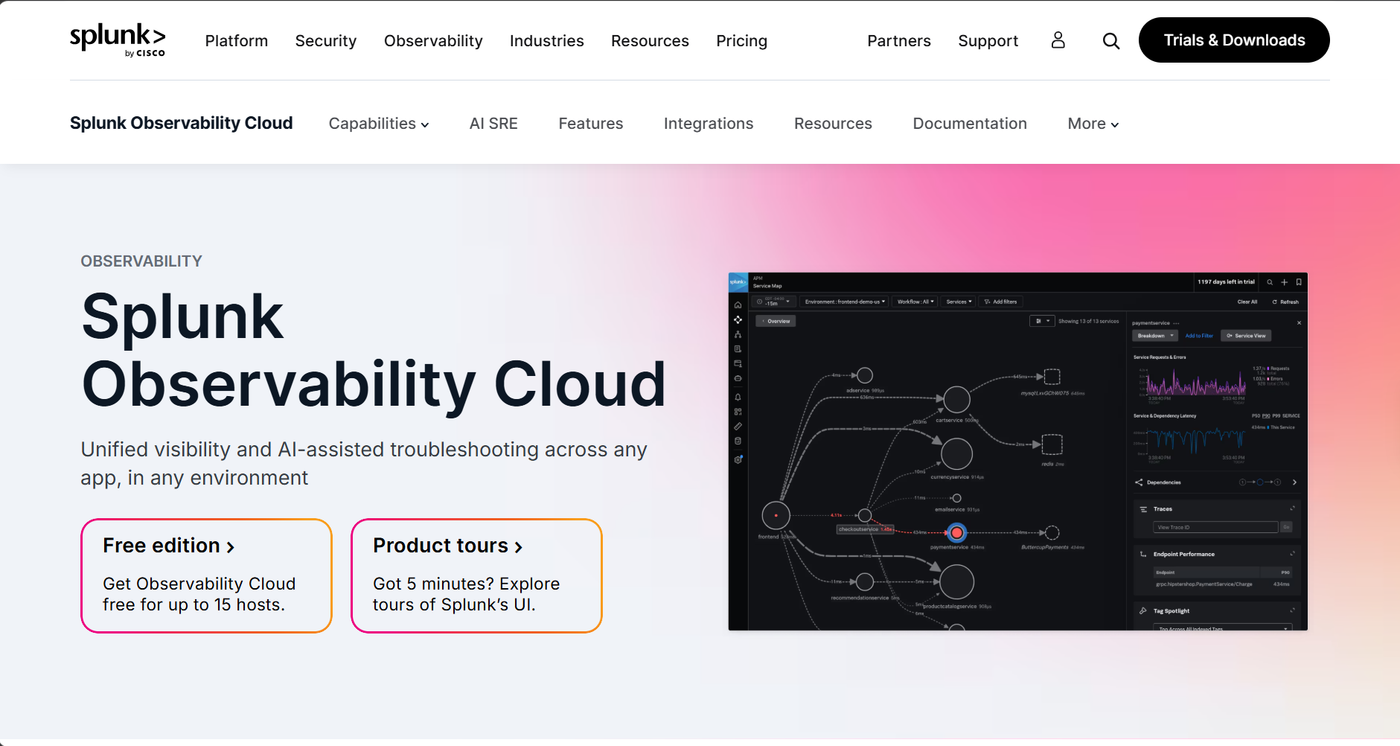
Splunk Observability Cloud combines infrastructure monitoring, application performance monitoring, and distributed tracing in a managed SaaS platform. It relies on OpenTelemetry-based collection, primarily through the Splunk Distribution of the OpenTelemetry Collector, making it suitable for teams that want to retain OpenTelemetry instrumentation while moving their observability backend to Splunk.
Key Capabilities
- OpenTelemetry-based collection: The Splunk Distribution of the OpenTelemetry Collector receives, processes, and forwards metrics and traces from applications and infrastructure. Existing OpenTelemetry SDKs can continue producing telemetry without being replaced by proprietary instrumentation.
- Application performance monitoring: Splunk APM analyzes distributed traces to identify slow operations, failed requests, and service dependencies. Its NoSample tracing approach supports analysis of ingested trace data without requiring conventional head-based sampling.
- Infrastructure monitoring: Splunk monitors hosts, containers, and Kubernetes workloads using infrastructure metrics, dashboards, and alerting. Service-level views help connect application performance issues with resource health.
- Log correlation: Log Observer Connect lets engineers investigate logs stored in Splunk Cloud Platform or Splunk Enterprise alongside application and infrastructure telemetry.
Cons
- Collector operations remain: Splunk’s distribution is based on the OpenTelemetry Collector. Teams must still deploy, configure, scale, and maintain their collection pipelines rather than eliminating the Collector layer.
- Separate logging platform: Splunk Observability Cloud connects to logs stored in Splunk Cloud Platform or Splunk Enterprise. Teams that need centralized log storage and analysis must account for that separate product and its licensing.
- SaaS-based observability backend: Application traces and monitoring data are stored in Splunk Observability Cloud. Running Splunk Enterprise on-premises does not provide an equivalent self-hosted deployment of Observability Cloud.
- Higher-tier monitoring costs: Infrastructure Monitoring has a lower starting price, but application tracing and additional digital experience capabilities require higher-priced packages. Database Monitoring and some other capabilities are separately licensed.
Pricing
Splunk Observability Cloud has a Free Edition for up to 15 hosts. Paid plans start at $15 per host per month for Infrastructure Monitoring, $60 for App & Infra with APM, and $75 for End-to-End monitoring with additional digital experience capabilities, billed annually. Database Monitoring and other add-ons may increase the total cost.
6. Coroot: Best for Open-Source eBPF Observability
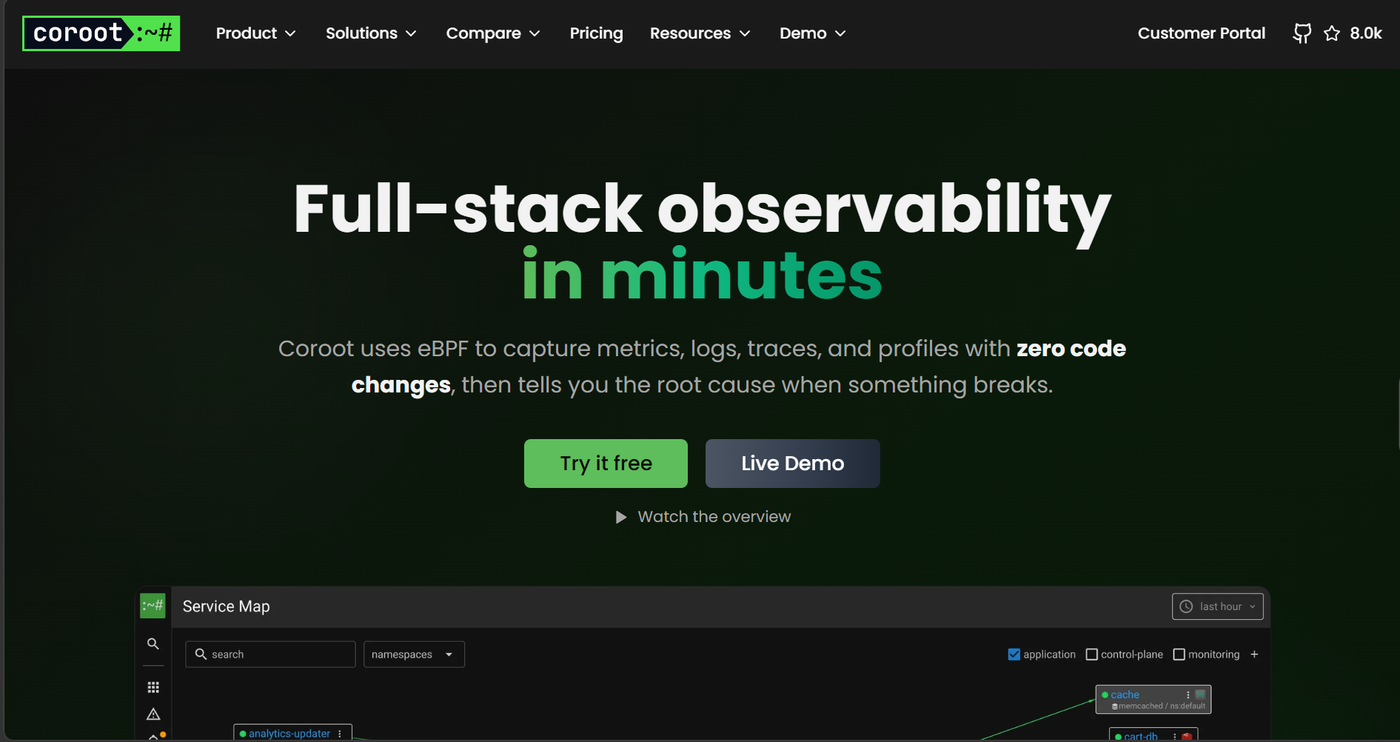
Coroot is an open-source observability platform that uses eBPF to collect application and infrastructure telemetry without requiring code changes. Its node agent gathers metrics, logs, traces, and profiling data, while Coroot provides service maps, performance analysis, and alerting. It also accepts OpenTelemetry traces, allowing you to combine automatic traffic monitoring with existing application instrumentation.
Key Capabilities
- Automatic telemetry collection: Coroot uses eBPF to discover service connections and capture supported application traffic without SDK instrumentation. It provides request latency, error metrics, and service dependency maps for monitored workloads.
- OpenTelemetry compatibility: Applications can send OpenTelemetry traces to Coroot over OTLP. Existing SDK spans provide application-specific context alongside traffic captured through eBPF.
- Integrated telemetry analysis: Coroot connects application metrics, logs, traces, and continuous profiling. Its tracing interface supports investigating latency outliers and comparing request behavior across different time periods.
- Open-source deployment: The Community Edition includes service mapping, distributed tracing, log analysis, profiling, SLO tracking, and alerting. Teams can deploy it on their own infrastructure without purchasing a software subscription.
Cons
- Self-hosted backend management: Coroot users are responsible for operating and maintaining the observability infrastructure, including storage, capacity planning, upgrades, and backups. The free software license does not eliminate these operational costs.
- Advanced features require Enterprise: Community Edition includes fixed Admin, Editor, and Viewer roles, but custom RBAC permissions and SSO require Enterprise.
Pricing
Coroot’s Community Edition is free to self-host. Its Standard plan starts at $1 per monitored CPU core per month, with volume discounts available. A cluster containing 10 nodes with four monitored vCPUs each would cost $40 per month in software fees. Premium plans require a custom quote. Infrastructure and storage costs remain the customer’s responsibility.
7. Grafana Beyla: Best for Open-Source Zero-Code Instrumentation
Grafana Beyla uses eBPF to collect application performance metrics and traces without modifying application code. It captures supported HTTP, gRPC, database, and messaging traffic and exports telemetry to OpenTelemetry-compatible or Prometheus backends. Beyla is Grafana’s distribution of OpenTelemetry eBPF Instrumentation (OBI), which reached version 1.0 in October 2026. It replaces some SDK instrumentation work but does not provide a telemetry backend.
Key Capabilities
- Automatic application instrumentation: Beyla captures request latency, error rates, throughput, and supported distributed traces without installing language-specific SDKs. It works with applications written in Go, Java, .NET, Node.js, Python, Ruby, Rust, and C/C++.
- OpenTelemetry and Prometheus export: Beyla exports traces and metrics through OTLP and exposes metrics in Prometheus format. Teams can send the data to an existing OpenTelemetry Collector, Prometheus deployment, Grafana Cloud, or another compatible backend.
- Distributed tracing: Beyla supports W3C trace context propagation between supported services. It can also correlate requests across instrumented applications, although propagation depends on the runtime, protocol, and kernel configuration.
- SDK coexistence: Beyla can run alongside OpenTelemetry-instrumented applications. By default, it detects services already exporting traces or metrics and suppresses the corresponding signal to avoid duplicate telemetry. Applications can retain SDK instrumentation for deeper application context.
Cons
- No observability backend: Beyla collects and exports telemetry but does not store, query, or visualize it. Teams still need separate systems for storage, dashboards, and alerting.
- Limited application-level detail: Beyla automatically captures supported request and dependency operations, but it does not generate arbitrary internal function spans or business events. These require additional application instrumentation.
- Framework-specific tracing limitations: Distributed trace correlation is less reliable for some asynchronous frameworks. Reactive Java applications, Python asyncio services, and certain .NET scenarios may require OpenTelemetry SDKs for reliable traces.
- Kernel requirements: Beyla requires Linux kernel 5.8 or later with BTF support, with exceptions for certain distributions containing backported eBPF features. HTTP header-based trace propagation requires kernel 5.17 or later and additional permissions.
Pricing
Grafana Beyla is free and open source. There are no software licensing fees, but teams pay for the infrastructure running Beyla and the observability backend receiving its data. Managed backend services may introduce separate ingestion, storage, and retention charges.
8. SigNoz: Best for An OpenTelemetry-Native Backend
SigNoz is an open-source observability platform for storing, querying, and analyzing OpenTelemetry traces, metrics, and logs. It uses ClickHouse for telemetry storage and provides application performance monitoring, dashboards, and alerting. Teams can retain existing OpenTelemetry instrumentation and send telemetry to SigNoz rather than assembling and operating separate observability backends.
Key Capabilities
- Native OpenTelemetry ingestion: SigNoz accepts OTLP traces, metrics, and logs from OpenTelemetry SDKs, Collectors, and compatible agents. Existing instrumentation can continue exporting telemetry without switching to proprietary APIs.
- Application and infrastructure analysis: SigNoz connects distributed traces with application metrics, logs, and infrastructure data. Service maps, trace exploration, and dashboards help identify slow operations, errors, and affected dependencies.
- Deployment flexibility: SigNoz offers a free self-hosted Community Edition and a managed Cloud service. Enterprise customers can also choose dedicated cloud environments, managed BYOC deployments, or supported self-hosting.
- AI investigation tools: SigNoz Cloud includes Noz, an AI assistant for exploring telemetry and investigating incidents. Its MCP server also allows compatible coding assistants and AI agents to access observability data.
Cons
- Instrumentation work remains: SigNoz primarily replaces the observability backend, not application instrumentation. Teams still need OpenTelemetry SDKs, automatic instrumentation, or compatible agents to generate application telemetry.
- Self-hosted maintenance: Community Edition users manage their own storage, scaling, upgrades, backups, and availability. Operating the ClickHouse-based backend adds infrastructure responsibilities.
- Enterprise-only managed BYOC: Managed deployment in your own cloud account requires an Enterprise subscription rather than the standard Cloud plan.
- Volume-based cloud billing: SigNoz Cloud charges for ingested logs, traces, and metric samples. Costs depend on telemetry volume and retention settings, although ingestion limits can help control spending.
Pricing
SigNoz offers a free self-hosted Community Edition. SigNoz Cloud Teams starts at $49 per month, including $49 of telemetry usage. Beyond the included usage, logs and traces cost $0.30 per GB ingested, while metrics cost $0.10 per million samples. Enterprise plans start at $4,000 per month and include dedicated deployment and managed BYOC options.
9. Prometheus: Best for Metrics-Only Monitoring
Prometheus is an open-source monitoring system that collects, stores, and queries time-series metrics. It primarily scrapes instrumented applications and exporters, but it can also receive OpenTelemetry metrics over OTLP/HTTP. Teams can use Prometheus instead of an OpenTelemetry metrics backend while retaining their existing instrumentation. It does not collect or store application logs and distributed traces.
Key Capabilities
- Metrics collection: Prometheus scrapes metrics from applications, infrastructure exporters, and Kubernetes workloads. Service discovery helps it find monitoring targets as workloads are created or removed.
- OpenTelemetry metrics ingestion: Prometheus accepts OTLP/HTTP metrics when its receiver is enabled with
--web.enable-otlp-receiver. Existing OpenTelemetry SDKs and Collectors can export metrics to/api/v1/otlp/v1/metricswithout switching to Prometheus-specific instrumentation. - PromQL and alerting: PromQL supports querying, aggregating, and analyzing time-series data. Recording rules calculate commonly used expressions, while alerting rules detect conditions such as elevated error rates or resource saturation.
- Open integration options: Prometheus supports exporters, remote write, and federation. Teams can connect it to Grafana for dashboards or use remote storage systems for longer retention and larger deployments.
Cons
- Metrics only: Prometheus does not provide distributed tracing or centralized log storage. Teams investigating individual requests across services need additional observability tools.
- Limited OTLP compatibility: Its OTLP receiver accepts HTTP rather than gRPC and is disabled by default. Delta-to-cumulative metric conversion also requires an experimental feature flag, so existing OpenTelemetry metrics pipelines may need configuration changes.
- Storage and scaling management: Prometheus uses a local time-series database. Teams requiring long-term retention, high availability, or large-scale distributed querying must manage additional infrastructure or integrate complementary systems.
Pricing
Prometheus is free and open source. You pay for the servers, storage, networking, and operational resources needed to run it. External long-term storage, managed hosting, and visualization services may introduce additional costs.
What Can Replace the OpenTelemetry Collector?
If you want to keep your existing instrumentation and observability backend, you can replace the OpenTelemetry Collector with another tool for receiving, processing, and forwarding telemetry. However, these alternatives differ in their OTLP support, processing capabilities, and configuration requirements.
- Grafana Alloy: Alloy combines OpenTelemetry pipelines with Prometheus metrics collection and support for logs, traces, and profiles. You can use it to collect, process, and export telemetry to compatible backends. Its standard configuration uses Alloy syntax, so existing Collector YAML requires migration. The Alloy OpenTelemetry Engine can run Collector YAML directly, but this feature remains in public preview. Alloy is itself a Collector distribution, so it changes how you manage collection rather than eliminating the Collector architecture.
- Fluent Bit: Fluent Bit provides lightweight telemetry collection and forwarding, particularly for logs. Its OpenTelemetry input receives logs, metrics, and traces over OTLP/HTTP or OTLP/gRPC, while its output can forward those signals and profiles using either transport. You configure collection, filtering, and routing through Fluent Bit’s own pipeline model, so existing OpenTelemetry Collector processors and YAML configurations cannot be reused directly.
- Vector: Vector focuses on transforming and routing telemetry before it reaches your backend. Its OpenTelemetry source accepts logs, metrics, and traces over OTLP/gRPC or HTTP, while its OpenTelemetry sink exports over HTTP. Both components remain in beta, and trace handling is experimental. When you preserve the OTLP representation of metrics, Vector handles them as log events, which prevents you from applying its native metric transformations.
- Mezmo: Mezmo provides managed telemetry processing for logs, metrics, and traces received over OTLP/HTTP. You can filter unnecessary records, redact sensitive information, deduplicate logs, route telemetry, and apply trace sampling before forwarding data to storage. However, Mezmo does not automatically replace node-level collection. If your Collector gathers host metrics, reads log files, or discovers Kubernetes workloads, you still need an agent to perform those tasks. Pricing depends on data volume and retention.
Replacing the Collector changes how your telemetry is processed and delivered, but it does not remove application instrumentation or provide a complete observability backend. If you also want to eliminate SDK rollouts and backend management, a full-stack eBPF platform such as groundcover addresses more of the observability stack.
How to Choose the Right OpenTelemetry Alternative
To choose between these options, first identify what’s creating the most work in your observability setup. You might want to eliminate manual SDK instrumentation, stop maintaining Collectors, reduce backend costs, or keep telemetry inside your cloud account. The right alternative depends on which of these problems you need to solve.
Consider the following criteria before making a decision:
- Instrumentation requirements: Check how much application code or configuration you need to change. eBPF-based tools such as groundcover can automatically capture supported requests, database calls, and service dependencies without SDK instrumentation. If you need custom spans for internal functions or business events, confirm that you can retain your existing OpenTelemetry SDKs.
- Signal coverage and correlation: Verify that you can collect logs, metrics, traces, and Kubernetes events from the same environment. More importantly, check whether you can move from a slow request to its related logs, service dependencies, and infrastructure metrics without switching tools. Supporting multiple signals is less useful when you cannot investigate them together.
- OpenTelemetry compatibility: Check whether the platform accepts OTLP/gRPC, OTLP/HTTP, or both. Confirm which signals it supports and how it handles resource attributes and trace sampling. If you already use OpenTelemetry, an alternative that accepts your existing telemetry lets you preserve custom instrumentation while reducing the work required to migrate.
- Deployment and data ownership: Compare SaaS, self-hosted, and Bring Your Own Cloud (BYOC) deployments. Self-hosting gives you control over storage but leaves you responsible for upgrades, scaling, and availability. With groundcover’s BYOC architecture, telemetry processing and storage remain in your cloud account while groundcover manages the backend. Check where data is stored and queried, who can access it, and which operational responsibilities remain yours.
- Resource overhead: Measure CPU, memory, and application latency before and after deploying an observability agent. Consider how its resource usage scales with nodes, pods, and telemetry volume. An eBPF-based DaemonSet can provide visibility across supported workloads on a node without adding an instrumentation agent to every service, but it still consumes resources. Use this Kubernetes agent benchmarking guide to compare resource consumption under equivalent workloads.
- Pricing and maintenance costs: Calculate costs using your node count, host memory, telemetry ingestion volume, and retention requirements. Ingestion-based pricing can increase as your applications generate more telemetry. Host-based pricing, such as groundcover’s per-node model, separates the platform subscription from data volume, although you still pay for the infrastructure running its BYOC backend. Include the engineering time required to maintain Collectors, storage, and monitoring configurations.
FAQs
Yes. eBPF-based tools such as groundcover, Coroot, and Grafana Beyla collect supported application requests, latency metrics, and service dependencies without requiring OpenTelemetry SDKs. Dynatrace OneAgent also provides automatic instrumentation for supported runtimes. However, you may still need application-level instrumentation to capture custom business events, internal function spans, and attributes unavailable through automatic collection.
Not necessarily. If your new observability platform accepts OTLP, you can retain existing OpenTelemetry SDKs and change their export destinations through configuration. Switching to eBPF-based instrumentation can also reduce SDK requirements without changing application code. Code changes become necessary when you replace custom OpenTelemetry instrumentation with proprietary APIs or need application-specific telemetry that automatic instrumentation cannot capture.
Yes. Datadog, New Relic, Dynatrace, groundcover, and SigNoz support OTLP ingestion, but their supported signals and transports differ. For example, Dynatrace accepts OTLP/HTTP with binary protobuf but not OTLP/gRPC, while Prometheus accepts OTLP metrics over HTTP when its receiver is enabled. Check transport compatibility, signal support, and attribute handling before changing exporters.
Choose an option that minimizes the infrastructure and instrumentation you need to maintain. If you run Kubernetes, groundcover can reduce that work through eBPF-based collection and a managed BYOC backend, while keeping telemetry in your cloud account. If your applications already export OpenTelemetry data, a managed service such as SigNoz Cloud or New Relic can remove backend maintenance without requiring new instrumentation. Self-hosted alternatives give you more operational control but leave upgrades, scaling, and storage management to you.
OpenTelemetry provides APIs, SDKs, protocols, and collection tools for generating and transporting traces, metrics, and logs. Prometheus focuses on collecting, storing, querying, and alerting on metrics. It does not store distributed traces or logs. You can use both together by sending OpenTelemetry metrics to Prometheus over OTLP/HTTP or exposing metrics for Prometheus to scrape.
OpenTracing standardized distributed tracing APIs, while OpenCensus provided instrumentation for traces and metrics. The two projects merged to form OpenTelemetry in 2019. OpenTracing and OpenCensus are now legacy projects rather than recommended alternatives for new instrumentation. If you still use either, migrating to OpenTelemetry provides access to actively maintained APIs, SDKs, and integrations.
It can, depending on how you instrument applications and manage telemetry. Proprietary APIs can make custom instrumentation harder to migrate, while vendor-specific dashboards, queries, and alerts may need rebuilding when you switch platforms. Keeping custom instrumentation on OpenTelemetry APIs and exporting through OTLP reduces dependency on a particular vendor, although it does not eliminate backend-specific configuration and migration work.