Grafana Variables: Types, Use Cases & Best Practices



Hard-coded values in panel queries make Grafana dashboards harder to reuse across services, namespaces, and environments. If a query is bound to one service, namespace, or data source, you have to edit it whenever you need to inspect a different part of your system. During a latency spike, that can mean manually changing several panel queries or copying a production dashboard just to monitor the same metrics in staging.
Grafana variables fix this by moving those values out of the query and into dashboard controls. You can switch the service, namespace, cluster, or data source without editing every panel. In this guide, you’ll learn what Grafana variables are, how to create and use them in dashboard queries, and how to manage and troubleshoot them as your dashboards scale.
What Are Grafana Variables?
Grafana variables are placeholders for values that change in a dashboard. A variable can hold a service name, namespace, server, application, sensor, data source, or any other value a panel needs. When you change the selected value, Grafana updates the dashboard elements that use that variable. Most variables appear as dropdowns, while some appear as text fields.
Instead of hard-coding the same value into several metric queries, you define a variable once in the dashboard settings and reference it where that value is needed. For example, a panel can use `$namespace` instead of a fixed namespace name. When you select another namespace from the dashboard control, the panel uses the new value without requiring you to edit the query.
Why Grafana Variables Matter for Observability Workflows
Grafana variables move common filters out of panel queries, which makes dashboards easier to adapt, reuse, and share across services and environments.
Variables Keep Investigations in the Dashboard
Troubleshooting rarely stays at the first chart you open. A latency spike might lead you from a service view to a namespace, cluster, pod, or data source. If those values are fixed inside panel queries, each shift pulls you away from the data and into query edits. Grafana variables put those choices in the dashboard UI, so you can keep narrowing the view without editing queries.
One Dashboard Can Serve More Than One View
Different parts of your system often need the same core views, such as request rate, latency, errors, and resource usage. The structure stays the same, but the selected service, namespace, or data source changes. Grafana variables let a single dashboard support those views, which reduces duplicate dashboards and keeps shared monitoring views easier to maintain.
Viewers Can Change the View Without Query Access
A dashboard user may need to inspect another service, namespace, or environment without owning the dashboard. Giving every viewer query access increases the risk of broken panels and inconsistent dashboard behavior. Variables give viewers controlled inputs while the dashboard owner keeps the query structure intact.
Types of Grafana Variables in Modern Dashboards
Grafana supports several variable types, depending on how the dashboard should receive and apply a value.
Query Variables
A query variable gets its values from a data source query. The values are updated from the data source rather than a manual list, which makes this type useful for services, namespaces, hosts, metric names, and other values that change with your telemetry.
Custom Variables
A custom variable uses a list you write yourself. It works for short lists that stay mostly the same, such as environments, regions, or fixed service groups. Grafana reads these values from the variable definition instead of querying a data source.
Textbox Variables
A textbox variable provides a text field to the dashboard user. It works for values that are too specific or too numerous for a dropdown, such as a request ID, trace ID, tenant ID, or exact host name. Since the user types the value, a typo returns an empty view instead of a filtered result.
Constant Variables
A constant variable stores one hidden value. It belongs in the dashboard configuration rather than the visible controls. Use it for repeated query text, such as a metric path prefix, fixed identifier, or shared path segment that the dashboard needs but the viewer does not change.
Data Source Variables
A data source variable switches the data source used by a dashboard. It works when the same dashboard reads from separate source instances, such as production and staging data sources. The queries still need compatible metric names, fields, or labels across those sources.
Interval Variables
An interval variable represents a time span, such as `1m`, `5m`, `1h`, or `1d`. Grafana uses it as a dashboard-wide group-by-time control. Changing the interval changes how charts group data over time.
Ad Hoc Filter Variables
Ad hoc filter variables apply key/value filters across matching queries for a selected data source. You choose the filter once, such as `namespace = checkout`, and Grafana applies it to matching metric queries. Several panels then apply the same service, namespace, or environment filter without repeating the condition in each panel's query.
Chained Variables
Chained variables depend on other variables. A parent selection narrows the next variable. For example, a cluster selection narrows the namespace list, and a namespace selection narrows the pod list. This keeps dashboard controls focused, but long chains add query work because Grafana refreshes dependent variables when a parent value changes.
How to Create Variables in Grafana
In this section, you’ll learn how to create a Grafana variable, configure where its values come from, and apply it to a panel query.
Step 1. Create or Open the Dashboard
Open the dashboard where you want to add the variable. If the dashboard already exists, click Edit. If you’re starting from scratch, click Dashboards → New → New dashboard. Grafana opens a blank dashboard and prompts you to add a visualization.
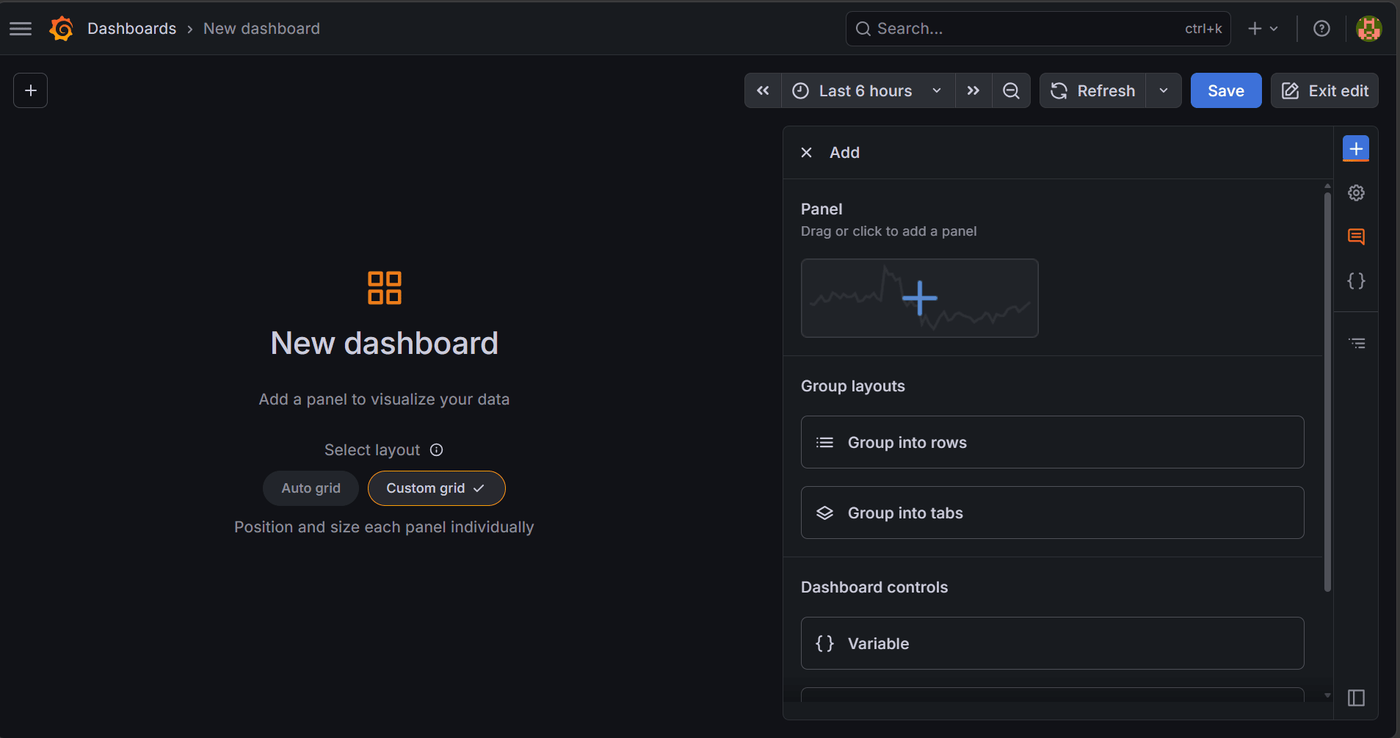
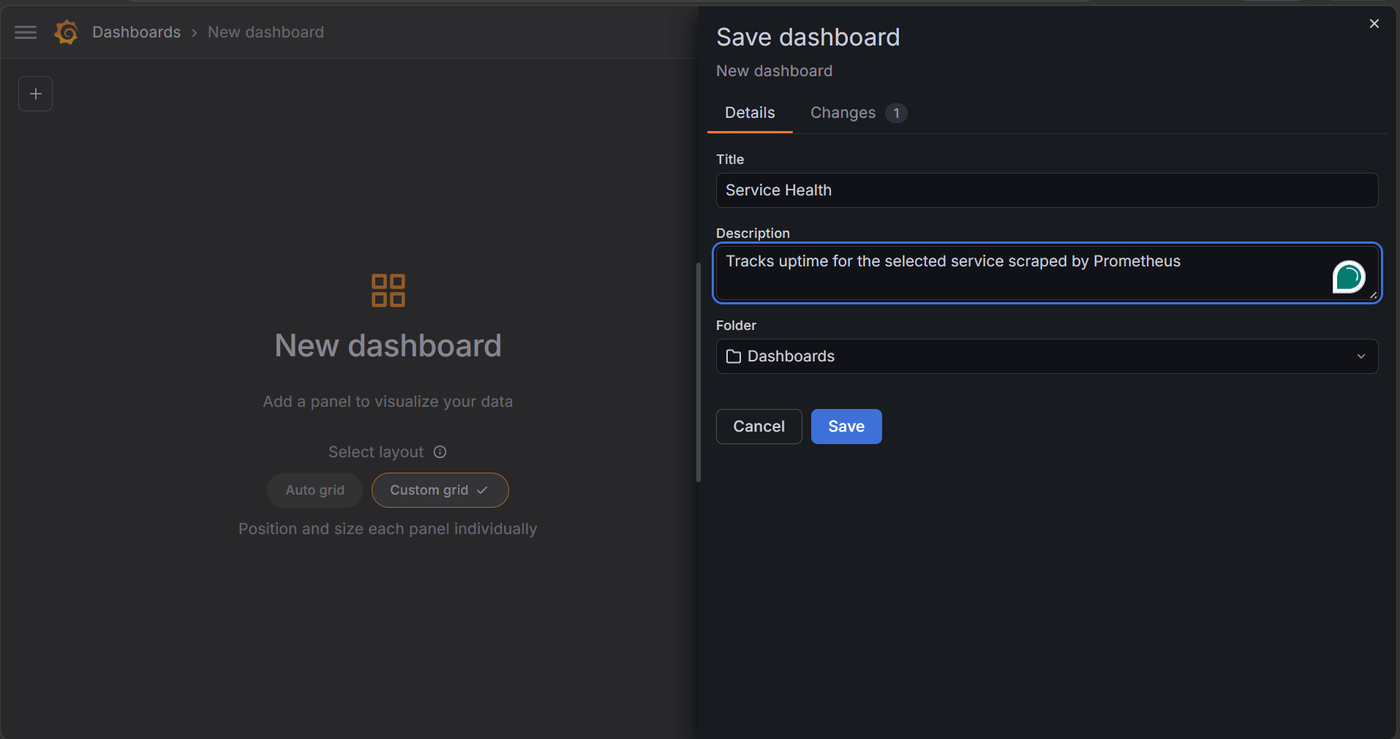
Don't add the visualization yet because the panel query will use the variable you create in the next steps. Click Save, then in the save dialog, set Title to Service Health and set Description to Tracks uptime for the selected service scraped by Prometheus.
Step 2. Open the Variables Section
Click Edit in the top-right corner to return to edit mode. Then, click the Dashboard options icon in the right toolbar.
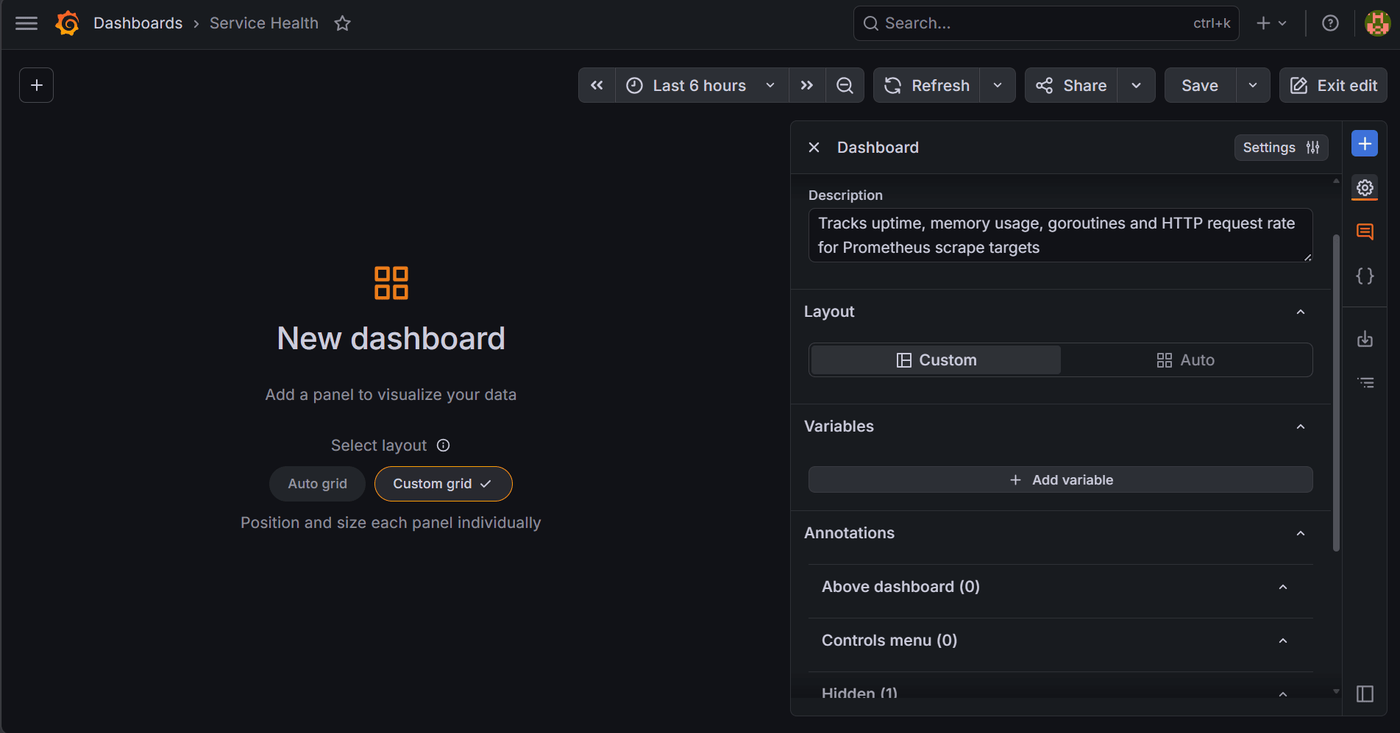
In the settings panel, scroll to Variables and click Add variable to open the Grafana variable type picker.
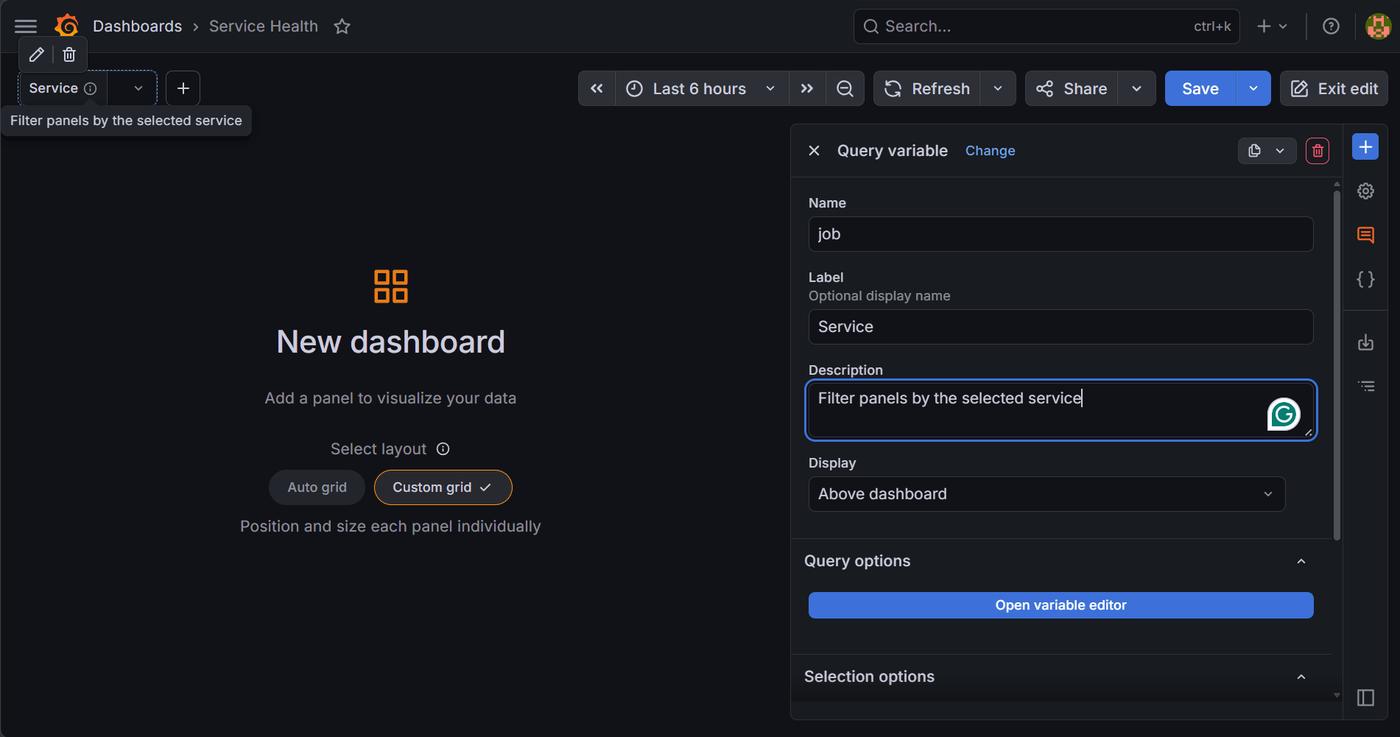
Choose the variable type for the control you want to create. In this guide, we'll use a Query variable because the Service dropdown needs to read its values from Prometheus.
Step 3. Create the Query Variable
In the Query variable screen, set Name to job, Label to Service, and Description to Filter panels by the selected service.
The name `job` matches the Prometheus label used in queries, so you can reference it directly as `$job`. The label Service is what you see in the dashboard. Set Display to Above dashboard so the dropdown stays visible while reading panels instead of being hidden inside a menu.
Step 4. Configure the Query
Scroll to Query options and click Open variable editor. Set Data source to Prometheus and Query type to Label values. This tells Grafana to fetch values from a label instead of returning raw query results. Set Label to `job` and Metric to `up`. This returns the list of job label values from active scrape targets, which keeps the dropdown aligned with what Prometheus is currently scraping.
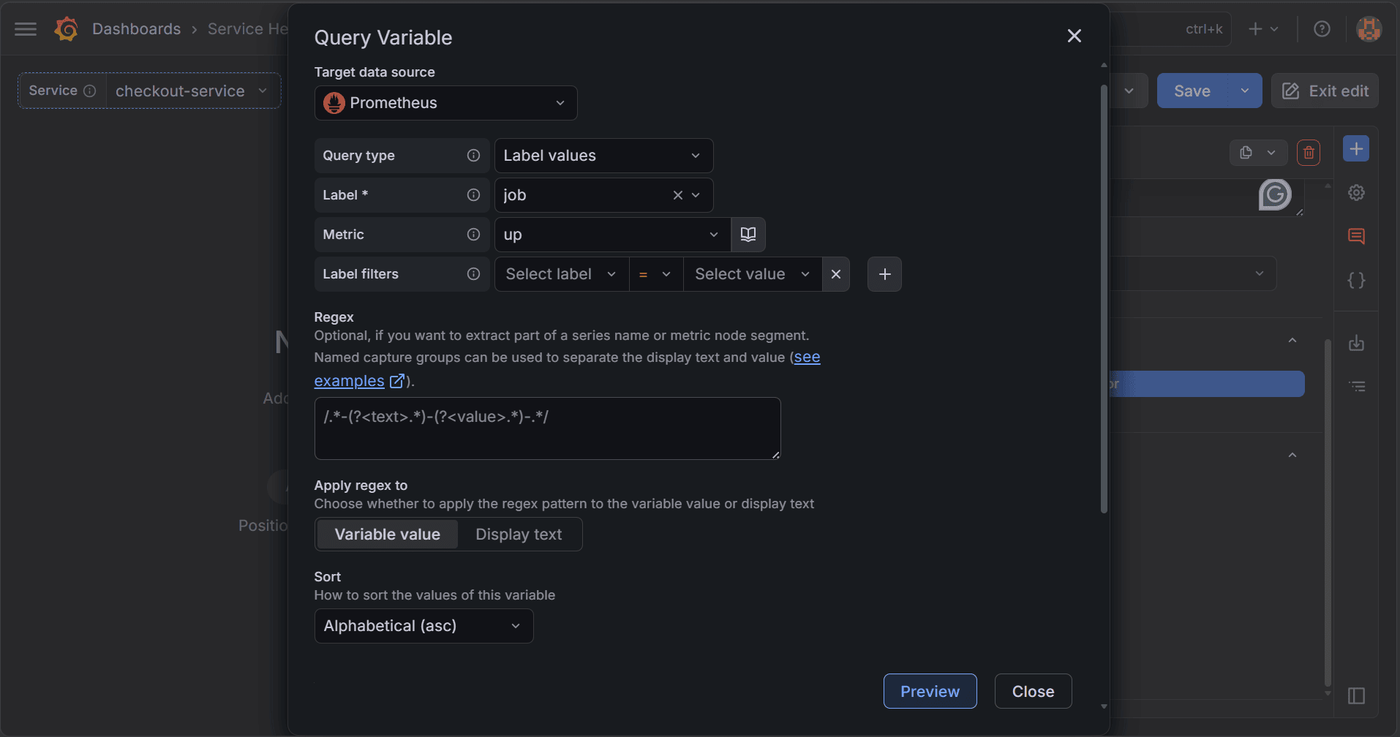
Leave Regex empty so Grafana returns the full list of matching job values. Next, set Sort to Alphabetical (asc) so the service names stay in a predictable order as the list grows.
Step 5. Preview and Save the Variable
Set Refresh to On dashboard load so Grafana updates the service list each time the dashboard opens. Leave Static options off so the variable uses only query results.
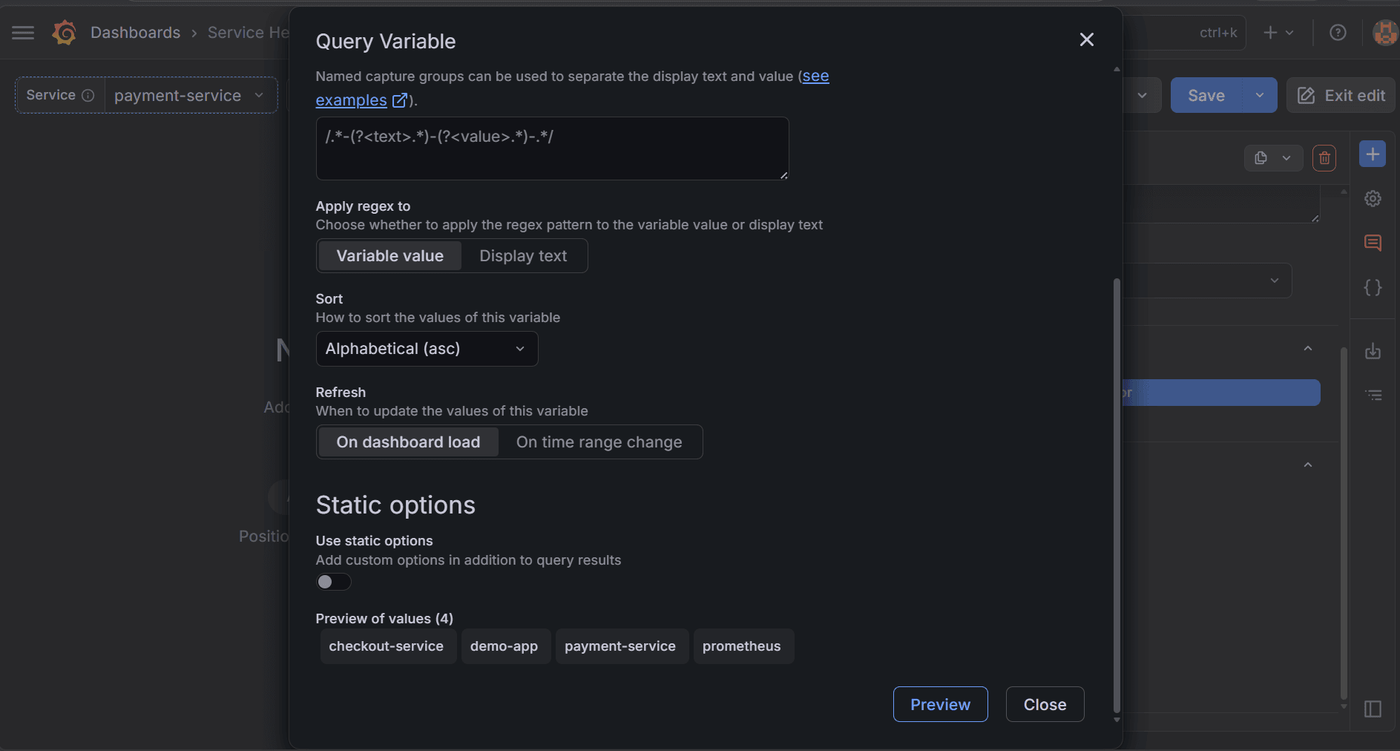
Then, click Preview and check the Preview of values section at the bottom of the window. If service names appear there, the query is working. Click Close to return to the variable settings panel and save the variable.
Step 6. Use the Variable in a Panel
While still in edit mode, click the + button in the dashboard header. Under Panel, click the panel tile to add a new visualization. In the panel editor, select Prometheus as the data source. Then enter this PromQL query in the query field:
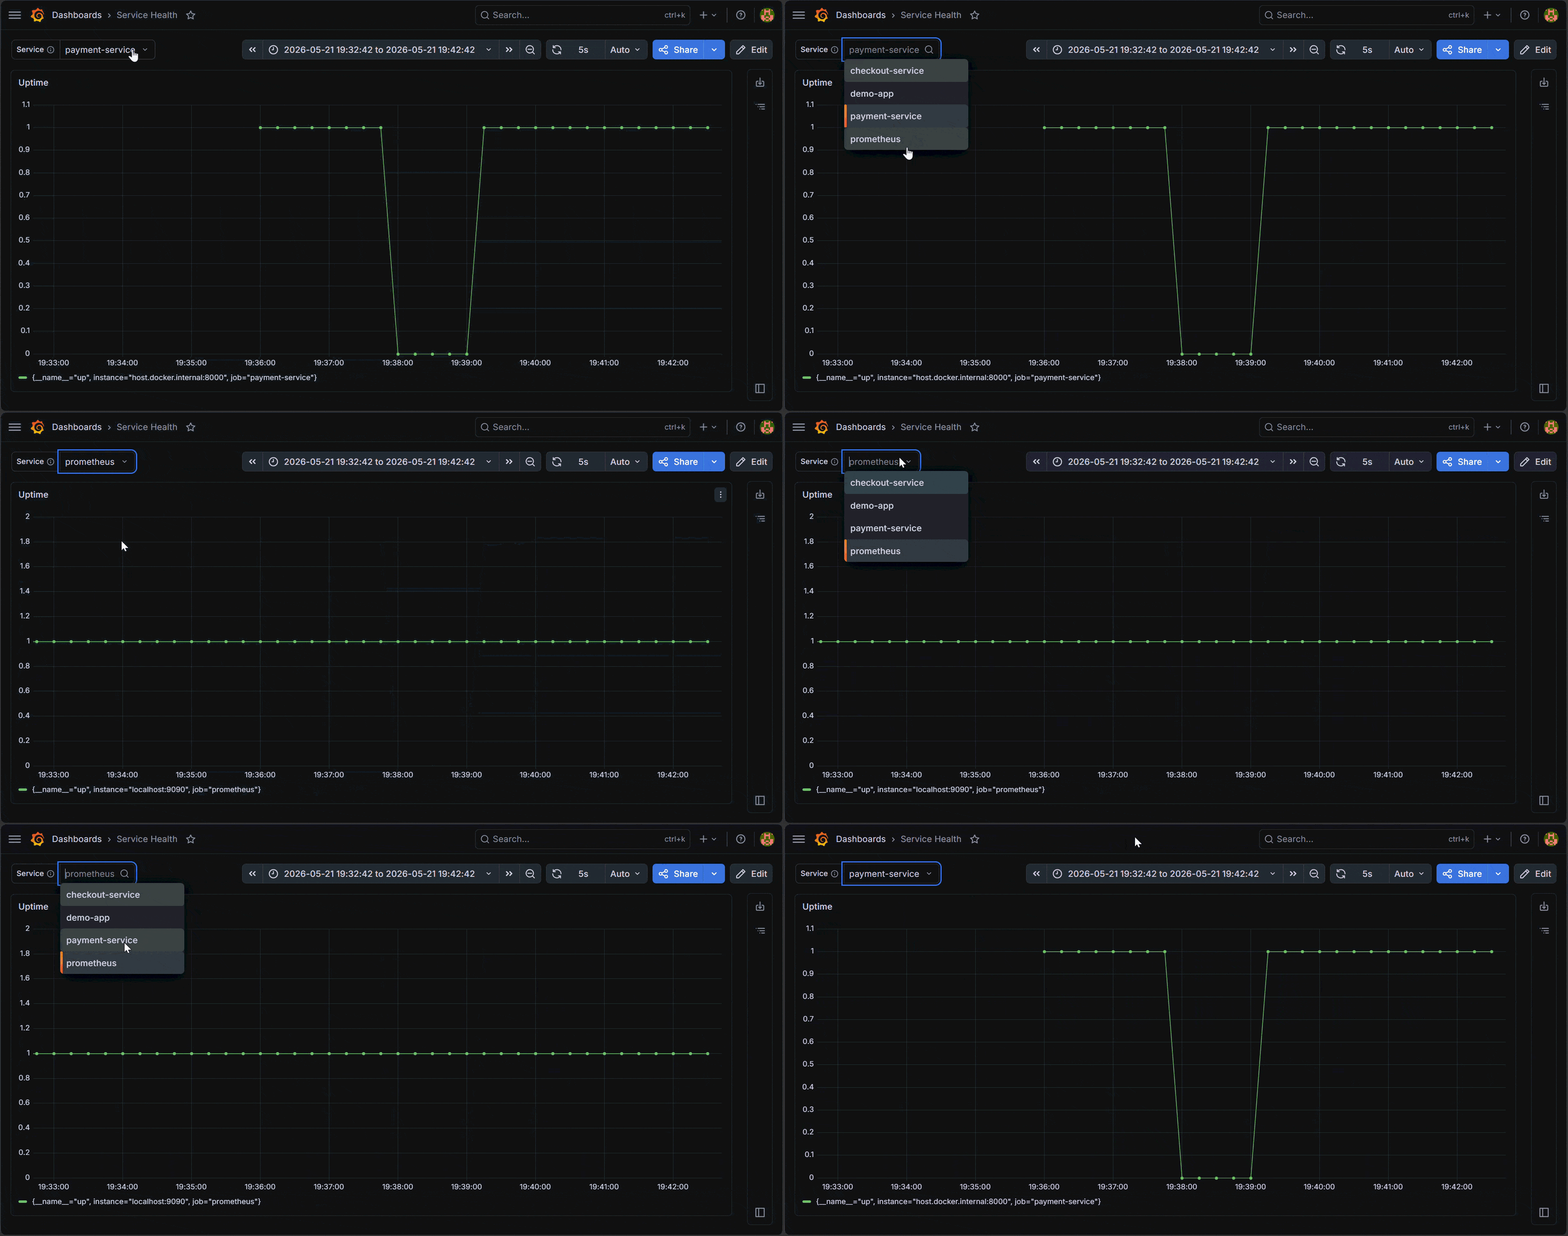
This query checks whether the selected scrape target is up. The up metric returns `1` when Prometheus is scraping the target successfully and `0` when it fails. The `job=~"$job"` part connects the panel to the variable you created, so changing the Service dropdown changes the target the panel checks.
Finally, set the panel title to Uptime, then click Apply to add the panel to the dashboard. You should see the Uptime panel update based on the selected Service.
How Grafana Variables Work Inside Dashboard Queries
When you change a variable selection, Grafana updates the variable’s value in the dashboard state and then rewrites each panel query before it runs.
Grafana Interpolates Variables Before Query Execution
Interpolation is the rewrite step. Grafana reads the current variable value, replaces `$var` or `${var}` in the query text, and escapes the result based on where the value appears. A value used in an exact label match is written as a single label value. A value used in a regex matcher is written so it matches one or more label values.
The first query matches one job value, such as `api`. The second query supports selections such as `api` and web, because Prometheus reads `=~` as a regex label matcher rather than an exact string.
Braces help when the variable appears inside a longer string. For example, in `apps.frontend.${server}.requests.count`, Grafana replaces only `${server}` with the selected server value. If the selected value is `api`, the final string becomes `apps.frontend.api.requests.count`.
Format Options Change the Interpolated Value
After Grafana finds the variable, it still has to write the selected value in the right form for the query or link. Format options change that final output without changing the variable itself.
That means the same `servers` variable can be written as a list, a regex string, or URL parameters, depending on where you use it. A panel query, regex matcher, and dashboard link do not need the same written value.
Built-In Time Variables Adjust Query Ranges
Some query values come from Grafana’s time picker instead of a variable you create. Built-in variables such as `$__range`, `$__interval` and `$__rate_interval` change when the dashboard time range changes. In Prometheus queries, `$__rate_interval` gives `rate()` and `increase()` a range based on the panel interval and scrape interval.
When you zoom from one hour to seven days, Grafana recalculates the built-in time values and rewrites the query again. The panel keeps the same query structure, but the range inside the query changes with the dashboard.
Using Grafana Variables for Dynamic and Multi-Environment Monitoring
In a multi-environment dashboard, the panels stay the same while the selected environment, service, or data source changes. Grafana variables make those selections part of the dashboard, rather than forcing a separate dashboard for each target.
Set the Starting View With Environment or Data Source Variables
Start with the value that separates one monitoring target from another. If production and staging use the same data source, an `$environment` variable filters the query by label. If each environment uses a different source, a data source variable switches the panel to the selected source instance. This works best when those sources expose compatible metric names and labels.
This query shows the request rate by service for the selected environment.
Narrow Large Environments With Chained Variables
Use chained variables when one selection should narrow the next one. A cluster variable narrows the namespace list, then the selected namespace narrows the pod list. Grafana updates the dependent variable when the parent value changes, so the dashboard shows fewer unrelated options.
This variable query returns only the namespaces that belong to the selected cluster.
Keep Panels Consistent Across Environments
Keep the same panel structure across environments when you need reliable comparisons. A request-rate panel should keep the same metric, aggregation, and visualization while `$environment`, `$service`, or `$namespace` changes the target. That makes production and staging easier to compare because only the selected values change.
This query shows the request rate by status code for the selected environment and service.
Preserve Selections Across Dashboard Links
Use dashboard links when a high-level view needs to open a more detailed dashboard. Grafana syncs variables to the URL with `var-<name>=value`, and data links pass selected values to another dashboard. Use the variable name in the link, not the display label, so the target dashboard receives the right selection.
This link opens the service detail dashboard with the same environment and service already selected. Enable the current time range in the link settings when the target dashboard should open with the same investigation window.
Common Use Cases for Grafana Variables in Observability
Grafana variables are most useful when the same dashboard needs to answer the same question for different services, namespaces, instances, or time ranges.
- Filter service health by the selected service: Service health dashboards usually track the same signals for every service. Request rate, latency, and errors stay the same, while the selected service changes. A `$service` or `$job` variable keeps those panels tied to the service you are inspecting instead of forcing separate panels for each service.
- Narrow Kubernetes views by cluster and namespace: Kubernetes dashboards need filters that match the way workloads are organized. A cluster variable narrows the dashboard to one cluster. A namespace variable narrows it again before pod or container panels load. This keeps the dashboard focused when the environment contains many namespaces and short-lived pods.
- Search logs with the same service filter: Variables help log panels follow the same service or namespace selected in metric panels. In Loki, log queries use labels such as `namespace`, `container`, or `job` to choose the log streams to search. A variable in the stream selector keeps logs aligned with the selected workload.
- Look up high-cardinality values with textbox variables: Some observability lookups are too specific for dropdowns. A trace ID, request ID, tenant ID, or exact host name may have too many possible values to load as options. A textbox variable lets you paste the value directly and use it in one or more panels.
- Repeat panels for per-target views: Repeating panels help when you need the same panel once per selected value. For example, a dashboard can repeat a latency panel for each selected service, namespace, or instance. This avoids maintaining separate panels for targets that use the same query pattern.
Advanced Techniques for Grafana Variables
A service dropdown works when the dashboard has one clear target. Larger dashboards need variables that handle multiple selections, hide irrelevant dropdown values, and carry selections into related views.
Multi-Value Variables
Multi-value variables allow a single dashboard to show multiple selected targets. You can compare two services, several namespaces, or a group of instances in the same panel. Grafana formats multi-value selections based on the data source, so the query syntax still needs to match the source you use. In Prometheus, a variable with multiple selected values belongs in a regex matcher such as ` =~`.
The panel returns the request rate for each selected `job`, making the comparison visible in a single chart.
Regex in Variable Queries
Regex in a variable query changes which values appear in the dropdown. It filters returned values or captures the part of a value you want to show. That is different from regex in a panel query. Here, regex shapes the variable options before the user selects anything.
A pattern like this keeps only values that start with checkout-, which is useful when a data source returns long lists that mix services, jobs, or generated names.
Templating Across Panels and Data Links
Variables also carry selected values into links. Grafana passes them via URLs with `var-<name>=value`, and multi-value variables become repeated parameters. Use the variable name in the URL, not the display label. If the target dashboard uses a different variable name, map the value directly in the link.
Opening that URL takes the reader to the detail dashboard with the selected service and namespace already applied, instead of forcing them to choose the same filters again.
Using Variables With Annotations and Labels
Annotations add event markers to panels, such as deploys, incidents, or outages. Variables keep those markers tied to the selected view. If a dashboard uses `$service`, the annotation query can use the same variable in its tag filter, so the panel shows events for that service instead of unrelated markers from other services.
With the tag filter tied to `$service`, the panel can show deploys or incidents that match the service currently selected in the dashboard.
Best Practices for Managing Grafana Variables at Scale
As dashboards cover more services, environments, data sources, and users, variable setup needs clear rules. Use these practices to manage variables across shared dashboards without making controls slow or confusing.
- Order variables by investigation path: Place variables in the order users inspect the system. Broad choices such as environment, data source, or cluster should come before narrower choices such as service, namespace, pod, or instance. Grafana displays variable controls in the order they appear in the dashboard settings, so that order becomes part of the dashboard workflow.
- Limit when query variables refresh: Query variables read their options from the data source. That slows dashboard loading because each variable query must complete before the dashboard initializes. Use dashboard-load refresh for values that need to stay current when the dashboard opens. When the variable values depend on the selected time window, switch to time-range refresh instead.
- Use static variables for stable values: Not every value needs a data source query. Custom variables work well for short lists that rarely change, such as environments or fixed regions. Constant variables are suitable for hidden values, such as metric prefixes or shared path segments. Using static variables for stable values reduces unnecessary queries and keeps the dashboard easier to load.
- Keep chained variables shallow: Chained variables help narrow large option lists, but each dependency adds more query work. A `cluster-to-namespace-to-pod` chain is useful because each selection reduces the size of the next list. Longer chains can slow updates and make the dashboard harder to reason about. Keep the chain short enough that users understand what each selection controls.
- Set defaults and All values intentionally: A variable’s starting value shapes what the user sees first. If Grafana selects the first value automatically, the dashboard may open with a narrow filter that the user did not choose. Use the All option when the dashboard needs a broad starting view, but avoid expanding it into a long list that makes queries heavier. A custom All value, such as a wildcard or regex pattern, is often easier for the data source to handle.
- Keep variable names consistent across dashboards: Variable names matter in queries, URLs, and data links. A dashboard link uses the variable name, not the visible label. If one dashboard uses a service and another uses an app, you have to map the value manually in the link. Consistent names such as environment, service, namespace, and cluster make dashboards easier to connect and maintain.
Troubleshooting Common Issues with Grafana Variables
Most Grafana variable issues show up as empty dropdowns, slow dashboards, or panels that ignore the selected value. Use the table below to troubleshoot the issue you’re seeing.
| Issue | What to Check | How to Fix It |
|---|---|---|
| Empty variable dropdown | Check the variable query, selected data source, parent variable selection, and regex filter. Query variables read their options from the data source, so an empty dropdown usually means Grafana received no matching values. | Use the Preview of values section in the variable editor to confirm what Grafana receives before the value reaches any panel. |
| Slow dashboard load | Check query variables set to refresh on dashboard load or on time range change. These queries run before the dashboard finishes loading. | Move stable values to custom variables, avoid unnecessary time-range refresh, and keep chained variables short. |
| A multi-value variable does not filter Prometheus correctly | Check whether the panel query uses an exact matcher such as \=\. Prometheus needs regex matching when a variable allows multiple values or uses the All option. | Use \=~\ instead of \=\ so Prometheus treats the selected values as a set of possible matches. |
| The All option makes queries too broad | Check how Grafana expands the All value. A variable with many values can produce a long expression, making queries heavier. | Use a custom All value that fits the data source syntax, such as a wildcard or regex pattern. |
| The data source variable breaks some panels | Check whether each selected data source exposes the same metric names, fields, and labels. A data source variable switches the source, but it does not rewrite query schemas. | Align metric and label names across sources, or update the query to work with each selected source. |
| Dashboard link does not preserve selected values | Check the URL parameters. Grafana passes variables as var-<variable-name>=value, and the target dashboard must use the same variable name. | Use the correct variable name in the link, map values manually when names differ, and include the current time range when needed. |
| Textbox variable returns empty panels | Check the typed value. Textbox variables accept free text, so Grafana does not validate the value against the data source. | Add a clear variable description and tell users the expected format, such as a request ID, trace ID, or tenant ID. |
| Issue | What to Check | How to Fix It |
|---|---|---|
| Empty variable dropdown | Check the variable query, selected data source, parent variable selection, and regex filter. Query variables read their options from the data source, so an empty dropdown usually means Grafana received no matching values. | Use the Preview of values section in the variable editor to confirm what Grafana receives before the value reaches any panel. |
| Slow dashboard load | Check query variables set to refresh on dashboard load or on time range change. These queries run before the dashboard finishes loading. | Move stable values to custom variables, avoid unnecessary time-range refresh, and keep chained variables short. |
| A multi-value variable does not filter Prometheus correctly | Check whether the panel query uses an exact matcher such as \=\. Prometheus needs regex matching when a variable allows multiple values or uses the All option. | Use \=~\ instead of \=\ so Prometheus treats the selected values as a set of possible matches. |
| The All option makes queries too broad | Check how Grafana expands the All value. A variable with many values can produce a long expression, making queries heavier. | Use a custom All value that fits the data source syntax, such as a wildcard or regex pattern. |
| The data source variable breaks some panels | Check whether each selected data source exposes the same metric names, fields, and labels. A data source variable switches the source, but it does not rewrite query schemas. | Align metric and label names across sources, or update the query to work with each selected source. |
| Dashboard link does not preserve selected values | Check the URL parameters. Grafana passes variables as var-=value, and the target dashboard must use the same variable name. | Use the correct variable name in the link, map values manually when names differ, and include the current time range when needed. |
| Textbox variable returns empty panels | Check the typed value. Textbox variables accept free text, so Grafana does not validate the value against the data source. | Add a clear variable description and tell users the expected format, such as a request ID, trace ID, or tenant ID. |
How groundcover Enhances Grafana Variables with Unified Telemetry
Grafana variables are only as useful as the data behind them. groundcover improves that data by collecting Kubernetes signals across metrics, logs, traces, and events, then organizing them around workload-level labels that Grafana dashboards can use consistently.
eBPF Captures Workload Signals Without Code Changes
groundcover uses eBPF sensors to capture signals on Kubernetes and Linux hosts without code changes. That gives dashboards runtime-level telemetry before each service adds custom instrumentation. For Grafana variables, this matters because filters such as service, namespace, workload, and pod depend on the labels available in the data source. groundcover’s BYOC architecture also provides a fully queryable, PromQL-compatible data plane with logs, metrics, traces, and events.
Kubernetes Labels Give Variables Consistent Targets
Kubernetes dashboards need stable filters for clusters, namespaces, workloads, pods, and containers. groundcover exposes labels such as `clusterId`, `namespace`, `workload_name`, `pod_name`, and `container_name` across Kubernetes and container metrics. Those labels give Grafana variables predictable targets for common Kubernetes views, rather than forcing each panel to rely on a different naming pattern.
Associated Values Keep Dropdowns Relevant
Large Kubernetes environments can produce long dropdown lists. groundcover uses associated values to keep related selections closer together. After you select a value in one variable, related variables show values associated with that selection first. For example, selecting a production cluster lets a workload variable show workloads from that cluster before unrelated workloads.
Embedded Grafana Keeps PromQL Workflows Available
groundcover keeps Grafana-based workflows available for teams that already use PromQL dashboards. Its querying options include Grafana-based log querying and PromQL in Grafana, so existing variable patterns can continue to work while groundcover provides the telemetry source behind the panels.
Agent Mode Turns Workload Questions Into Filtered Views
Agent Mode uses groundcover telemetry to investigate issues across logs, traces, metrics, Kubernetes events, and entities. You can ask about a service, namespace, or workload, and Agent Mode queries the relevant signals, reports findings, and opens the right groundcover page with filters already applied. That supports variable-driven investigation because the same service, namespace, and workload labels are available across the telemetry layer.
Conclusion
Grafana variables make dashboards easier to reuse, but their value depends on how well they are designed. A useful variable setup lets you switch services, namespaces, clusters, data sources, and time ranges without rewriting panel queries. It also keeps dropdowns readable, query load controlled, and linked dashboards aligned as your monitoring setup grows.
groundcover strengthens that workflow by giving Grafana dashboards consistent Kubernetes telemetry across metrics, logs, traces, and events. With eBPF-based collection, workload labels, embedded Grafana, and Agent Mode, groundcover helps variable-driven dashboards stay tied to the workloads, services, and environments you need to inspect.
FAQs
Grafana variables let one dashboard switch between clusters, environments, namespaces, services, or data sources without changing every panel query. Instead of copying the same dashboard for production, staging, and development, you can use variables such as `$environment`, `$cluster`, and `$namespace` to control what the panels show. This keeps the dashboard structure consistent while the selected target changes.
The most common causes are empty variable queries, wrong label names, regex filters that remove valid values, and incorrect matchers in panel queries. Prometheus dashboards also need `=~` when a variable supports multiple values or the All option. If a panel uses `=` with a multi-value variable, Prometheus treats the selection as one exact label value instead of a set of possible matches.
groundcover improves the data that the Grafana variables filter. It collects Kubernetes telemetry across metrics, logs, traces, and events, then organizes that data with consistent workload labels. That gives variables clearer targets for services, namespaces, workloads, pods, and related views. Associated values also help large dropdowns stay usable by showing values related to the current selection first, instead of forcing you to scan every value across the environment.