Weekly updates on new features, improvements, and fixes across groundcover.


Faster issue response, richer context: Slack, Linear, Monitor health, and dashboard upgrades
July 2, 2026
These past 2 weeks focused on helping teams surface issues, act faster, and keep context attached from alert to resolution. Slack Connector now routes monitor notifications to the right channels and lets the groundcover agent investigate with the full thread as context, while Linear Connector turns Monitor Issues into tickets and brings Linear knowledge back into root cause analysis. We also made monitors easier to trust, with monitor health in the drawer, No Data state-change reasons and routing, and modern Monitor/Issues views with filters, facets, tables, and saved team views. Plus, Storage Management adds retention control, Treemap brings a new visualization to Explore and Dashboards, and dashboard updates add thresholds, conditional colors, Y-axis labels, decimal controls, and clearer metric formatting.
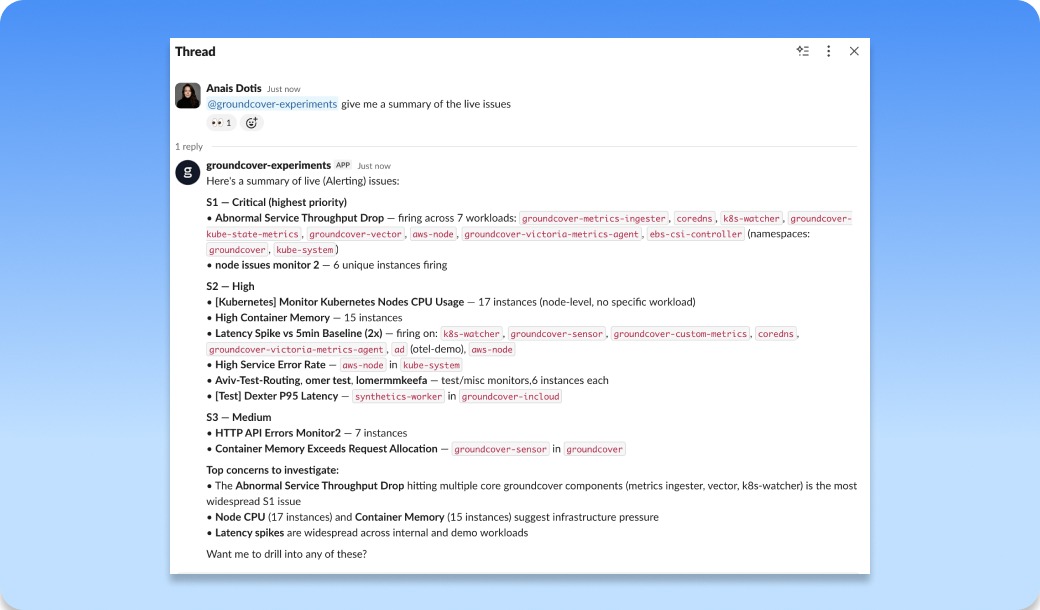
Slack Connector
You can now connect a groundcover Slack app, point your monitors at it, and have notifications land in the specific channels that should see them. Then @mention the groundcover agent in any thread and it answers with agent-mode investigation, using the whole thread as context. When an alert fires in your incident channel and three people have already pasted in what they're seeing, you can pull the agent in and it reads all of it before it starts digging. Same goes for a notification groundcover generated or a question someone asked higher up the thread. It picks up the context that's already there and keeps the investigation going where the conversation is happening.
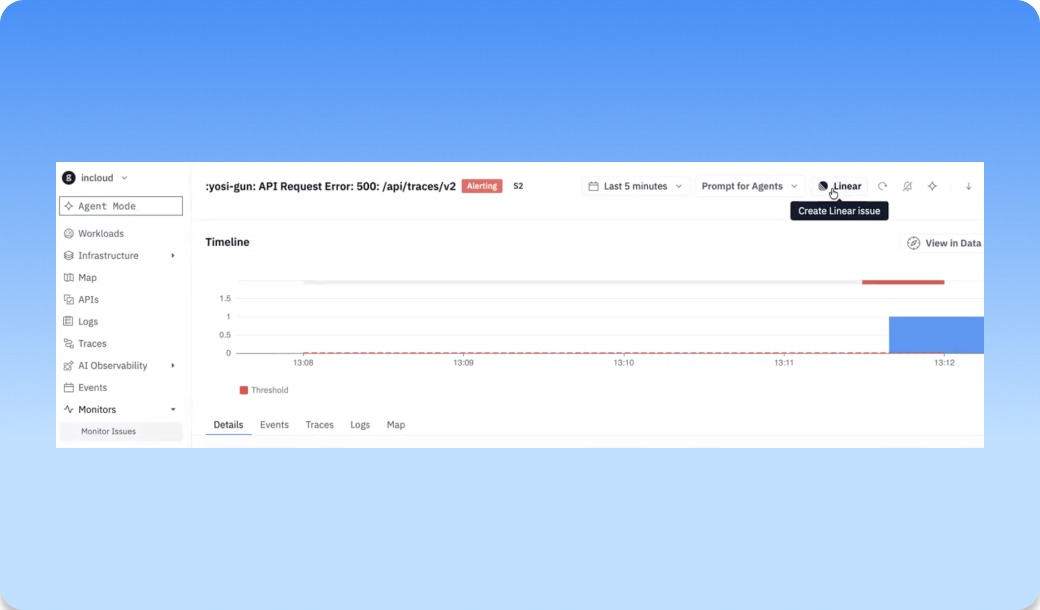
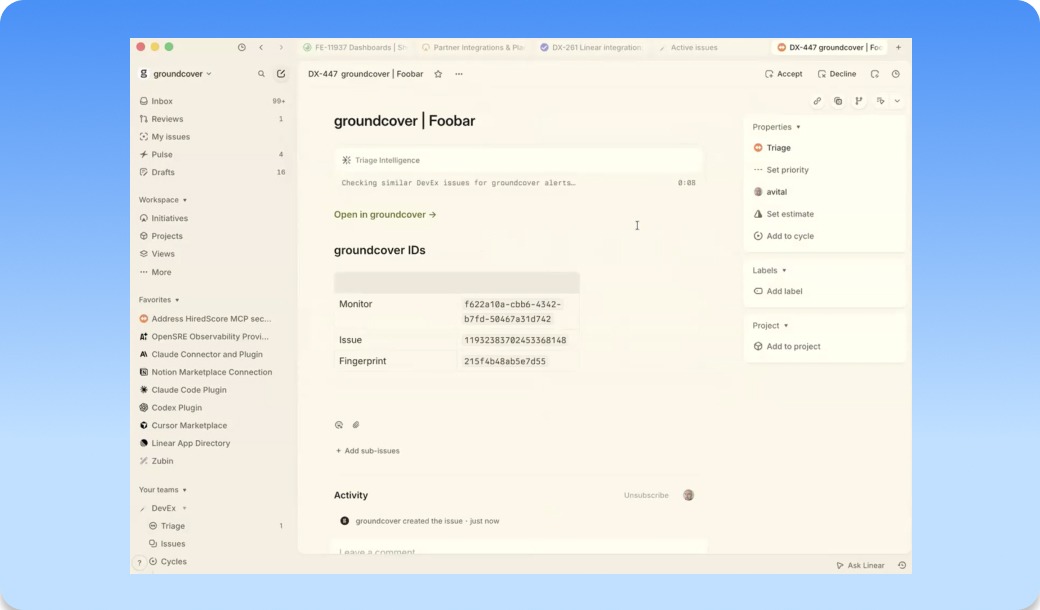
Linear connector setup is now available for creating Linear tickets from Monitor Issues
You can now connect Linear to groundcover and turn Monitor Issues into Linear tickets right from the place where the problem shows up. When a monitor surfaces an issue, your team doesn’t have to copy links, rewrite context, or jump between tools just to get the work tracked. Create the ticket from the Monitor Issue, send the right reliability problem into Linear, and keep the investigation tied to the original signal in groundcover. It also brings the knowledge that already lives in Linear back into
groundcover during root cause analysis, so past tickets, decisions, fixes, and team conversations can help explain what’s happening now. The result is a cleaner handoff from finding a problem to accountability without losing the context that explains what happened, where it happened, and why it matters.
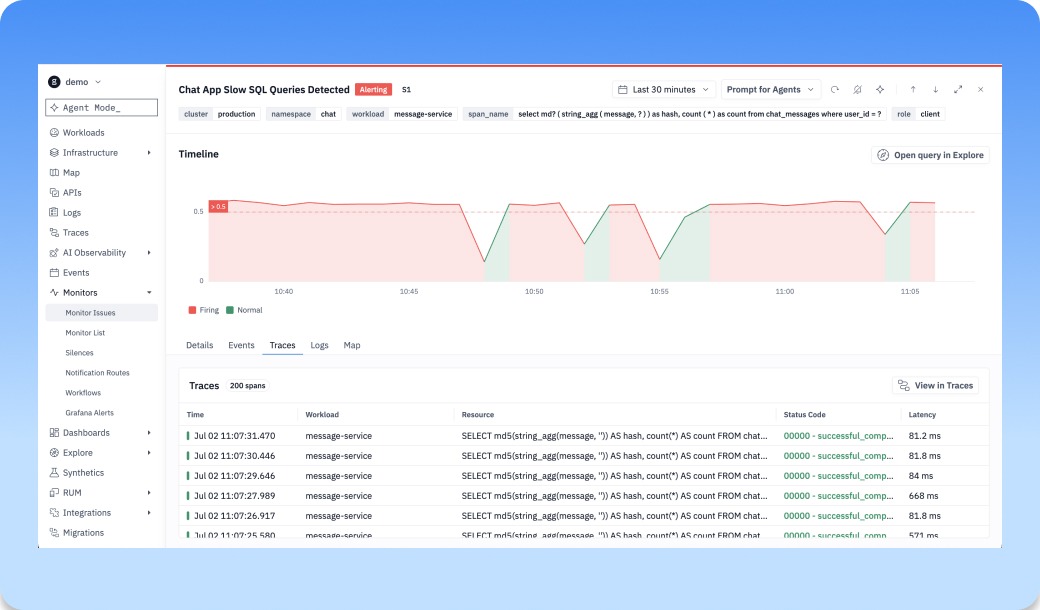
The monitor drawer now shows you when the monitor is the problem
A monitor that silently stops evaluating, or fires but never delivers, is worse than no monitor. Until now the drawer only showed you issues, not whether the monitor itself was healthy.
Now you can open a monitor and you'll see two new graphs under the timeline: notification delivery (green for sent, red for failed) and a row of dots marking evaluation errors. Click into either and you land on a matching tab with the full traces behind it: delivery status, connected app, route, and provider for notifications; error type, duration, and the actual error text for evaluation failures. When a monitor goes quiet, you can tell at a glance whether it's caught nothing or broken trying.
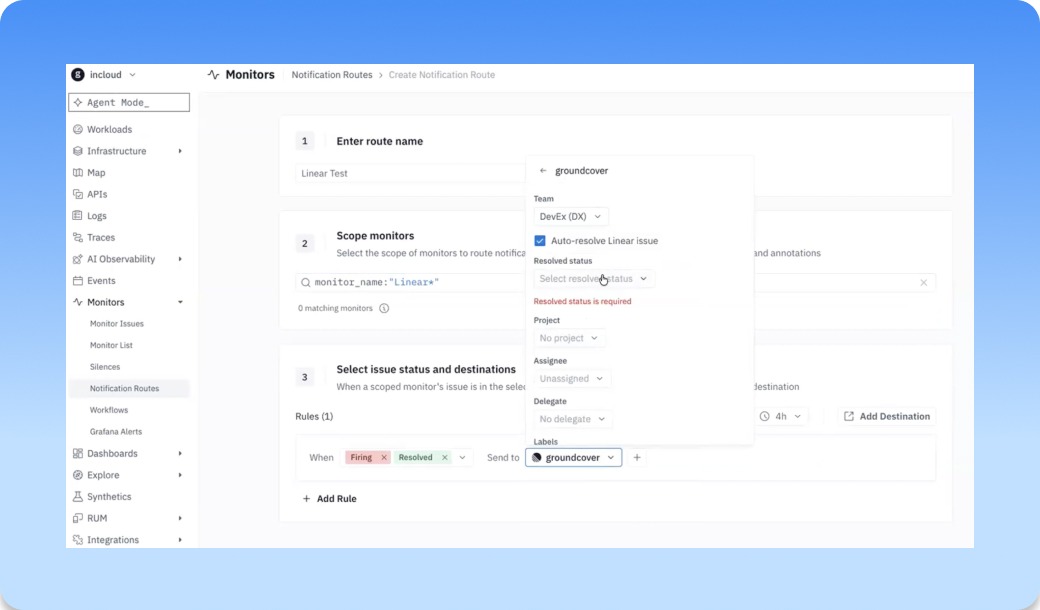
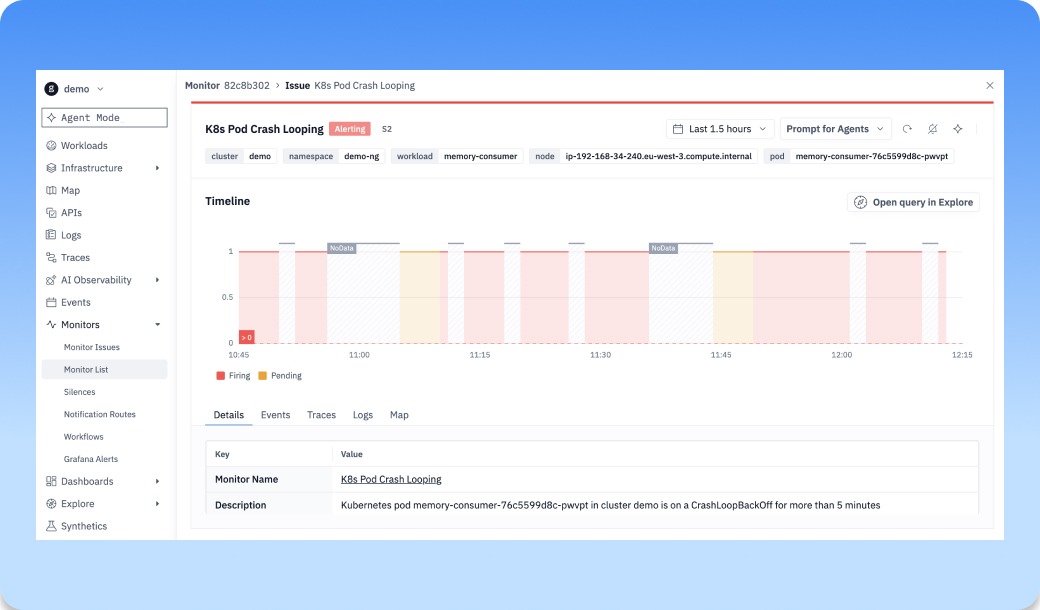
No Data issues now expose state-change reasons and support notification routing
No Data issues (aka deadman alerts) now show why a monitor stopped receiving the signal it expected, not just that something went quiet. Instead of treating missing data like a mystery, groundcover surfaces the state-change reason so teams can see whether the issue came from no data, a threshold breach, an error, or another monitor state transition. You can also route No Data issues into the right notification flow, so the people responsible for the service know when visibility disappears. When telemetry drops, a scrape breaks, or a workload stops reporting, teams can catch it as an actionable monitor issue instead of discovering later that they were flying blind.
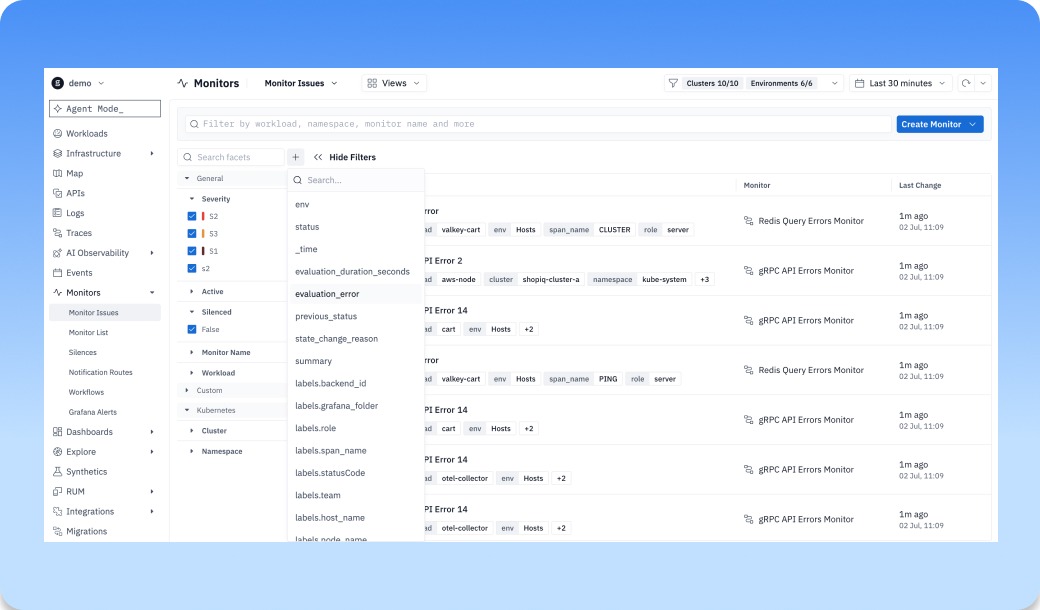
Monitor/Issues lists and now use a modern filter bar, facets, table layout, and saved-view. Use it to create your team’s view and more.
Monitor and Issues lists now give teams a faster way to find the signals that matter. With a modern filter bar, facets, cleaner table layout, and saved views, you can stop rebuilding the same search every time you open the page. Create a view for your team, your service, your environment, or the issues you own, then come back to it whenever something needs attention. Instead of scanning through every monitor or issue, each team can work from a focused view of what’s relevant to them, making it easier to prioritize, investigate, and stay on top of reliability work.
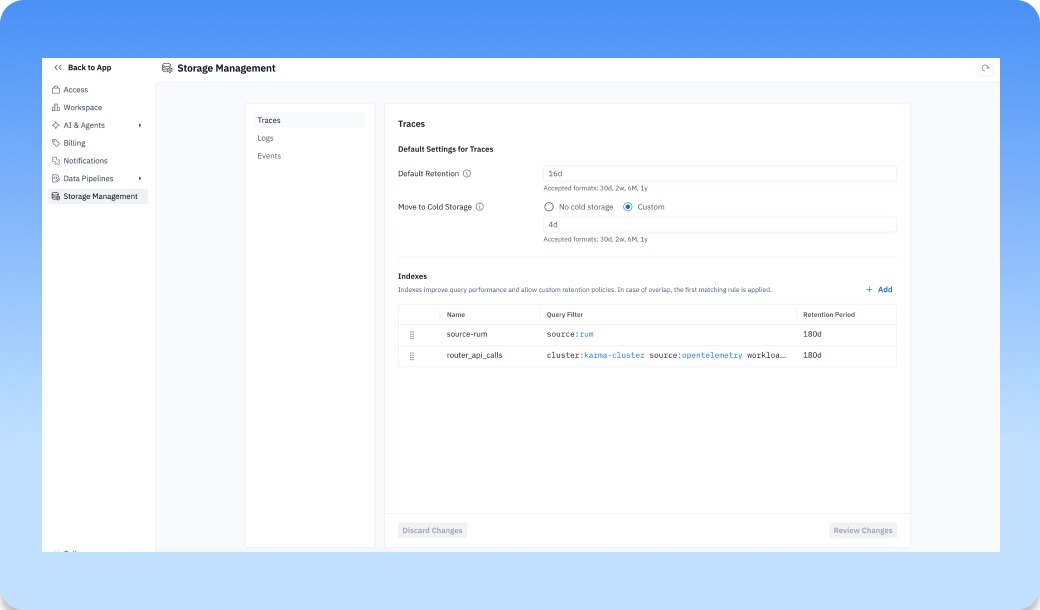
Users can now self-control the retention period for data (eta Monday, July 6, 2026)
Storage Management now gives users direct control over how long their data is retained in groundcover. Instead of going through support or waiting on a backend change, teams can adjust retention periods themselves based on what they need to investigate, store, or optimize. Keep high-value telemetry around longer when it matters, shorten retention when you want to reduce storage footprint, and manage those decisions from inside the product. It gives teams more ownership over their observability data, so retention can match the way they actually operate across environments, workloads, and compliance needs. This type of control is what we mean when we talk about how BYOC architecture and per-node pricing are designed to give you ownership over your data, rather than forcing you to keep and pay for what you don’t need.
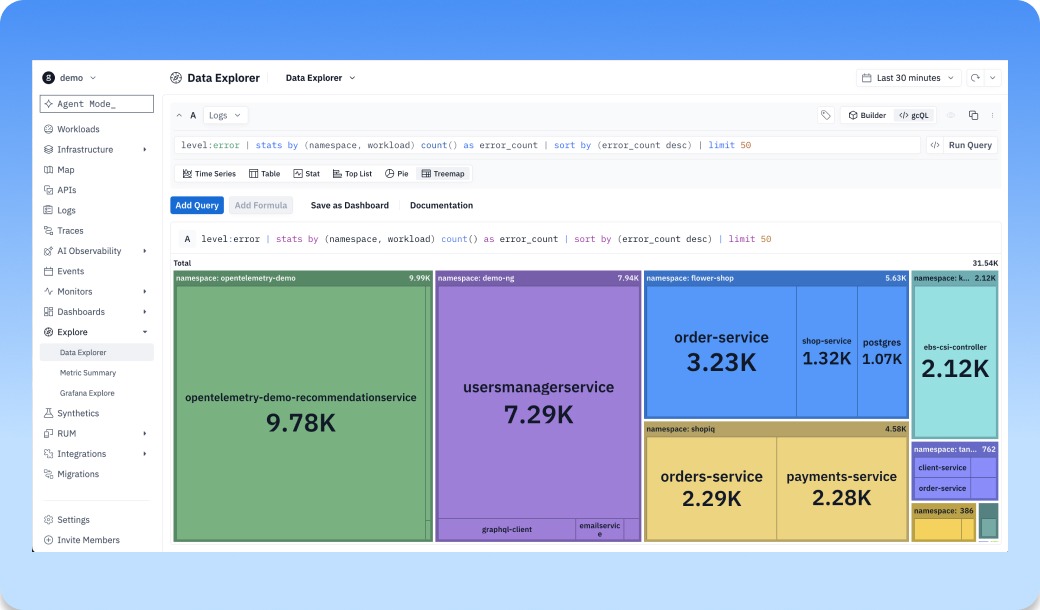
Treemap is now available as a new visualization in Explore and Dashboards
Treemap is now available as a new visualization in Explore and Dashboards, giving teams a faster way to understand how large, complex datasets break down at a glance. Instead of scanning long tables or comparing individual series one by one, you can see which services, workloads, attributes, or dimensions are taking up the most space in your data. Use it to spot the biggest contributors, compare proportions, and quickly understand where volume, cost, errors, latency, or any other metric is concentrated. It turns dense observability data into a visual map, so teams can find outliers and patterns faster and know where to dig next.
Dashboard Improvements
People say dashboarding is dead because of agents. They say that everything will move into chat and teams won’t need dashboards anymore, but the reality we see is different. Customers still rely on dashboards every day, and they keep making feature requests to make them more customizable. That’s why we’ve added more control and polish across dashboarding and monitor views. Stats widgets now support conditional color formatting, so important values stand out the moment they cross a threshold. Time series can now show configurable thresholds and custom Y-axis labels, making charts easier to read and easier to explain. You can also control decimal precision in stats widgets, read time values and small negative numbers more clearly, and see long metric names without losing the context behind each series. We also fixed timezone selection in the monitor drawer time picker, so teams can investigate monitor behavior in the time context that actually matters. Agents make investigation faster, but dashboards still give teams the shared, always-on view they need to understand what’s happening.
.jpg)
General Improvements
- Monitors | Timezone selection now works correctly in the monitor drawer time picker
- Logs | Empty states now provide clearer guidance when log data is unavailable
- Platform | Single-shard EKS customer clusters were upgraded to Kubernetes 1.34
- Workloads | Old APM metrics generation can now be disabled through configuration, reducing resource footprint
- Agent | Slack-originated agent interactions now include richer user and tenant metadata for filtering and investigation
Bug Fixes
- Permissions | First login is faster for users with many policies
- Monitors | Timezone selection now works correctly in the monitor drawer time picker
- Monitors | Notification route links now open the correct monitor
- Slack Connector | Slack OAuth now keeps users in the correct workspace
- Logs | Filtering by log message now uses the correct content search behavior
- Dashboards | Chart series selector labels no longer truncate important metric names
Other recent updates
Make observability yours
Stop renting visibility. With groundcover, you get full fidelity, flat cost, and total control — all inside your cloud.


.svg)