


Weekly updates on new features, improvements, and fixes across groundcover.

Catalogs, Cost, and a More Capable Agent
July 16, 2026
This release is about self-serve retention, cost management, new agent skills, and easier dashboarding. Customers get a smarter way to build dashboards with a catalog of pre-built dashboards you can preview on your own data. Agent Mode now builds dashboard widgets for you. Plus the Slack app enables you to do more with the groundcover Agent without leaving the channel while sharing more of it’s processing. AWS Cost lands as a first-class data source, which opens up a whole new track for groundcover around cloud cost management. Finally, users have a smarter way to manage data retention–a natural byproduct of groundcover’s BYOC and per-node pricing model. There's also a long list of improvements and fixes underneath.
Meet @groundcover: put the agent to work in Slack
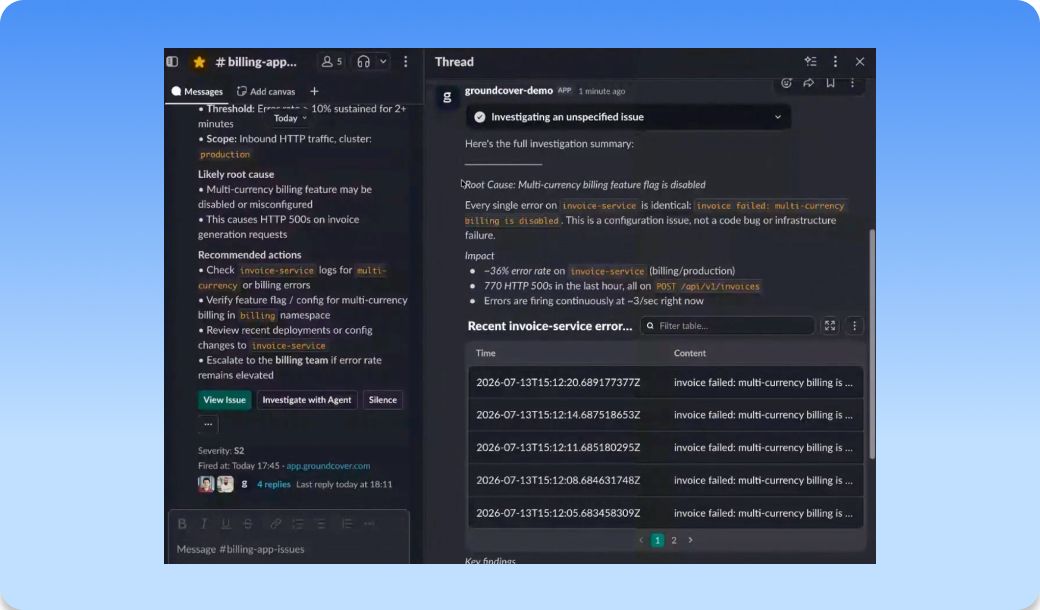
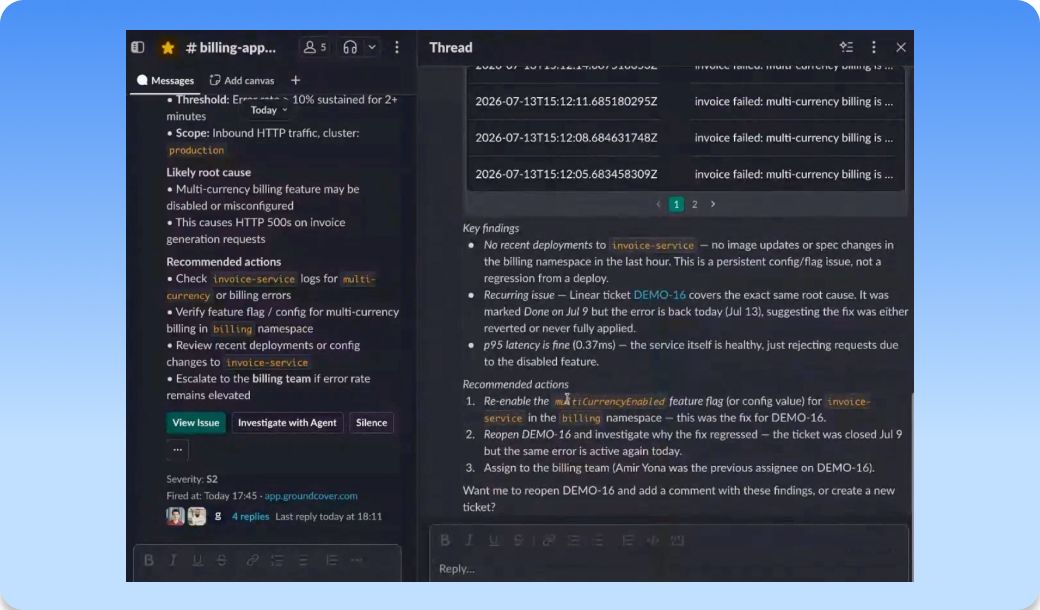
Picture the on-call moment. A monitor you set on your invoice service fires. The error rate is spiking and the alert lands in Slack. Normally this is where the tab-juggling starts: ask the channel whether anyone’s seen it, hunt for the Linear ticket someone half-remembers, jump into groundcover to pull the telemetry, then try to line all three up yourself.Now you tag @groundcover in that same thread and say “investigate this issue.” It reads the whole thread as context including the Linear ticket mentioned a few replies up. The agent gets all of the organization knowledge it needs. Then loads your errors and logs from the platform, and streams its to-do as it works so you can watch the investigation unfold. What comes back is a root-cause analysis with the actual logs it reasoned from: the errors trace to a feature flag, here’s the Linear ticket, here’s who it’s assigned to. Then you keep going from the same thread with “reopen the Linear ticket” and “have Cursor open a PR to flip that flag”. The same connectors reach the tools your team already lives in and carry out your tasks: Cursor, Claude Code, Codex, Slack, Linear, Jira, PagerDuty, Incident.io.
The groundcover agent in slack runs as you, and only you. Every mention impersonates the person who sent it. If your RBAC only lets you see certain namespaces or clusters, or you’re read-only, that’s exactly what the agent sees — there’s no querying around your own permissions. It spends against your Agent Mode budget on every run, whether you called it from Slack or from the product. The answer gets posted to the channel for everyone; the access and the cost stay yours.
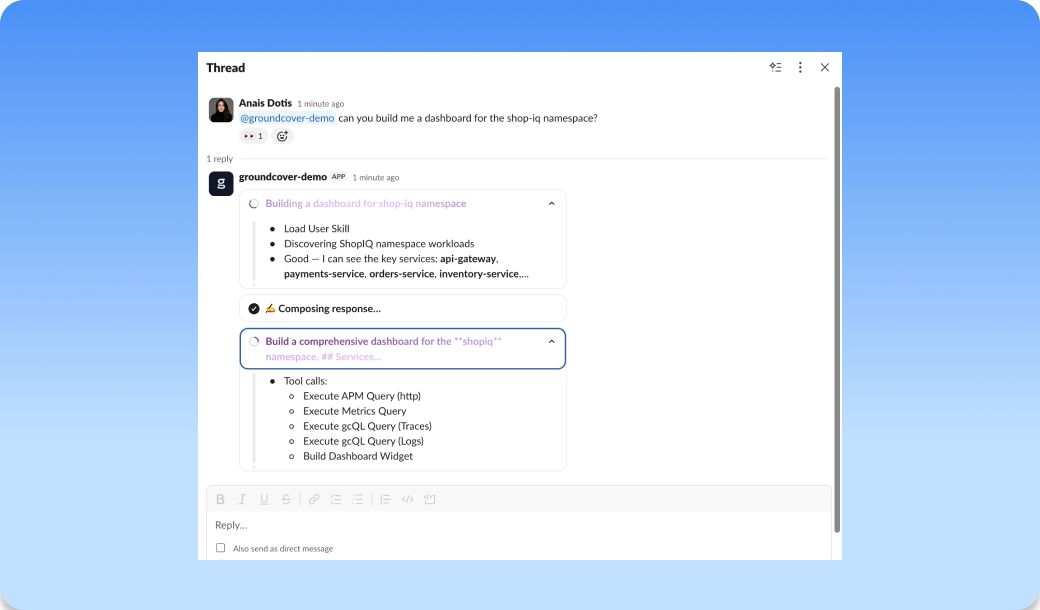
Admins hold the guardrails. You decide, per tool, what the agent may do on its own. A risky action like “delete customer” you can block from AI entirely; something like “delete a comment” you can force it to ask before doing, so a human stays in the loop. Users can only tighten those settings for themselves — never loosen them past what the admin set.And because it’s groundcover underneath, the agent reasons over full BYOC + eBPF full fidelity telemetry, not a sampled slice. An agent is only as good as the context it can see, and this one sees everything you collect plus all of the organizational context it needs.The same agent can then builds dashboards in slack. Add an issue as context, say “create a dashboard for this,” see the agent’s reasoning and to-do lists, approve the step when it asks, and it assembles one. It might show top errors for the endpoint, status-code distribution, the relevant logs.We ran the whole thing end to end in our webinar, Connectors with Context — worth watching to see one alert go from Slack to root cause to an open PR without leaving the thread.
Manage your own data retention
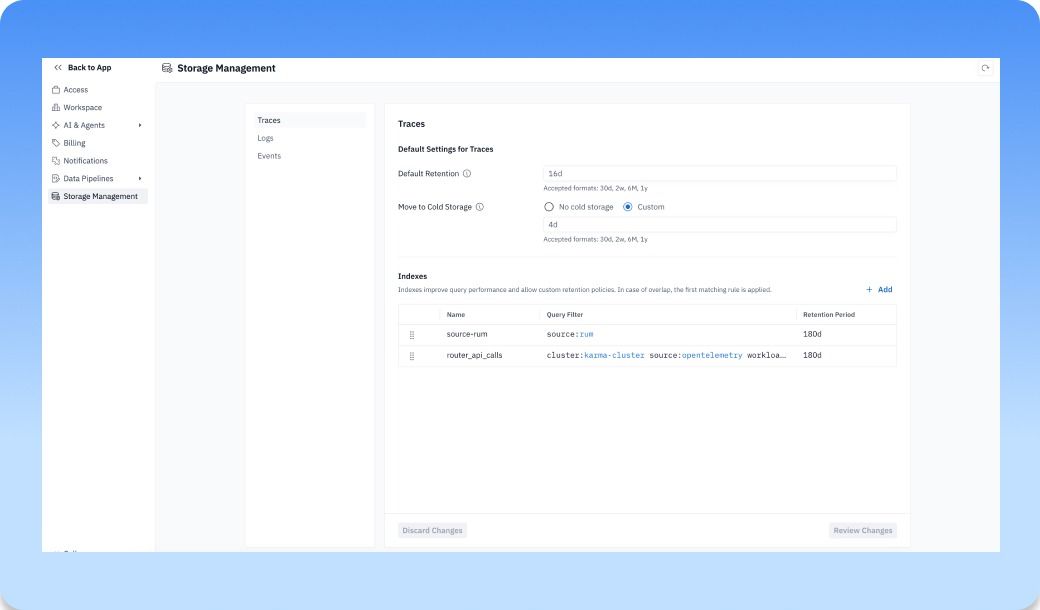
Storage Management gives you direct control over how long your data stays in groundcover. Instead of going through support or waiting on a backend change, you adjust retention periods yourself based on what you need to investigate, store, or optimize. Keep high-value telemetry around longer when it matters, shorten retention when you want to trim your storage footprint, and make those calls from inside the product.
This week retention and index policies expanded to cover more data types, including Monitor Issues and APM. It's more ownership over your observability data, so retention can match how you actually operate across environments, workloads, and compliance needs. This is what BYOC architecture and per-node pricing are for: you own your data, instead of keeping and paying for what you don't need.
Dashboards that ramp you up faster
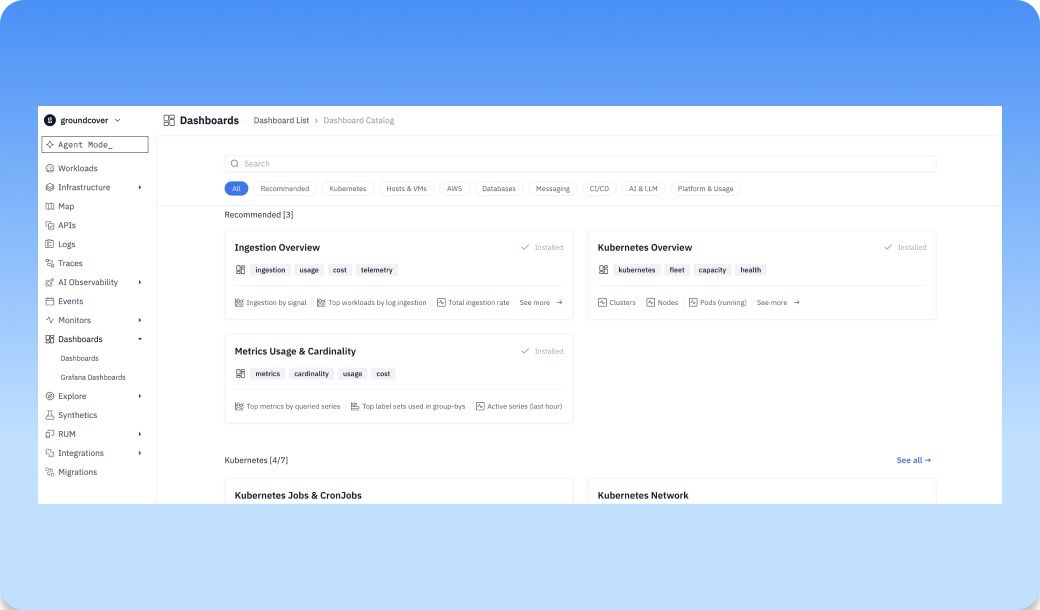
If you already live in groundcover, dashboards are where a lot of the day goes, and building good ones from scratch is slow. The Dashboard Catalog gives you a set of curated, ready-made dashboards that you can browse, search, and preview against your own live data before you add anything. You see real numbers in the preview, not a screenshot, so a new team member can go from nothing to a populated dashboard in about a minute instead of building it panel by panel.
Catalog dashboards are managed by groundcover and kept current as we improve them, so they don't go stale after you add them. When you want to make one your own, Create Editable Copy gives you a version to change freely.
Dashboards keep improving with redesigned variables
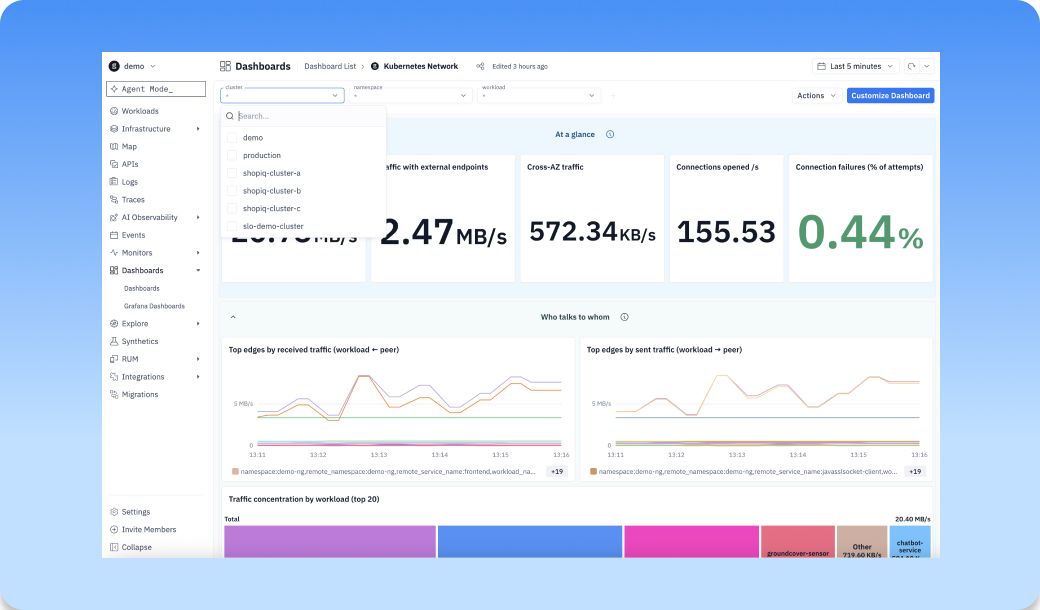
Dashboard features continue to be requested, and groundcover continues to deliver. Dashboard variables also got a redesigned setup flow that suggests variables and supports custom mappings, so wiring up a templated dashboard is far less fiddly. Now, for example, a single $cluster variable maps to whatever each source calls it, so one templated dashboard works across all of them instead of forcing you to duplicate panels per source. This custom mapping is especially useful after a Datadog migration when you need to accommodate a mix of data sources and conventions.
Guardrails on agent queries, and Skills as code
When the agent queries your signals over MCP (metrics, logs, traces, etc) it used to pass raw results straight through, which could mean dumping enormous payloads into the conversation. Those signal-query tools now apply size guardrails and truncate responses, so the agent stays fast and focused instead of drowning in its own output.
Skills are now exposed through the SDK and Terraform too, including a new groundcover_skill resource, so you can define and version the agent's skills as code alongside the rest of your groundcover setup.
Build dashboards with Agent Mode, without leaving the dashboard
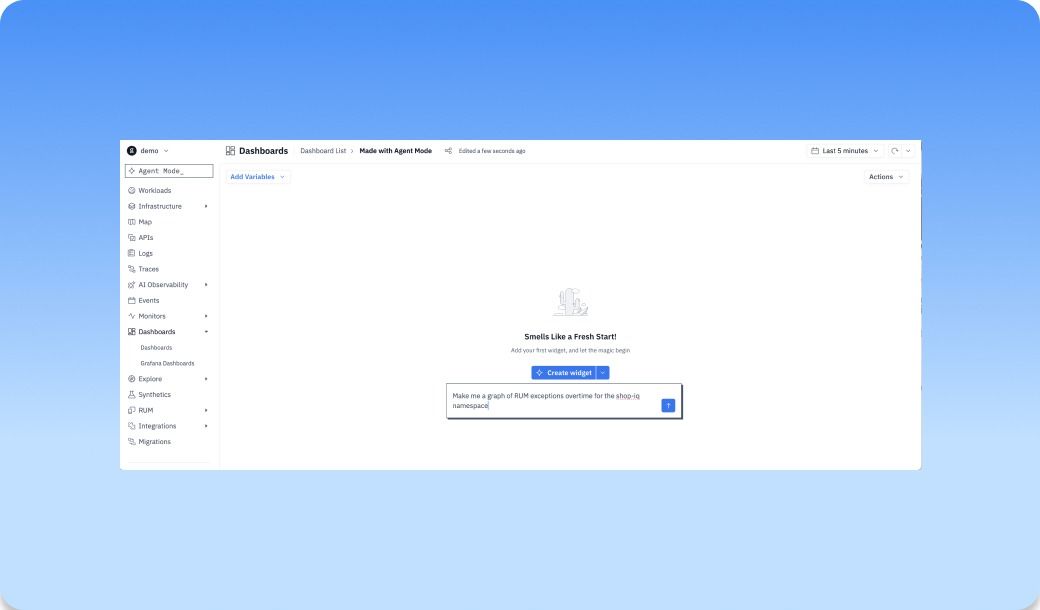
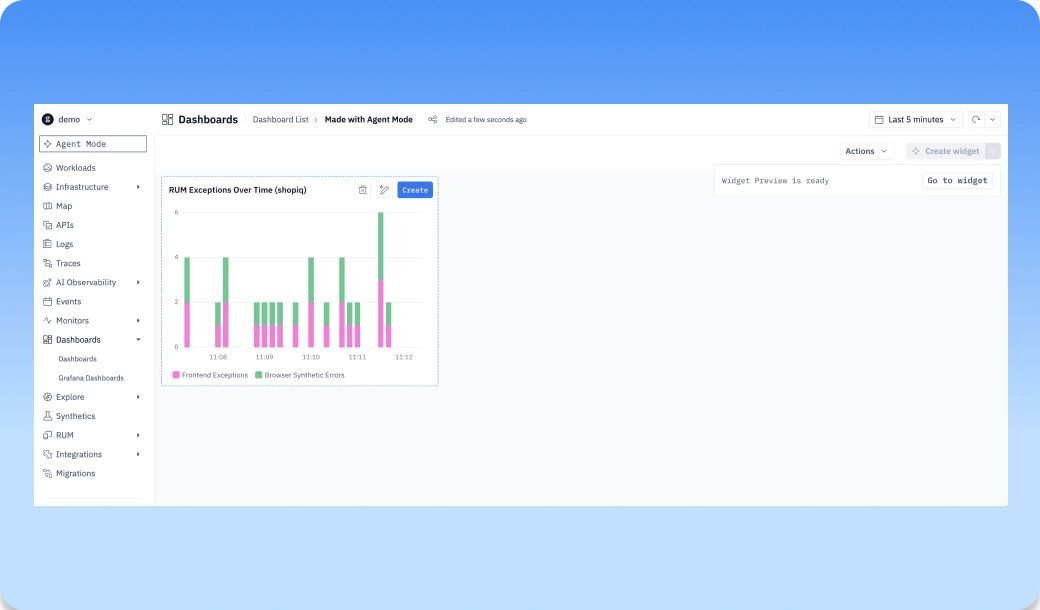
You no longer have to drop into a separate flow to add a chart. From a dashboard header or an empty dashboard, describe the widget you want and Agent Mode builds it, rendering a live preview you can create, refine with a follow-up, or cancel. Want to change a widget that's already there? Edit it with Agent straight from the widget's actions menu. The classic create-widget experience stays exactly as it was for backends that don't have AI enabled.
See what your cloud actually costs, and query it like everything else
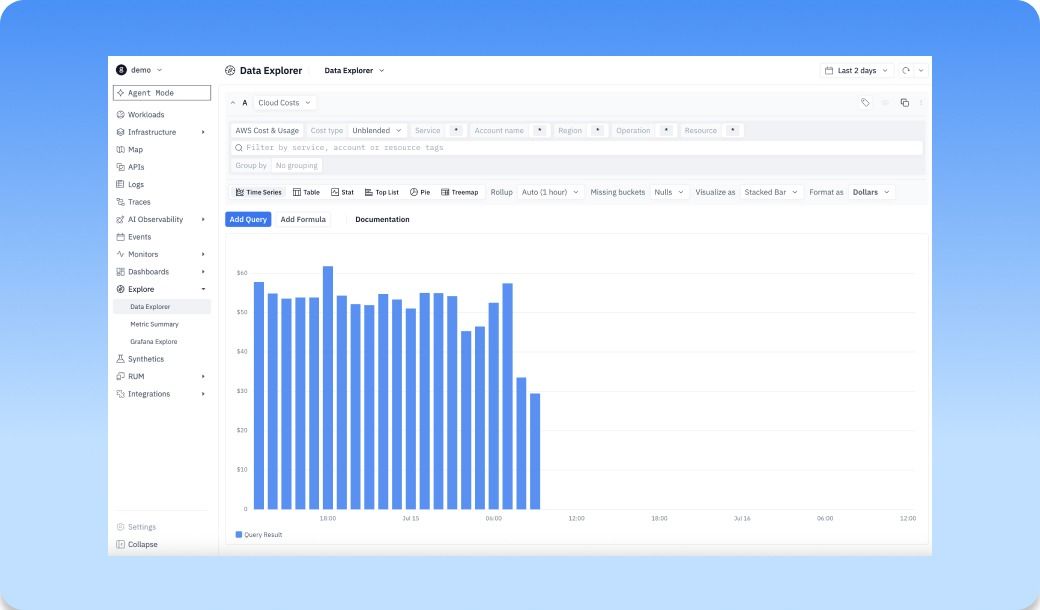
AWS Cost comes in as a data source in Data Explorer, and that's the important part. Once your AWS Cost & Usage Report is connected, cloud spend becomes something you can visualize and query the same way you query metrics, logs, and traces. So now you can see what your Kubernetes footprint costs, what your subscriptions cost, groundcover's own footprint, all in the place you already investigate. You can point the agent at it to answer questions like "am I about to breach a limit," and you can build monitors on top of cost so it alerts you before the bill does.
This is the beginning of groundcover adopting a much wider track in cost management and putting cost next to your observability data. It’s just the start but we’re excited to expand into this space.
Improvements
- Traces | Trace views now include a service map generated from the waterfall data
- Monitors | Evaluation delay can now be configured per monitor to cut false alerts from late-arriving data sources
- Logs | Container environment variables can now be obfuscated to protect sensitive metadata
- Metrics | StatsD metric ingestion is now enabled by default
- Integrations | Confluent Cloud can now be connected as a data source to pull its metrics into groundcover
- Integrations | AWS CloudWatch coverage added more metric presets for existing namespaces
- Agent Mode | Agent Mode can now run directly against Anthropic using your own Anthropic API key
- Agent Mode | New Tabs give you a Cmd-K-style way to jump to the page you want
- Agent Mode | The connectors dropdown now enables new connectors by default and tells you when none are enabled
- Agent Mode | You can now mention @metrics
- Dashboards | Chart widgets and section widgets can now have a description, so you can explain what a panel is showing
- Empty States | Unified, clearer empty states across the app — "No results in this range" when you've over-filtered, and a real setup prompt only when the data source isn't connected
- RUM | Click and type events are easier to follow in session replay
- RUM | Larger sourcemap uploads are better supported
- Infrastructure | Node CPU labels now make clear the values are node system CPU usage
- APIs & SDKs | Terraform now supports richer policy configuration and notification silence controls
Bug Fixes
- Monitor Issues | Free-text negation now works correctly when filtering issues
- Notification Routes | Invalid connected app types are now rejected before a route can silently fail
- Data Pipeline | Logs without explicit cluster metadata are no longer mislabeled with the backend cluster
- Workloads | Infinite scrolling now works correctly on the workloads page
- Agent Mode | Dashboards created with the agent can now be updated
Other recent updates

Observability
for what comes next.
Start in minutes. No migrations. No data leaving your infrastructure. No surprises on the bill.


