Introducing Claude Platform Tracing in groundcover AI Observability
Send Claude Platform OpenTelemetry traces to groundcover and see every agent turn, model request and tool use next to the services and pods your agents depend on, inside your own cloud.


See every agent turn, model request and tool use from Claude, on the same timeline as the services, pods and databases your agents depend on.
Starting today, the Claude Platform exports OpenTelemetry (OTel) traces natively from Claude Managed Agents, the Messages API and the Claude SDKs, in public beta. groundcover AI Observability picks up those spans as they land. Our GenAI normalizer maps them into the same model we use for every other AI call in your environment, and when your application passes its trace context (the Claude SDK does this for you), each Claude span sits in the same trace as your APM and infrastructure data.
The data stays in your cloud. With groundcover's BYOC deployment, Claude sends spans straight to an endpoint in your own account, so prompts, completions and tool arguments are stored in your infrastructure under your retention and access rules.
Turn on Full content and the same spans carry every prompt and response. Before anything reaches storage, groundcover's traces pipeline can mask emails, card numbers, JWTs, bearer tokens and cloud credentials in place with obfuscate_pii.
Until now, an agent run lived in two places. Your services ran the custom tools and the infrastructure under them. The Claude Platform ran the model and, with Claude Managed Agents, the agent loop itself.
One Trace From Your Service to the Model
Add groundcover as a destination in the Claude Console. Then set up tracing in the Claude SDK, as Anthropic's OpenTelemetry guide shows, and point your application's OTel exporter at the same groundcover endpoint. When your code calls the SDK inside one of its own spans, the SDK passes your trace context to the Claude Platform in a W3C traceparent header, so the platform's spans nest under yours.
- Claude Managed Agents: Every session request, agent turn, model request, tool use and outcome evaluation, grouped by session and thread.
- Messages API: Each message request with its model requests and compactions, plus any server tool or MCP connector tool use. Your MCP server gets the trace context too, so its own spans nest underneath.
- Claude SDKs: Your application's requests and the custom tools your tool runner executes, in Python, TypeScript, Go, Java, C#, PHP and Ruby.
Spans follow the OTel GenAI semantic conventions. groundcover reads the current conventions and the two older eras of the spec, so there's no attribute mapping to maintain.
Debug Agents in the Context of Your Whole Stack
Say a support agent built on Claude Managed Agents takes 40 seconds to issue a refund. The model is rarely the whole story. In groundcover, the trace shows two quick model requests, then 35 seconds inside your check_order_status tool. That tool called your orders API, which was waiting on Postgres. And the Postgres pod has been CPU-throttled since last night's deploy lowered its limits.
You didn't instrument any of that last part. groundcover's eBPF sensor already captured the slow query, the throttling and the Kubernetes events, so the whole path sits on one timeline. LLM-only tools stop at the edge of the agent. This keeps going down to the node.
From Symptom to Root Cause in One View
- Trace Tree: Model requests, turns and tool uses on one timeline, nested inside your own service spans.
- Per-Agent Analytics: Filter and group by agent to watch latency, errors, tokens and cost for each one, the same way you watch any workload.
- Conversation View: With Full content on, read a session message by message in the trace drawer. Spans group by gen_ai.conversation.id, so a multi-turn thread stays together.
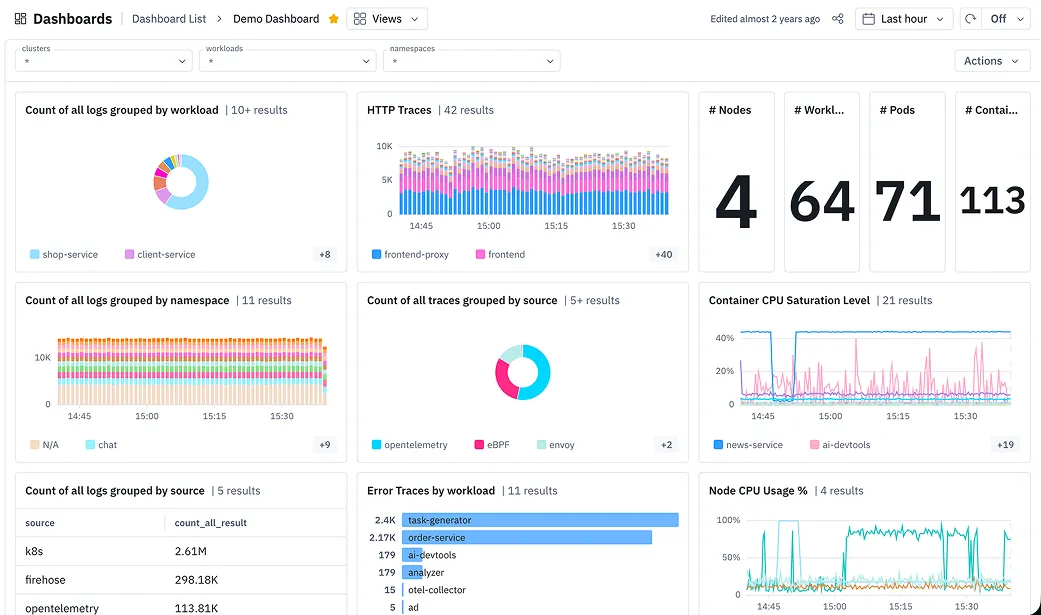
- Monitors and Dashboards: It's groundcover data, so gcQL queries, monitors and the dashboards you already have work on it.
Govern Tool Use
With Full content, each tool span carries the arguments the agent sent and the result it got back, which gives teams a record of what every agent touched. Choose Full content to capture prompts and responses, or Metadata only to keep timing, token counts, identifiers and names. Either way, groundcover's traces pipeline can drop, mask or strip fields before they're written.
Start Observing Your Claude Agents Today
An organization admin opens the OpenTelemetry settings page in the Claude Console, clicks Add destination and chooses Custom. Paste the OTLP endpoint from groundcover's Data Sources page, add your ingestion key as a request header, choose a content mode and pick which workspaces send traces. Click Test, and an anthropic.test span shows up in groundcover. Real traffic follows within about a minute, with no code changes on the API side. Filter on service.name = claude-platform to find it.
Claude Platform tracing is in public beta for the first-party Claude Platform and Claude Platform on AWS. Claude requests that go through Amazon Bedrock don't export Platform spans yet, but groundcover's eBPF sensor already captures Bedrock calls from your workloads.
What You Get With groundcover
Everything above is what Claude Platform tracing looks like in groundcover on day one. Here's what's underneath it.
Your Prompts Stay in Your Cloud
Agent traces are some of the most sensitive telemetry you'll ever produce. Full content means customer messages, internal documents and whatever the agent pulled out of your systems. With most backends, turning it on means a second copy of all of that in a vendor's SaaS.
With groundcover BYOC, the Claude Platform delivers spans directly to an endpoint in your own account. There's no vendor in the middle. Storage, retention and access controls are yours, and when Agent Mode reads those traces, it does it with a model running in your cloud, too.
One Normalizer for Every Agent You Run
Claude Managed Agents is probably not the only AI in your stack. A LangGraph service emits Traceloop attributes. Another team uses LangSmith. Someone is calling OpenAI with no SDK at all.
We spent weeks building a normalizer that turns all of it into one canonical model: four wire formats, three eras of the GenAI conventions, 26 spellings of 15 provider names, and provider-specific token math so cached tokens don't quietly throw off cost. (We wrote up what we learned in Part 1 and Part 2.) Claude's native spans land in the same views, so a Managed Agents workflow and a hand-rolled LangGraph agent can sit side by side in one cost breakdown.
groundcover also prices every AI span at ingest from a maintained model pricing table, and stores every span. No sampling. AI calls are low-volume and high-value, and the one you dropped is always the one you needed.
eBPF Covers What Nobody Instrumented
Not every service will be instrumented, and not every team will remember to wrap SDK calls in a span. groundcover's eBPF sensor captures Anthropic, OpenAI and Bedrock calls from anything running on a monitored node, with model, tokens, cost, latency and payloads, and no code changes. That includes the staging pod and the CI job nobody told you about.
When an SDK span exists for the same call, groundcover keeps both and leaves the eBPF tokens out of cost aggregations, so nothing gets counted twice. Claude Platform traces show what happened on Anthropic's side. eBPF shows every service that's calling it.
PII Controls That Run Before Storage
Masking after the fact still means the raw value was stored somewhere. groundcover's controls run as traces pipeline rules, in YAML, before a span is written:
- obfuscate_pii: 17 built-in patterns, including emails, credit cards, IP addresses, JWTs, bearer tokens, AWS and Azure credentials, GitHub, Slack and Stripe keys, and private keys. No regex required. Mask mode keeps JSON byte-aligned, and every span with a match gets is_pii = true so you can find them later.
- obfuscate_matching_keys: Mask the value of any attribute or header whose key matches a regex, so api_key, X-Api-Key and client-secret are all caught by one rule.
- replace_pattern and delete_key: Custom patterns like SSNs, or remove a field entirely.
- Metadata-only mode and a kill switch: Strip gen_ai.input.messages, gen_ai.output.messages and system instructions while keeping tokens, cost and latency, or drop GenAI spans altogether. Changes apply to new spans right away, with no sensor restart.
For the logs your agents write, sensitive attributes go a step further: values are masked for most users and revealable only by people whose RBAC policy allows it.
Ask Agent Mode What Happened
Agent Mode sits on top of the same data. Ask it why a Managed Agents session got slow after Tuesday's deploy, which tool burned the most tokens this week, or whether any spans were flagged is_pii yesterday. It writes gcQL across traces, logs, metrics and Kubernetes events, and whatever it builds (a dashboard, a monitor, an OTTL rule) becomes a regular groundcover asset your team can keep using.
It runs on Amazon Bedrock, Claude or ChatGPT in your own cloud account, on your quota, and it's included in Pro, Enterprise and OnPrem plans with no AI surcharge.
Claude Code and Cowork, Too
groundcover already ingests telemetry from Claude Code and Claude Cowork. Add Claude Platform traces and the agents you ship live in the same place as the tools your engineers used to build them.
Get Started
Read the setup guide to connect your Claude agents, or request a demo to see Claude traces in groundcover AI Observability. Anthropic's announcement covers their side of the launch. New to groundcover? Start a free trial.