Memory Working Set vs RSS: Key Differences & When to Use Each


Key Takeaways
- Kubernetes enforces memory limits using the working set, making it the key metric for OOM prevention.
- The working set includes active file cache, while RSS mainly reflects application memory, making RSS better for detecting leaks.
- High file I/O can increase the working set without increasing RSS, so a growing working set does not always indicate a memory leak.
- Alert on working set to avoid OOMs, and use RSS trends to debug application memory behavior.
What Is Memory Working Set
The memory working set is the portion of a process's memory that is actively in use and cannot be reclaimed without disrupting application behavior. Think of it as the minimum physical memory a process needs to run, without causing page faults. In the Linux kernel, the working set maps to:
- Anonymous memory (heap allocations, stack, shared memory)
- Active page cache (file-backed pages that have been recently accessed and promoted to the active LRU list by the kernel)
It deliberately excludes inactive file-backed pages, cached data that hasn't been touched recently, and that the kernel is free to evict without impacting the application. This makes the working set a lean, application-centric view of memory pressure.
In Kubernetes, the metric you see is container_memory_working_set_bytes, reported by cAdvisor. Under the hood, it's calculated as:
Or equivalently, from the cgroup memory.stat file:
Because inactive cache is excluded, the working set tends to be a tighter, more conservative estimate of what the application actually needs.
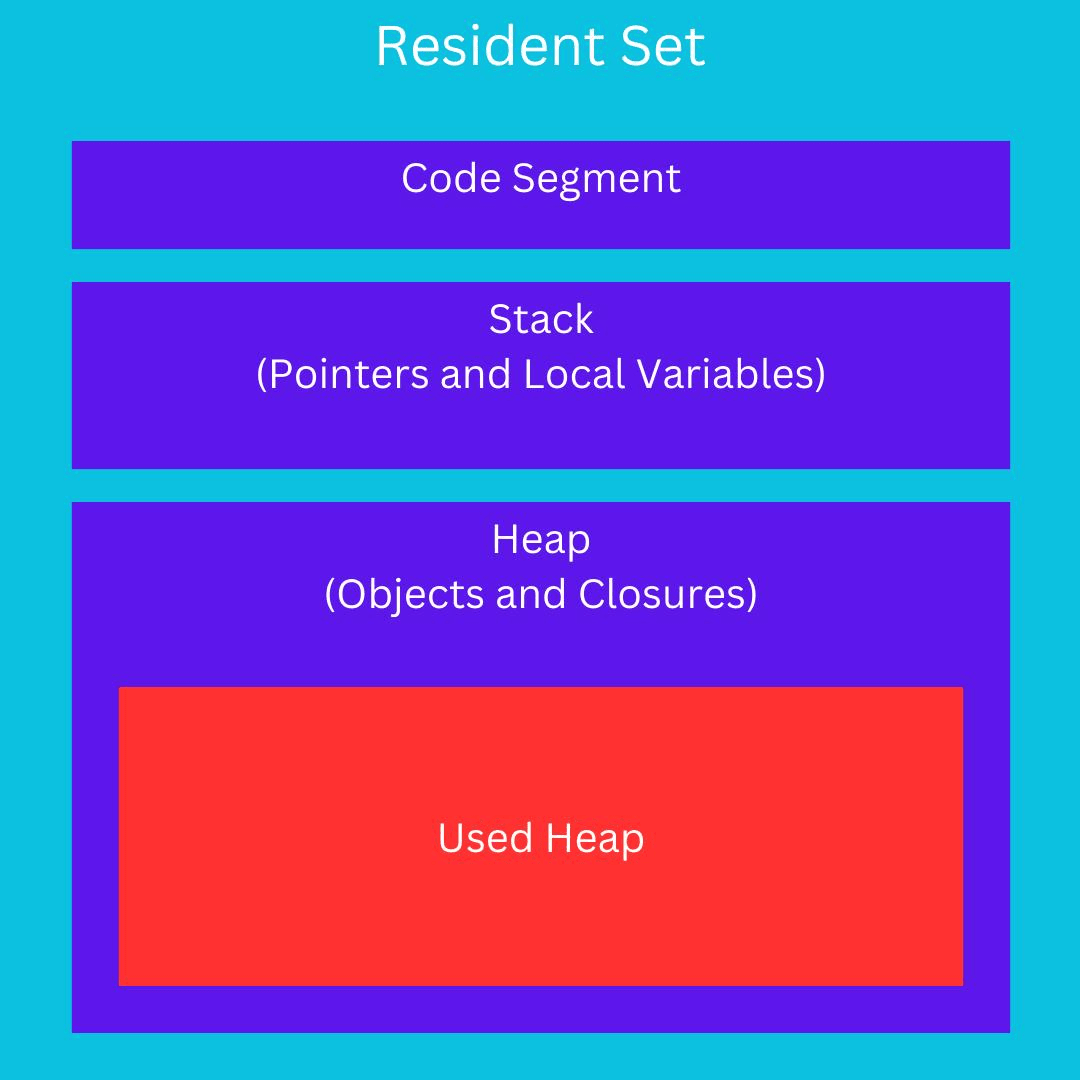
What Is RSS (Resident Set Size)
RSS, or Resident Set Size, refers to the portion of a process's memory that is held in physical RAM right now, not swapped, not mapped, but untouched. In the Linux context, the traditional definition from /proc/<pid>/status includes:
- Anonymous memory (heap, stack)
- File-mapped memory currently loaded into RAM
In the Kubernetes/cAdvisor context, container_memory_rss means something more specific:
The amount of anonymous memory and swap cache memory (including transparent hugepages), pulled directly from total_rss in the cgroup memory.stat file.
Importantly, this does not include file-backed page cache at all. So cAdvisor's container_memory_rss is actually narrower than the traditional Linux RSS definition. It covers purely the non-file-backed memory.
The practical result: RSS in Kubernetes is relatively stable. It grows when your application allocates heap memory and shrinks when it frees it. It doesn't fluctuate with file I/O caching the way the working set does.
Memory Working Set vs RSS: Core Differences Explained
Here's how the two metrics stack up across the dimensions that actually matter for day-to-day operations:
The single most important difference: Memory limits in Kubernetes are enforced against the working set, not RSS. The kubelet uses container_memory_working_set_bytes as the reference when deciding whether a container has exceeded its memory limit.
How Reclaimable Cache Impacts Memory Working Set and RSS
Understanding the role of the page cache is what separates engineers who truly understand memory from those who just read dashboards. When your application reads files, config files, libraries, and database files, the kernel stores those pages in the page cache to speed up future reads. This cache is split into two tiers:
- Active file cache: Pages accessed recently (at least twice). The kernel is reluctant to evict these.
- Inactive file cache: Pages accessed once and not since. These are prime candidates for reclamation under memory pressure.
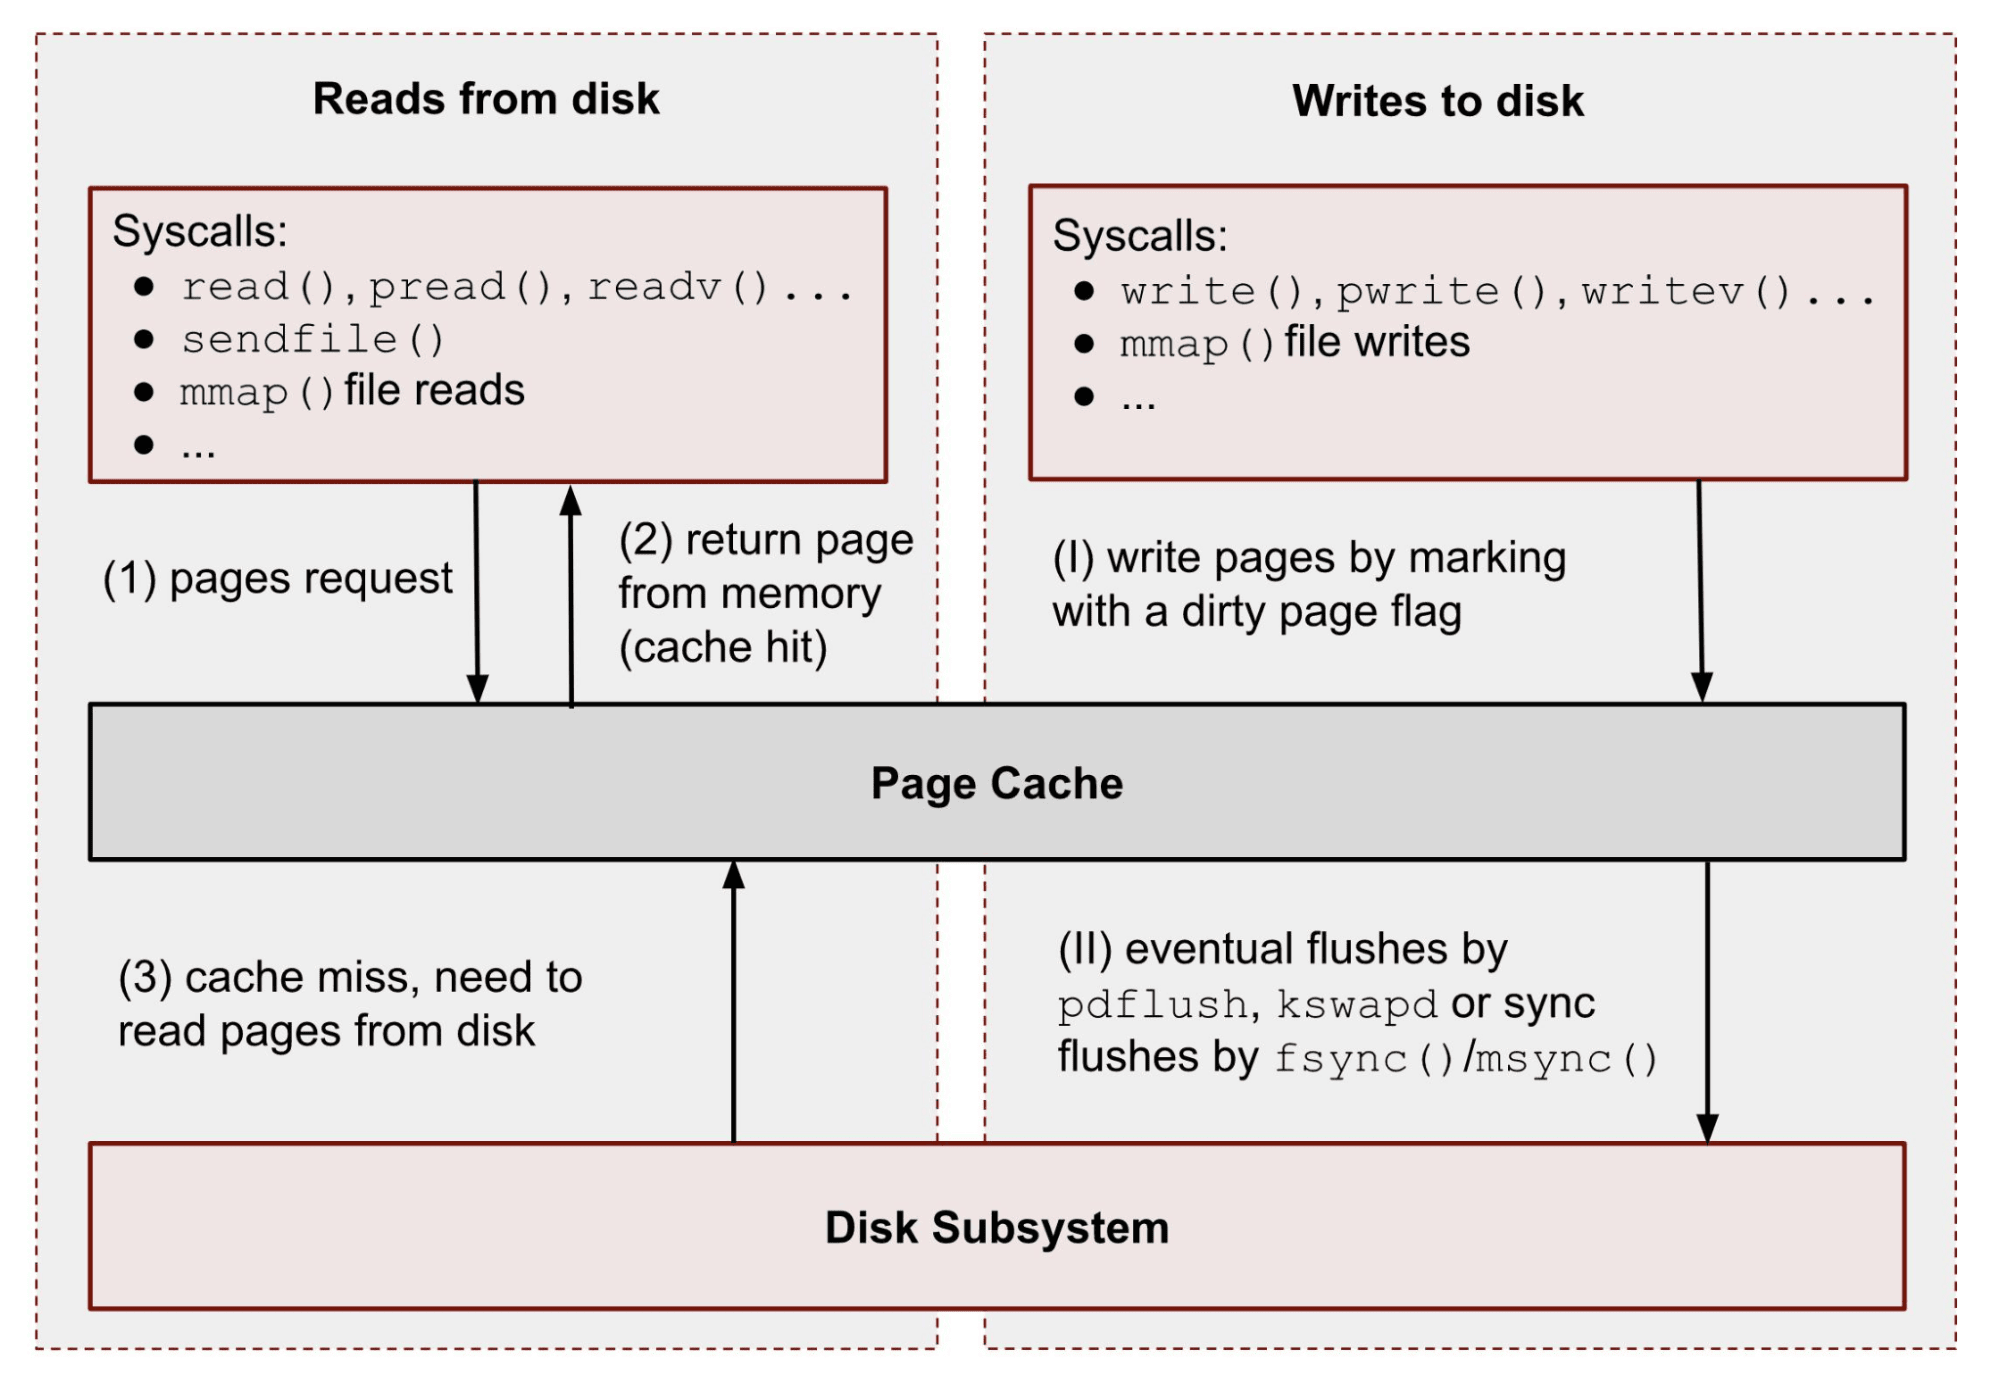
Here's how these tiers flow through the two metrics:
The practical implication: If your service starts reading a lot of data from disk, for instance, loading a large model file or scanning logs, the active file cache will spike. Your working set goes up. RSS doesn't budge. If the kernel later decides those pages are inactive, the working set comes back down automatically, without your application doing anything.
This is why a working set can appear to "self-heal" and why RSS is a more stable measure of what your application code is actually holding onto.
How Memory Working Set and RSS Behave in Kubernetes and cAdvisor Metrics
cAdvisor (Container Advisor) is the component that actually collects memory statistics from the Linux cgroup filesystem and exposes them to Prometheus. Both metrics originate from /sys/fs/cgroup/memory/memory.stat.
Here's a simplified view of what a real memory.stat file looks like inside a running container:
From these raw values, cAdvisor derives the Prometheus metrics:
Notice that the working set is meaningfully higher than RSS but lower than raw usage. It sits in the middle and gives you a picture of "memory that matters."
In your Prometheus queries, you'd typically monitor these like:
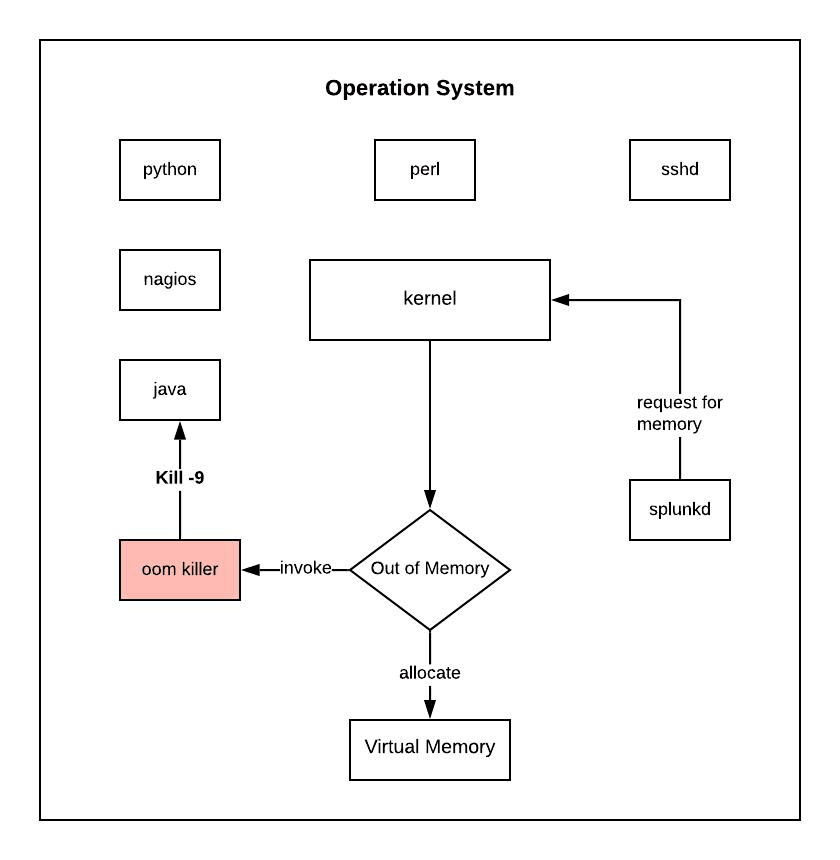
Why Memory Working Set Drives OOM and Memory Pressure Decisions
This is the part that has operational teeth. Kubernetes uses container_memory_working_set_bytes as the reference memory figure when evaluating whether a container has hit its memory limit. When a container's working set exceeds the configured resources.limits.memory, the kernel's cgroup OOM killer steps in and terminates the process.
This table reveals a subtle danger: High I/O workloads can inflate the working set even when the application itself isn't leaking memory. You can get OOMKilled not because your app is broken, but because the kernel pulled a lot of data into the active file cache, and your memory limit is set too tight.
The kubelet also uses a working set for node-level memory pressure eviction. When a node is under memory pressure, pods are ranked partly by their working set vs. request ratio, and pods with the highest excess are evicted first.
When to Use Memory Working Set vs RSS for Monitoring and Debugging
Neither metric is universally better; the right choice depends on what question you're trying to answer.
Use the memory working set when:
- Setting or validating memory limits and requests for pods
- Diagnosing OOMKill events (the working set is what the kernel compares against the limit)
- Capacity planning across a node (node memory pressure uses the working set)
- Building alerts for containers approaching their memory limit
Use RSS when:
- Investigating a suspected memory leak in application code (RSS growth without a corresponding working set growth narrows the search to heap behavior)
- Profiling applications with high file I/O, where the working set is noisy
- Comparing heap behavior between application versions in a controlled benchmark
- Debugging JVM-based apps where GC patterns affect the heap but not file cache
Practical rule of thumb: Alert on working set (it's what causes OOM), debug with RSS (it's what reveals application-level memory behavior).
Common Mistakes When Interpreting Memory Working Set and RSS
A few patterns come up again and again when engineers are troubleshooting memory issues:
- Treating RSS as the OOM trigger. It isn't. Kubernetes enforces limits against the working set. You can have a low RSS and still get OOMKilled if your active file cache is large enough to push the working set over the limit.
- Assuming a growing working set always means a memory leak. Not necessarily, it could be the active page cache growing due to increased file reads. Compare with RSS: if RSS is flat but the working set is climbing, look at I/O patterns first.
- Conflating container_memory_rss with traditional Linux RSS. In cAdvisor, container_memory_rss excludes file-mapped memory. The traditional Linux RSS from /proc/[pid]/status includes it. These are not the same numbers.
- Setting memory limits based on container_memory_usage_bytes. This metric includes inactive file cache, which can be reclaimed. Setting limits here leads to over-provisioning. Base limits on working set with headroom.
- Ignoring total_inactive_file when analyzing raw cgroup stats. If you're reading memory.stat directly and summing values to estimate usage, forgetting to subtract inactive file pages will make the container look like it's using more memory than it really needs.
How to Monitor Working Set and RSS
The most common setup is Prometheus + cAdvisor + Grafana, which gives you both metrics out of the box.
Prometheus alerting rules for working set:
PromQL for a quick working set vs RSS comparison:
Best Practices for Interpreting Memory Metrics
Deeper Memory Visibility Across Working Set and RSS with groundcover
Standard Prometheus + cAdvisor setups expose metrics like container_memory_working_set_bytes and container_memory_rss, but they leave an important observability gap: they show that memory usage increased, not why. Correlating a working set spike with a specific request path, workload behavior, or service dependency often requires jumping across multiple tools such as Grafana, Jaeger, Kubernetes events, and application logs.
groundcover is a Kubernetes-native observability platform that uses eBPF to collect telemetry directly from the Linux kernel with very low overhead. Its eBPF sensor provides infrastructure metrics, Kubernetes context, traces, logs, and network visibility without requiring sidecars, code changes, or heavy manual instrumentation. For memory specifically, this matters because:
- Working set spikes are automatically correlated with traces. When container_memory_working_set_bytes climbs on a specific pod, you can immediately drill into what request traffic was happening at that moment, without manually joining data across Grafana and Jaeger.
- Infrastructure monitoring provides node-level and pod-level memory visibility together, making it easier to determine whether memory pressure is isolated to a container or affecting node scheduling and cluster stability. groundcover's BYOC architecture keeps all telemetry inside your own cloud environment, which matters for teams with data residency or privacy requirements.
- Distributed tracing and APM capabilities help connect sustained RSS growth to specific services, endpoints, or workload behaviors, which is valuable when investigating potential memory leaks.
- Kubernetes monitoring surfaces OOMKill events, restart counts, and memory limit proximity in a unified workflow instead of requiring separate investigation across Prometheus, kubectl, and logging systems.
Conclusion
The memory working set vs RSS distinction isn't academic; it directly shapes how Kubernetes makes OOM and eviction decisions, and getting it wrong leads to either unnecessary OOMKills or missed memory leaks. The working set is what gets checked against your memory limits; RSS is the purer signal for what your application code is actually holding. Use both, understand what each excludes, and you'll spend a lot less time debugging memory incidents at 2 AM.


.svg)