Container CPU Throttling: Causes, Impact & Optimization


Key Takeaways
- CPU throttling in Kubernetes silently slows applications by pausing containers that exceed their CPU limits, even when the node has spare capacity.
- Because throttling doesn’t crash workloads or raise obvious alerts, it often shows up only as higher latency and lower throughput, making it easy to misdiagnose.
- The root cause is usually configuration, limits set too close to actual usage or bursty workloads exhausting their quota within each scheduling cycle.
- Standard CPU metrics can look “normal” during throttling, so teams need to monitor throttling-specific signals (like throttled periods ratio) to see the real impact.
- Preventing throttling requires right-sizing CPU limits, allowing headroom for spikes, and combining better observability with application and scaling optimizations.
Modern cloud-native applications rely heavily on container orchestration platforms like Kubernetes to efficiently manage compute resources. However, one often-overlooked performance bottleneck is container CPU throttling - a silent limiter that can degrade application responsiveness even when infrastructure appears underutilized.
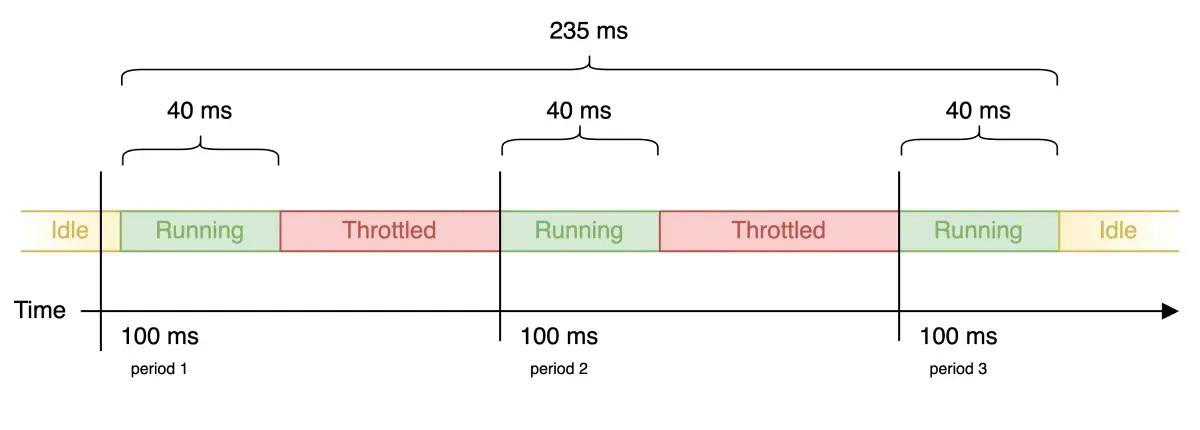
CPU throttling is a well-documented cause of latency degradation in containerized environments. For example, with a CPU limit of 0.4 cores, an operation that normally completes in 200 ms can take up to ~440 ms (over 2× slower) due to enforced CFS throttling.
In more extreme cases, misconfigured CPU limits have been shown to cause up to 4× increases in response time because workloads are repeatedly paused within each scheduling cycle. These effects occur even when overall node CPU utilization is low, making CPU throttling a critical and often hidden source of latency in Kubernetes environments.
What Is Container CPU Throttling?
Container CPU throttling is the mechanism by which the Linux kernel forcibly restricts a container's CPU usage the moment it exceeds its defined limit. This enforcement is handled by the Completely Fair Scheduler, or CFS, which ensures CPU resources are distributed fairly across all running workloads on the node. In Kubernetes, CPU resources are defined using two key parameters:
- Requests: The minimum amount of CPU guaranteed to a container, used for scheduling decisions
- Limits: The maximum amount of CPU a container is allowed to consume at runtime
When a container tries to use more CPU than its configured limit, it is not terminated. Instead, it is temporarily paused and prevented from executing until it is allowed to run again in the next scheduling cycle. This process is known as CPU throttling.
Unlike memory limits, which outright kill a container when breached, CPU throttling never crashes your application. It simply slows it down. That subtlety is precisely what makes it dangerous, because your workloads keep running, alerts never fire, and the degradation gets misdiagnosed for weeks. A key characteristic of container CPU throttling is that it is enforced at the container level, not at the node level. This means:
- A container can be throttled even if the node has available CPU capacity
- Unused CPU from other containers is not automatically shared
- Performance issues can occur despite low overall CPU utilization
This behavior often surprises teams new to Kubernetes, as it creates a disconnect between infrastructure metrics and application performance. In practice, container CPU throttling manifests as:
- Increased response times
- Slower request processing
- Reduced throughput under load
How Container CPU Throttling Works
The Linux kernel is what actually enforces CPU throttling, using a feature called cgroups under the hood. Kubernetes does not do this itself. It takes the CPU limits you define and converts them into kernel-level parameters, and from there, the kernel takes over and does the actual enforcement at runtime. At the core of this mechanism are two key settings:
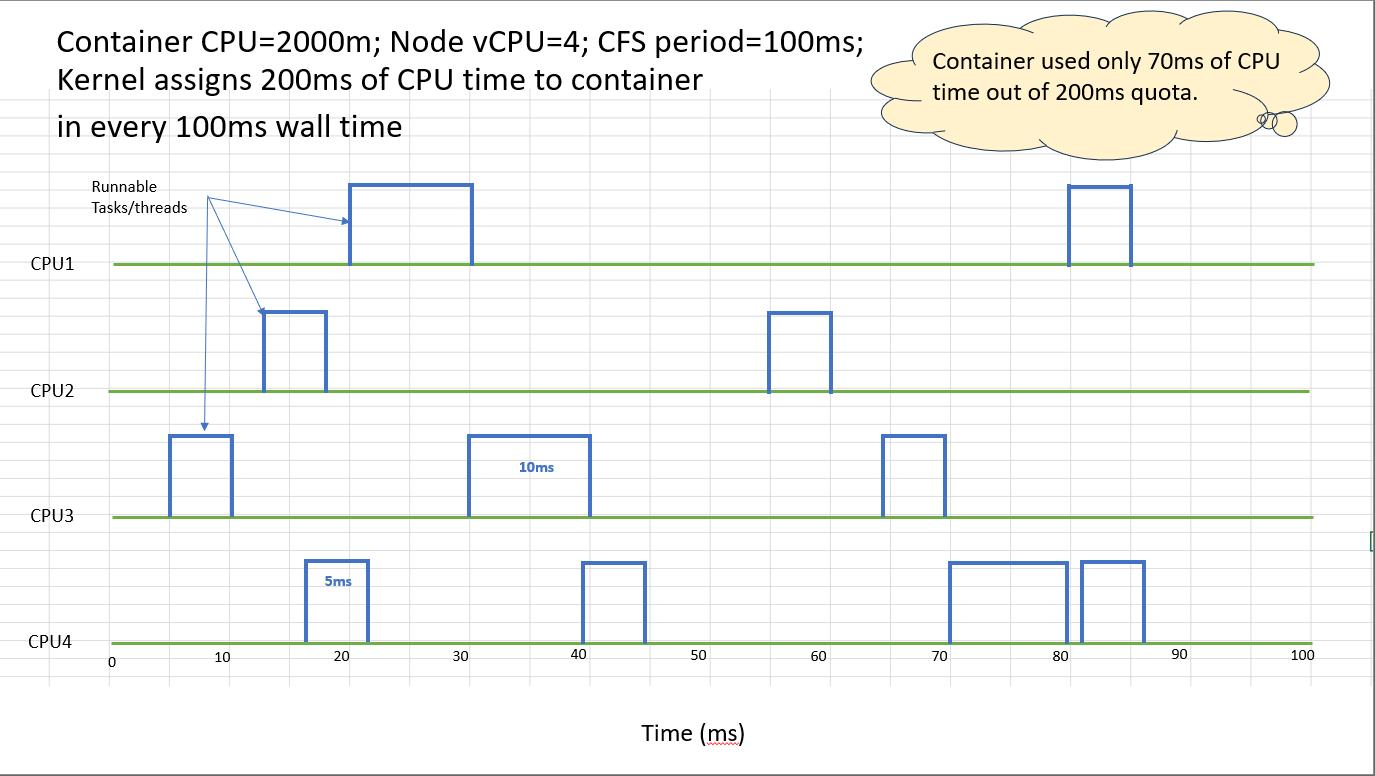
Together, these values define how much CPU a container is allowed to consume within each scheduling cycle.
Example:
- cpu.cfs_period_us = 100000 (100ms)
- cpu.cfs_quota_us = 50000 (50ms)
In this configuration:
- The container can run for 50ms within each 100ms window
- Once the quota is exhausted, the container is paused
- It resumes execution in the next cycle when the quota resets
This creates a repeating “run–pause–run” pattern. While each pause is very short, the cumulative effect can significantly impact application performance, especially under sustained or bursty workloads.
How Kubernetes Maps CPU Limits
When CPU limits are defined in Kubernetes, they are automatically converted into these cgroup values behind the scenes.
In this example:
- A limit of 1 CPU allows full usage of the 100ms period
- A request of 500m represents half a CPU for scheduling purposes
This abstraction simplifies configuration but can hide how strict enforcement actually works at the kernel level.
CPU Shares vs CPU Quota
Kubernetes manages CPU using two complementary mechanisms:
- CPU Shares (Requests)
- Represent relative weight when CPU resources are contested
- Ensure fair scheduling but do not cap usage
- CPU Quota (Limits)
- Define a hard upper bound on CPU usage
- Enforced through throttling
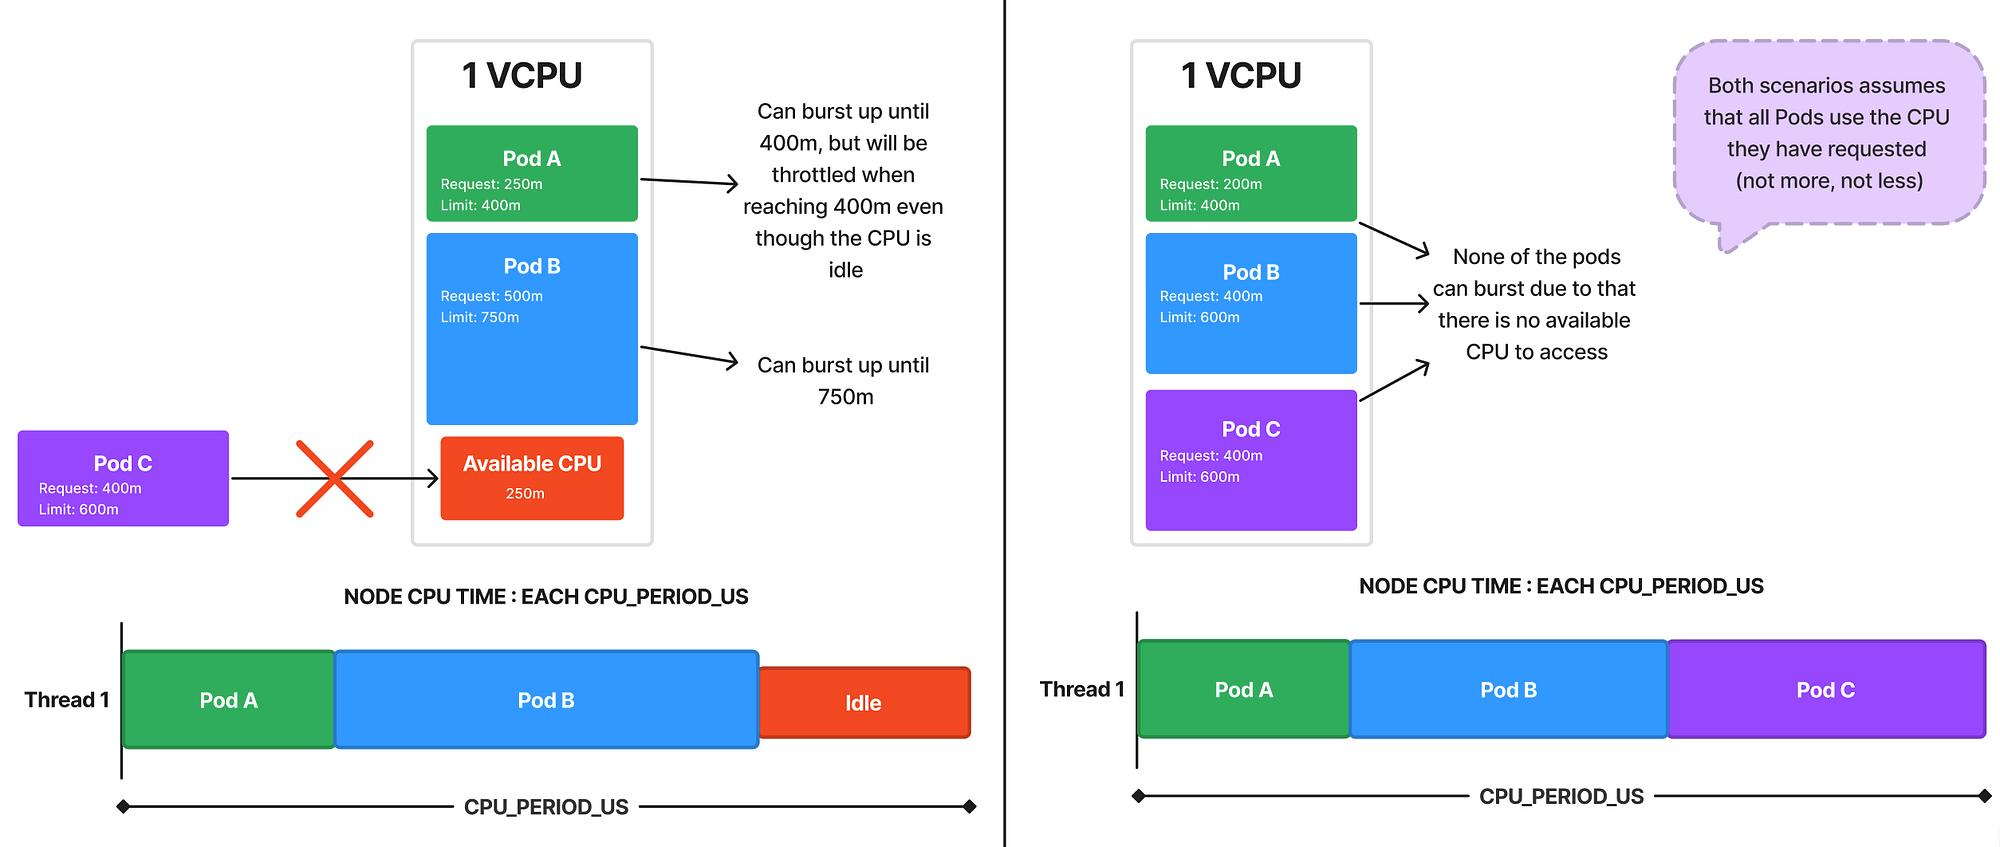
A key point is that CPU throttling only occurs when limits are set. If no limit is defined, a container can use additional CPU when it is available on the node.
Common Causes of Container CPU Throttling
CPU throttling is rarely caused by an actual CPU shortage on the node. It is almost always a configuration problem. When your CPU limits are too tight relative to how your workload actually behaves at runtime, the kernel enforces those hard caps regardless of how much CPU is sitting idle on the node. That is what makes throttling a design and configuration concern, not an infrastructure one.
- Overly Restrictive CPU Limits: Limits set too close to requests leave no headroom for peak demand, causing frequent throttling
- Bursty Workloads: Sudden traffic spikes or batch jobs quickly exhaust the CPU quota within a scheduling window
- Poor Resource Planning: Misaligned requests vs limits and static configurations in dynamic environments
- High Pod Density Per Node: Increased CPU contention raises the likelihood of hitting quotas
- Inefficient Code or Threading: CPU-heavy loops, blocking calls, and a lack of parallelism accelerate quota exhaustion
The Impact of Container CPU Throttling on Application Performance
CPU throttling does not degrade performance in a straight line, which is exactly why it escapes detection for so long. There are no OOMKills, no crash loops, no obvious signals. What you get instead are intermittent execution pauses imposed by the CFS, while your monitoring stack reports the container as perfectly healthy.
This is what makes it particularly problematic in microservices environments. Each service may only be slightly delayed in isolation, but across a chain of service calls that delay compounds, and what started as a minor configuration oversight on one service eventually surfaces as unpredictable latency across the entire system.
Key Impacts
1. Increased Latency
CPU pauses delay request execution, increasing response times.
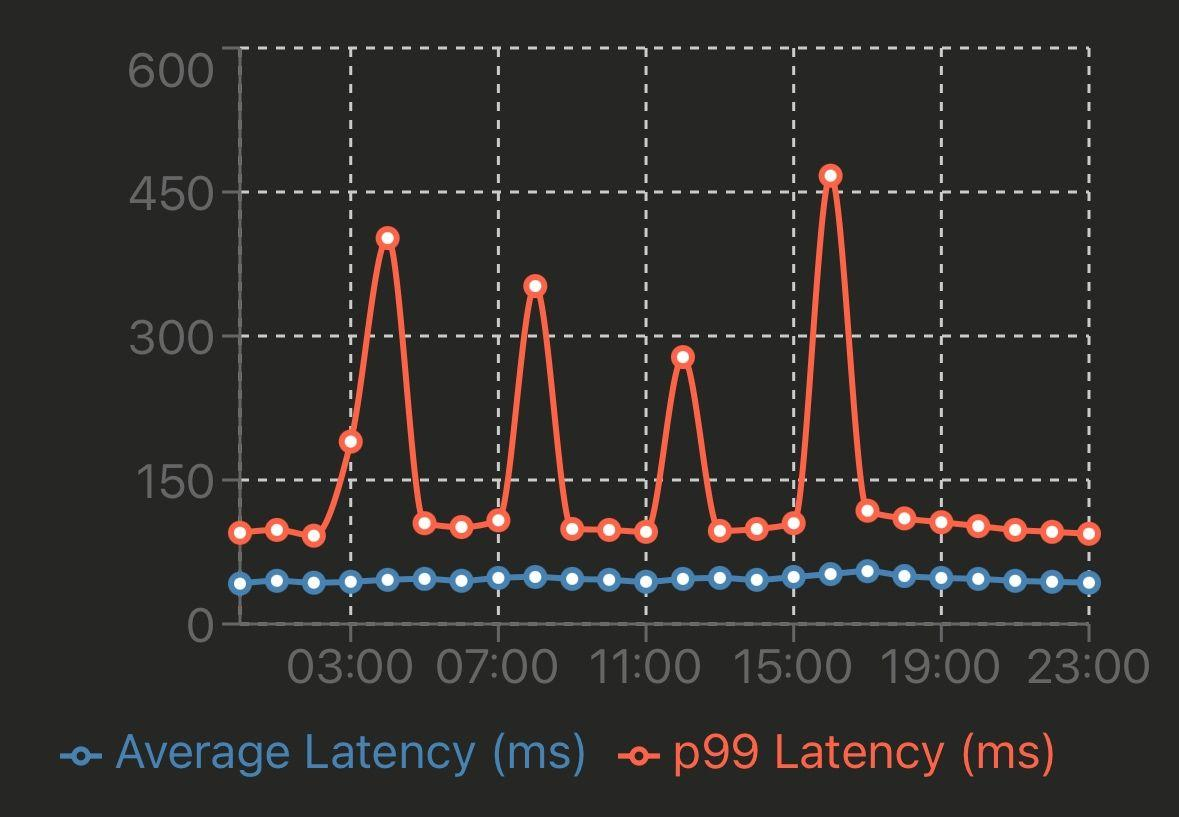
- Higher p95/p99 latency
- Slower request processing
- Impacts real-time services most
2. Reduced Throughput
Limited CPU time reduces processing capacity.
- Fewer requests per second (RPS)
- Underutilized node capacity
- More pods needed to handle the load
3. Unpredictable Performance
Throttling causes inconsistent behavior under load.
- Sudden latency spikes
- Varies with traffic bursts
- Hard to reproduce issues
4. Misleading Observability Signals
Standard metrics often fail to show throttling clearly.
- CPU usage appears normal
- No errors or crashes
- Performance issues visible only at the app level
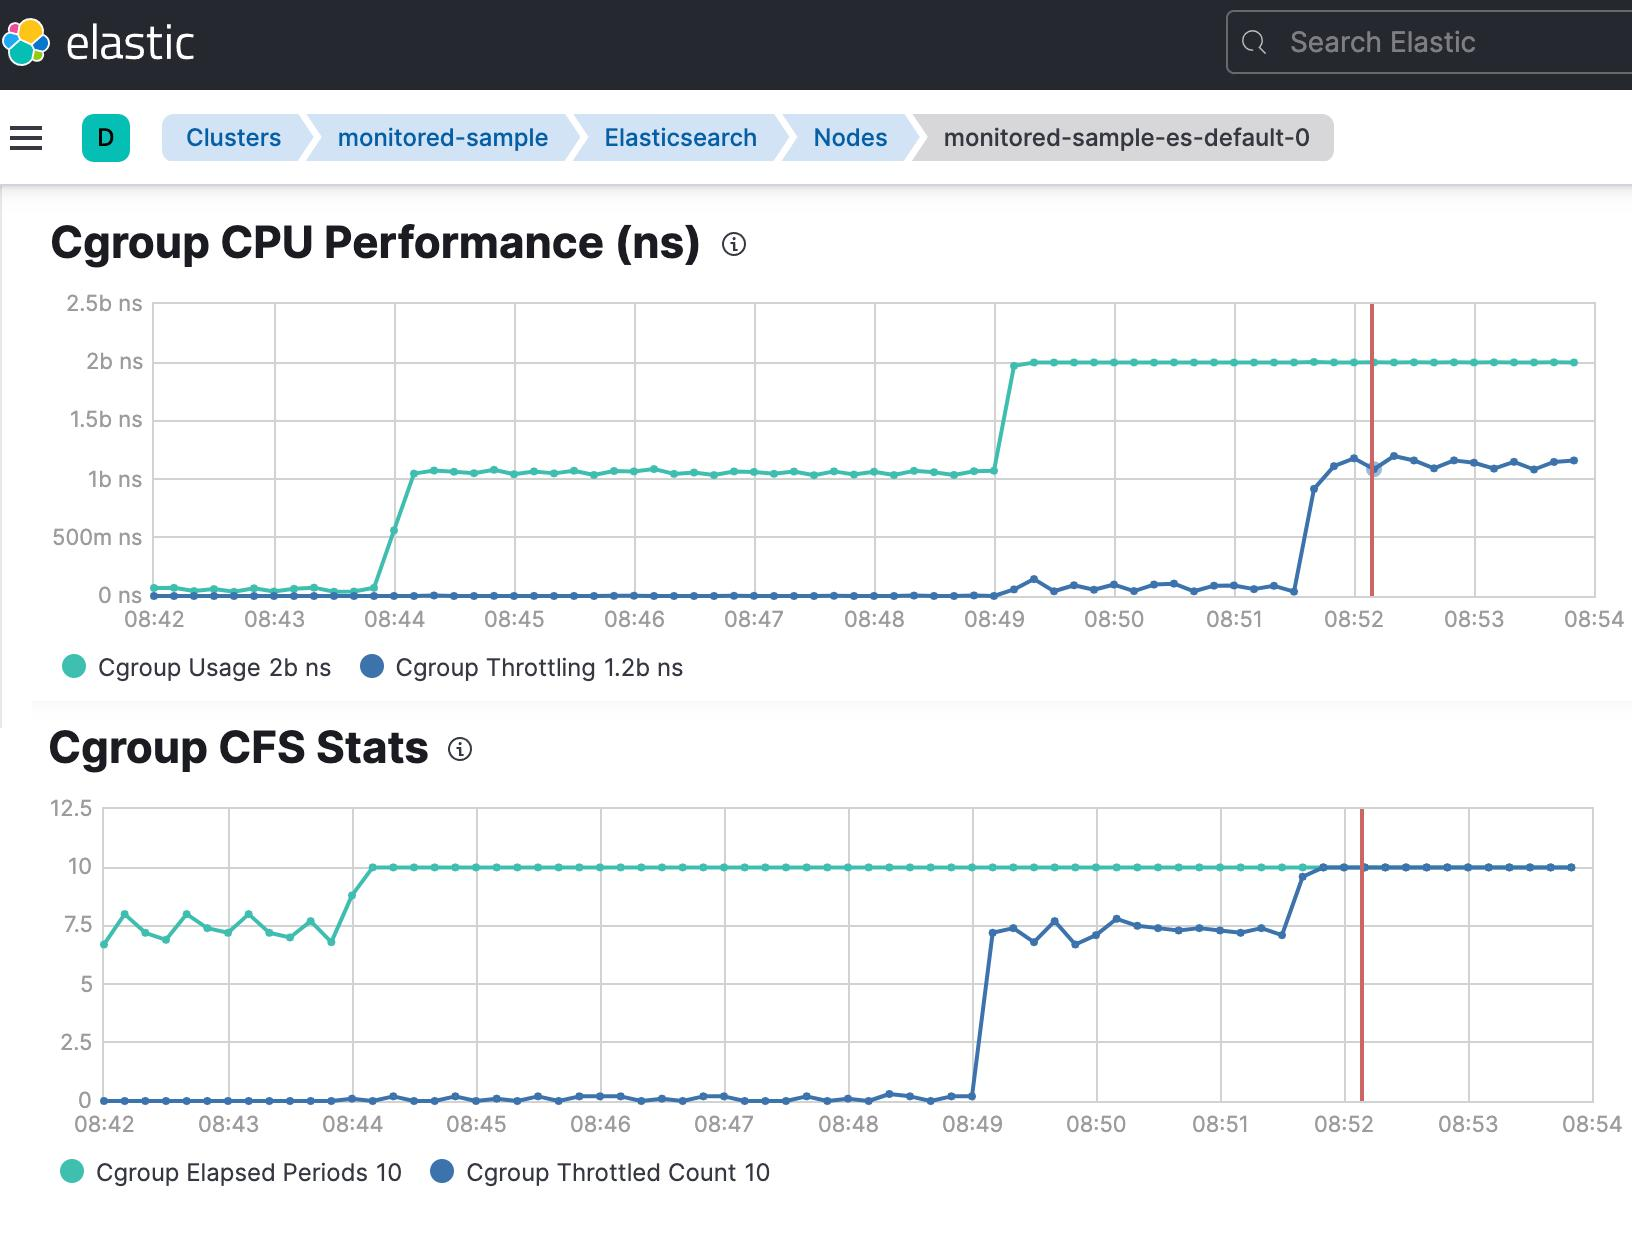
Example Scenario:
How to Detect Container CPU Throttling Using Kubernetes and Prometheus Metrics
Provide time-series visibility into CPU quota enforcement at the container level. Enable early detection of performance issues that are not visible through standard CPU utilization metrics.
1. Core Prometheus Metrics
Capture throttling events and total scheduling periods for each container. These metrics help quantify how frequently CPU limits are being enforced.
2. Throttling Ratio
Represents the percentage of time a container is throttled within a given window. Useful for identifying severity and trends of CPU constraint over time.
3. Interpretation
Classifies throttling levels (healthy, moderate, severe) for easier analysis. Supports alerting and informed resource tuning decisions.
Key Metrics That Reveal Container CPU Throttling Issues
While monitoring, be cautious of Prometheus cardinality and high cardinality metrics, which can degrade performance.
Important Metrics
- container_cpu_usage_seconds_total
- container_cpu_cfs_throttled_seconds_total
- container_spec_cpu_quota
- Container_spec_cpu_period
Cardinality Considerations
High cardinality arises from:
- Excessive label values
- Many key value pairs
- Tracking multiple instances
Example Problem
- request_id → high cardinality label
- Leads to:
- More data points
- Increased memory usage
- Slower query performance
Best Practice
- Avoid unnecessary labels
- Focus on aggregation
- Optimize queries
Troubleshooting Container CPU Throttling Step by Step
A structured approach helps isolate root causes quickly. This ensures both infrastructure and application-level factors are evaluated systematically.
1. Validate CPU Requests and Limits Configuration
Check if limits are too restrictive:
Look for:
- Requests vs limits mismatch
- Overcommitment
Small gaps between requests and limits often lead to frequent throttling under burst conditions. Ensure limits provide sufficient headroom based on observed workload patterns.
2. Review cpu.cfs_period_us and cpu.cfs_quota_us Settings
Inspect cgroup values:
Ensure quota aligns with workload needs. Compare container-level throttling with node-level utilization for accurate diagnosis. This helps distinguish between true resource shortage and configuration issues.
3. Analyze Pod-Level and Node-Level CPU Usage
Use:
Key insight:
- Low node usage + high throttling = misconfiguration
Application inefficiencies can accelerate CPU quota exhaustion. Optimizing code paths can significantly reduce throttling frequency.
4. Identify Application-Level CPU Spikes
Use profiling tools:
- pprof (Go)
- Java Flight Recorder
- Python cProfile
Look for:
- Hot loops
- Inefficient algorithms
- Blocking operations
How to Mitigate and Prevent Container CPU Throttling
Optimization requires both infrastructure tuning and application improvements.
Right-Size CPU Requests and Limits
- Avoid setting limits too close to requests
- Allow headroom for bursts
Example:
Optimize Application Threading and Workloads
- Use async processing
- Avoid CPU-heavy blocking calls
- Parallelize effectively
Rebalance Workloads Across Nodes
- Use Kubernetes scheduler strategies
- Avoid CPU hotspots
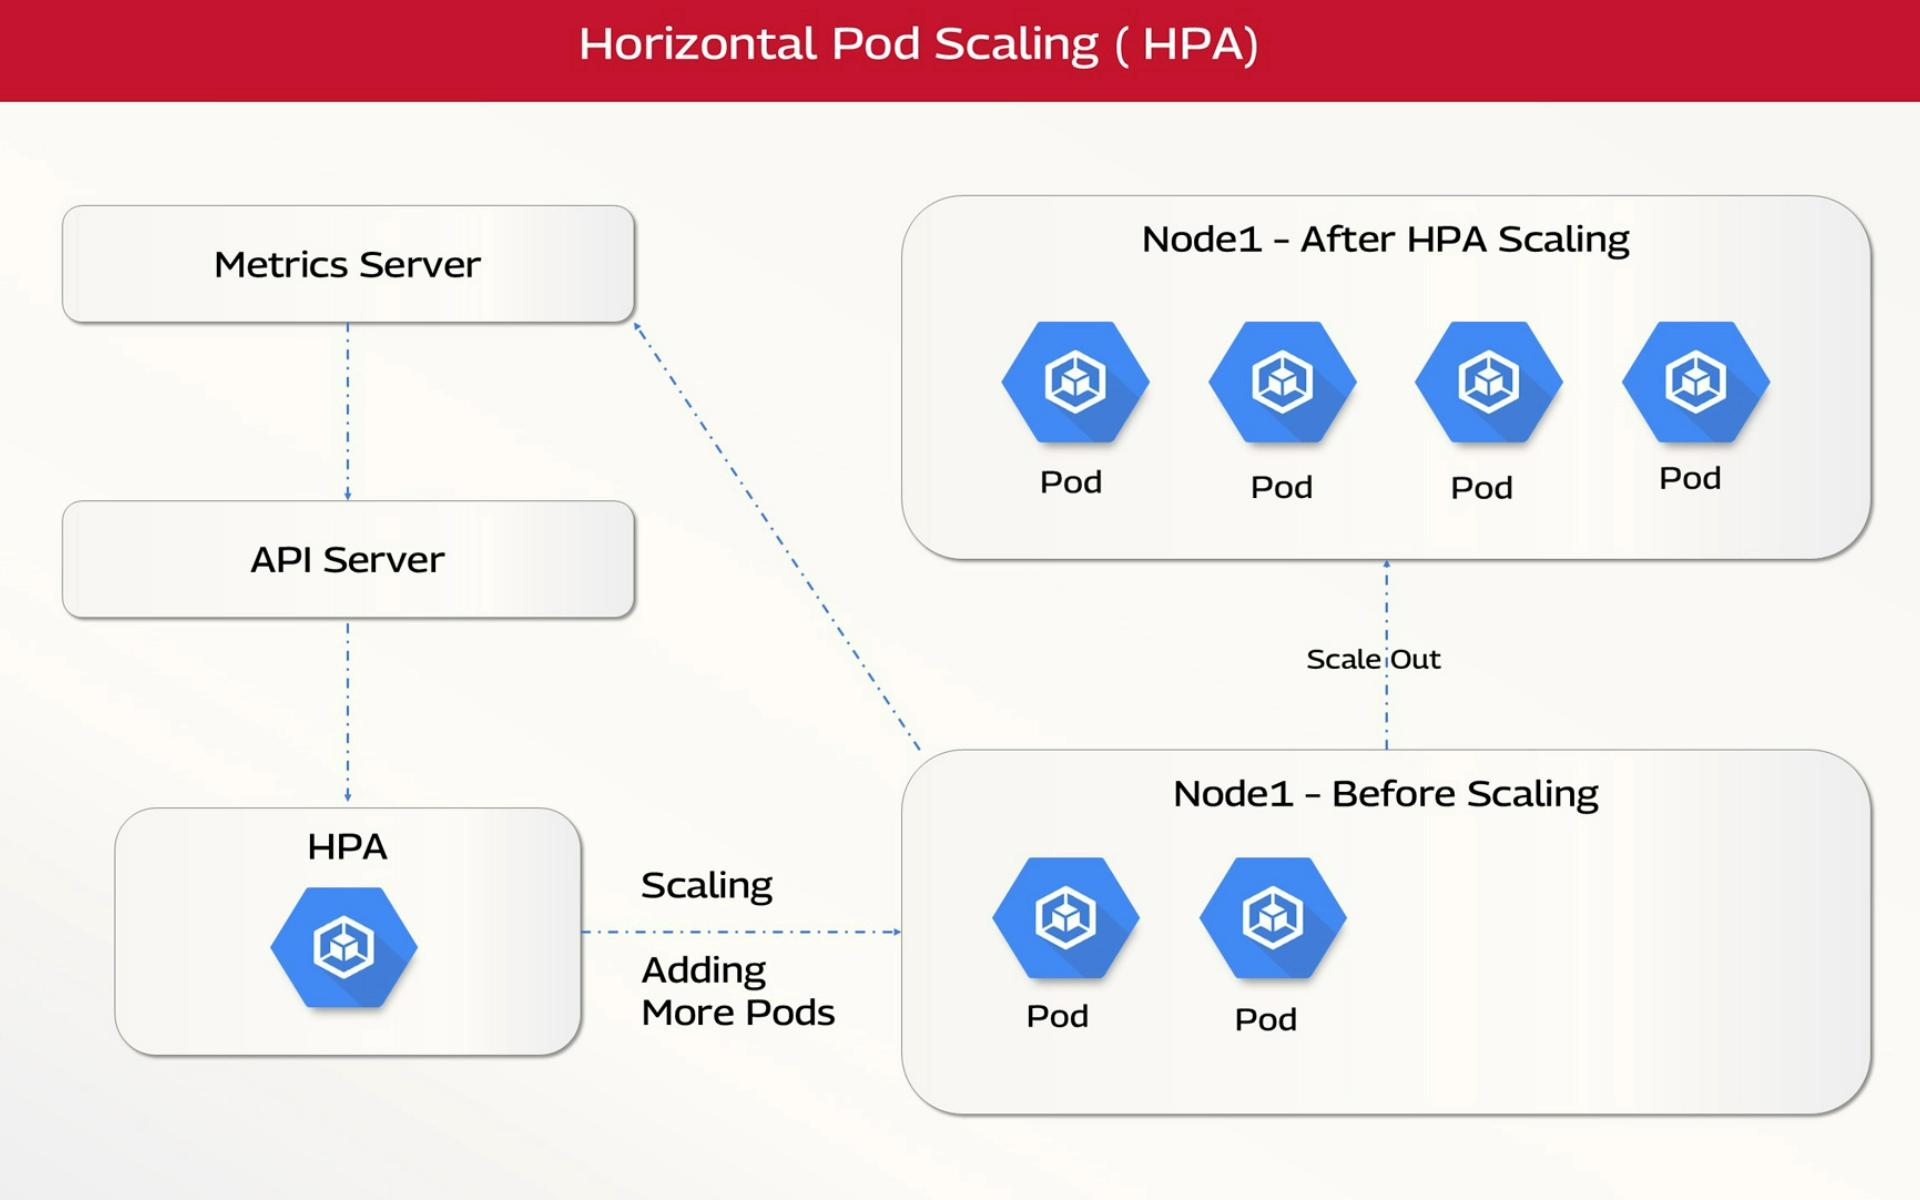
Implement Horizontal and Vertical Autoscaling
Horizontal Pod Autoscaler (HPA)
Vertical Pod Autoscaler (VPA)
- Adjusts resource requests dynamically
Best Practices for Avoiding Container CPU Throttling in Production
Proactive CPU resource engineering and observability-driven tuning are essential to prevent throttling-induced performance degradation in containerized environments.
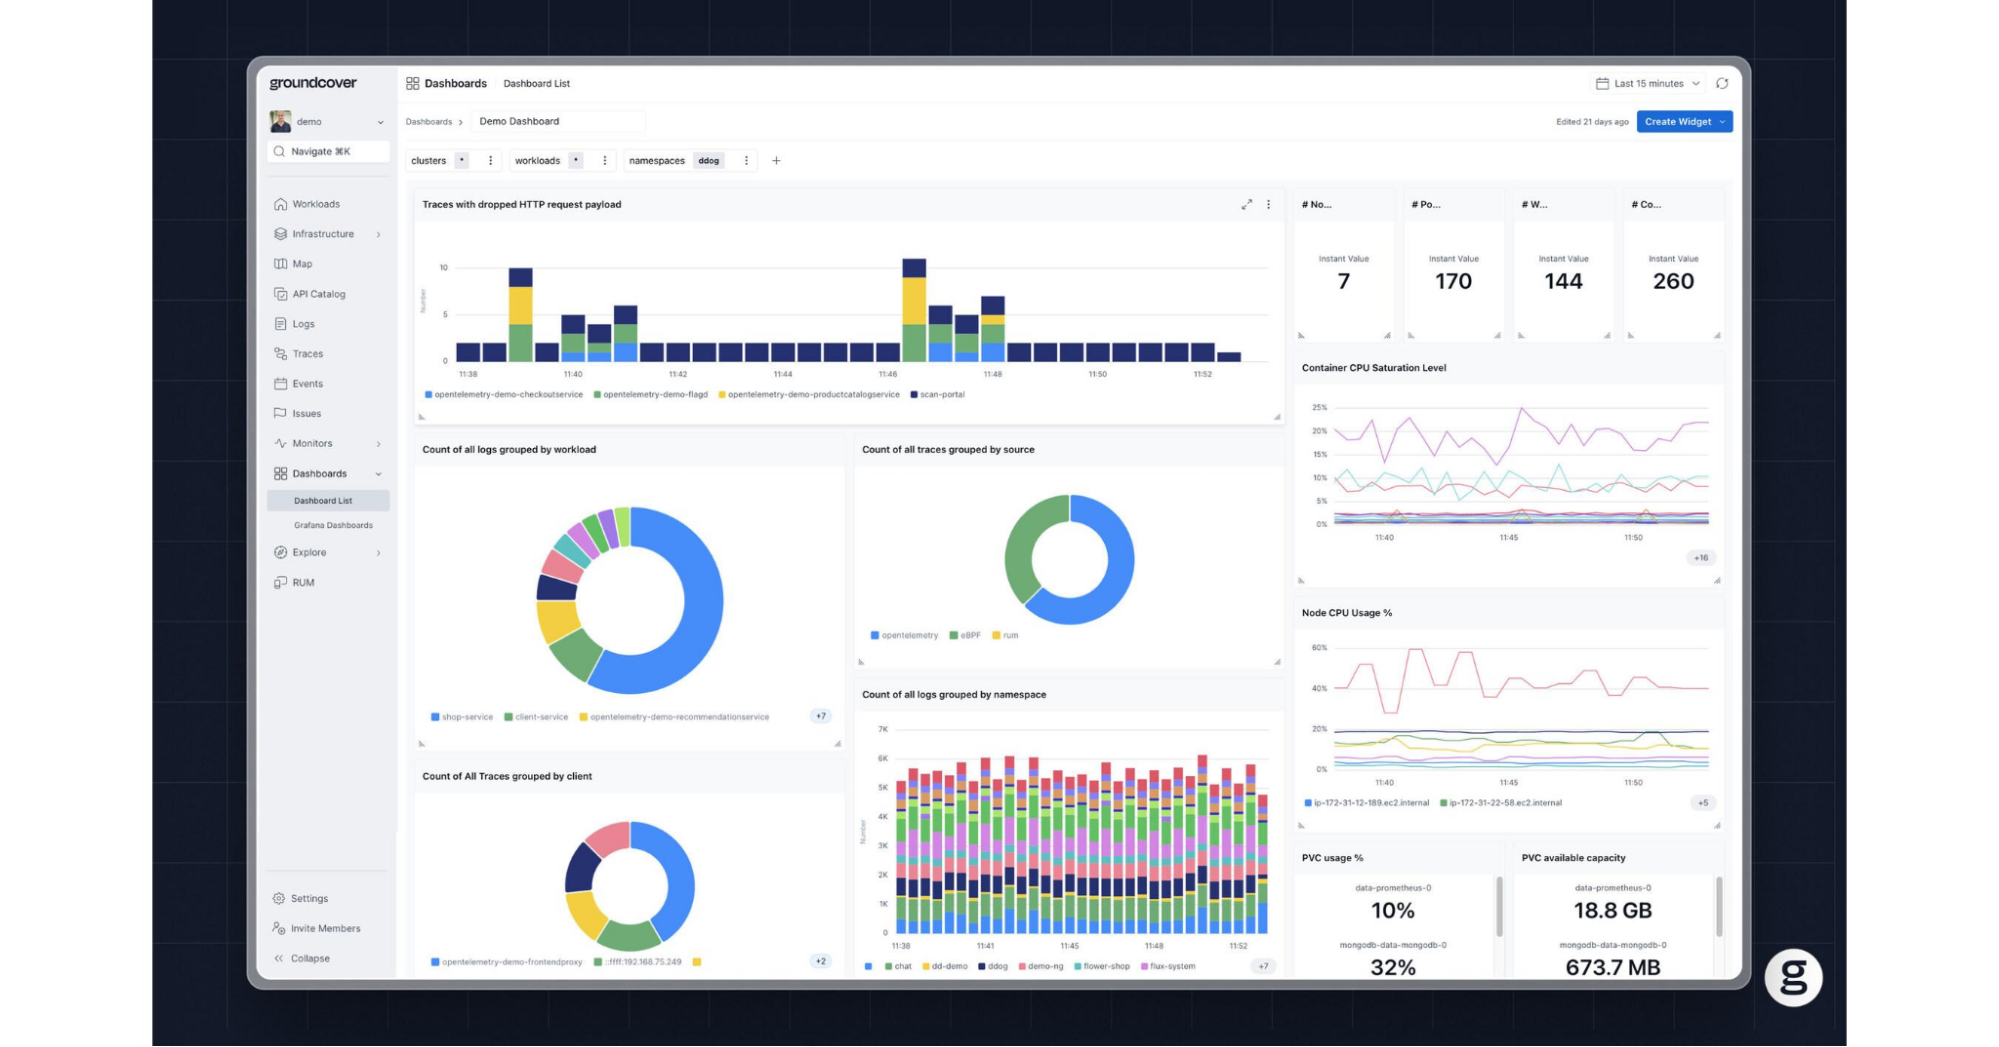
Real-Time Visibility Into Container CPU Throttling with groundcover
Traditional monitoring approaches often fail to capture CPU throttling accurately due to sampling delays, high cardinality overhead, and lack of kernel-level visibility. This creates a gap between infrastructure metrics and actual application performance. Platforms like groundcover address this by providing real-time, low-overhead observability directly from the kernel layer, enabling precise detection and correlation of CPU throttling events.
Why Traditional Observability Falls Short
Most Kubernetes monitoring stacks rely on periodic scraping (e.g., Prometheus), which introduces:
- Latency in detection due to scrape intervals
- Metric explosion from high cardinality labels
- Fragmented visibility across metrics, logs, and traces
- Misleading signals where CPU usage appears normal despite throttling
This makes root cause analysis reactive rather than proactive.
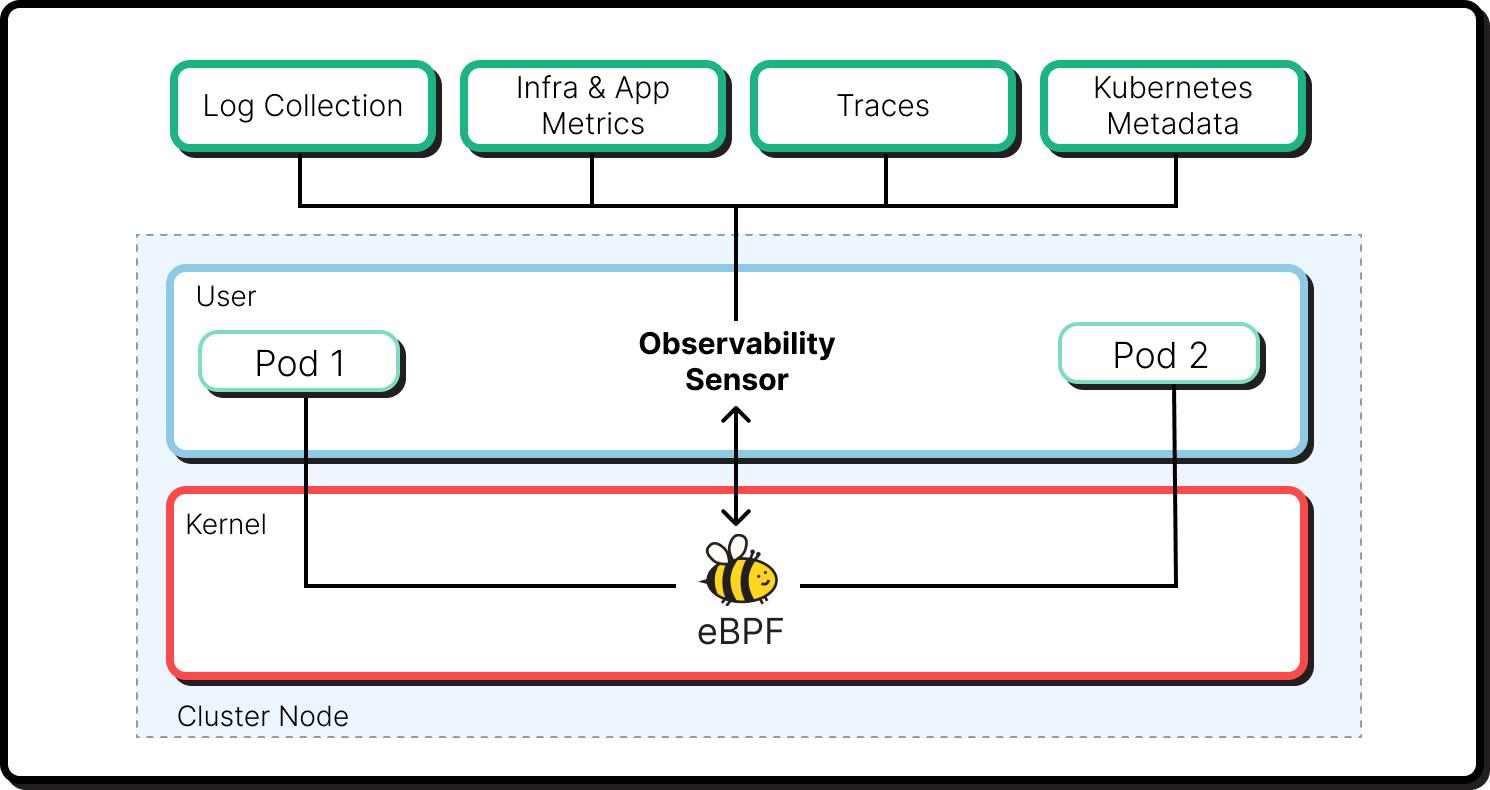
How groundcover Enables Deep CPU Throttling Visibility
1. eBPF-Based Kernel-Level Instrumentation
groundcover leverages eBPF to capture CPU scheduling and throttling behavior directly from the Linux kernel:
- No application instrumentation required
- Visibility into actual CFS quota enforcement
- Accurate measurement of run–pause cycles
This eliminates reliance on inferred metrics and provides ground truth observability.
2. Real-Time Detection Without Scrape Lag
Unlike pull-based systems, groundcover processes telemetry in real time:
- Immediate detection of throttling spikes
- No dependency on scrape intervals or polling delays
- Faster Mean Time to Detect (MTTD)
This is critical for bursty workloads where throttling occurs in short windows.
3. Unified Telemetry Correlation (Metrics + Logs + Traces)
groundcover provides a single-pane-of-glass view by correlating:
- CPU throttling metrics
- Application logs
- Distributed traces
This makes it easier to trace latency spikes back to CPU quota exhaustion, identify which service or component is affected, and understand cascading impacts across microservices.
4. Efficient Handling of High Cardinality Data
High cardinality is a major bottleneck in traditional observability systems. groundcover addresses this through:
- Adaptive label indexing
- Efficient storage models
- Query optimization at scale
This allows teams to retain granular visibility (e.g., per pod/container) without sacrificing performance.
5. Contextual Root Cause Analysis
Instead of manually stitching together signals, teams can:
- Identify throttled containers instantly
- Correlate with deployment changes or traffic spikes
- Drill down into specific code paths or requests
This shifts troubleshooting away from metric hunting and toward context-driven debugging.
Example Workflow
A typical investigation with groundcover might look like:
- Detect a spike in latency for a microservice
- Instantly observe increased CPU throttling ratio
- Correlate with a specific pod and deployment version
- Trace request path showing delayed execution segments
- Identify the CPU-bound function causing quota exhaustion
Key Benefits
- Reduced MTTR through faster correlation
- Higher signal accuracy via kernel-level data
- Lower operational overhead compared to traditional stacks
- Improved performance tuning through actionable insights
Conclusion
Container CPU throttling is a critical yet often hidden performance constraint in Kubernetes environments, arising from how CPU limits are enforced via CFS quotas. It impacts latency, throughput, and system predictability even when overall CPU utilization appears low, making it difficult to detect without the right metrics and observability practices. By understanding its root causes, monitoring throttling ratios, and applying proper resource tuning and scaling strategies, teams can significantly improve application performance, reliability, and cost efficiency.
What makes CPU throttling especially difficult is that it rarely looks like a clear infrastructure failure. The container stays healthy, the node may appear underutilized, and standard CPU dashboards often fail to reflect the real source of slowdown. That is why effective troubleshooting depends on connecting kernel-level throttling behavior to application symptoms in real time, so teams can identify whether the issue is caused by configuration, workload design, or sustained resource pressure before it spreads across services.


.svg)