CPU Shares in Kubernetes: Performance, Scheduling & Best Practices



On the surface, granting CPU resources to Kubernetes workloads may seem simple enough: you assign a CPU request and call it a day. But under the hood, the process for allocating CPU resources is a little more complicated. It involves CPU shares, the units that Kubernetes and Linux use to allocate actual CPU time to workloads. Understanding how this process works is important for optimizing CPU resource management within Kubernetes.
With that in mind, let's take a deep dive into CPU shares in Kubernetes, including how they work, how they impact workload performance, and best practices for managing them.
What are CPU shares in Kubernetes?
In Kubernetes, CPU shares are relative weights that determine how CPU time is divided among workloads when a node is busy.
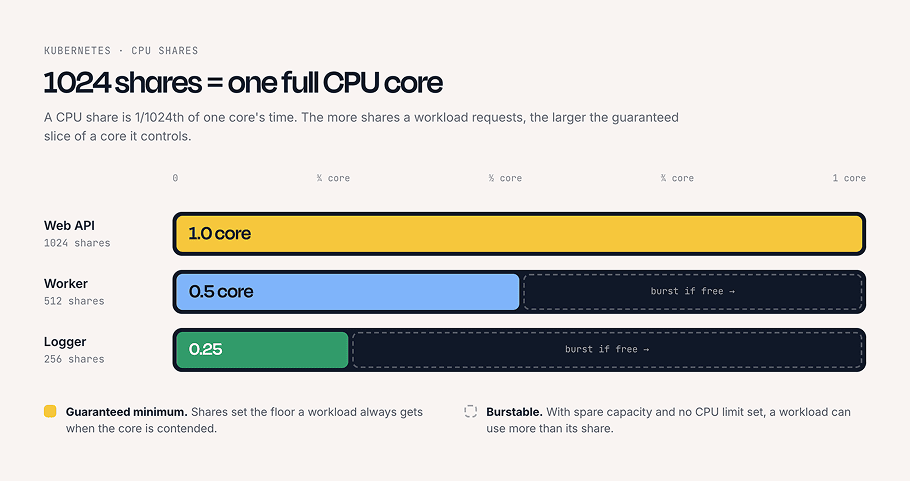
By convention, one full CPU core maps to 1024 shares. If you tell Kubernetes to assign one CPU core to a workload, the workload is given 1024 shares. The number 1024 is the historical default weight value in Linux, not a count of anything physical, so the practical meaning of a share is relative: a workload with twice as many shares as another gets twice the CPU time when the two compete for a saturated core.
Importantly, shares set a workload's priority under contention rather than a fixed allocation. Under contention they guarantee a proportional minimum, but when spare CPU is available, workloads can use more than their share as long as no CPU limits are in place.
CPU shares vs. CPU limits in Kubernetes
CPU shares govern a workload's proportional minimum under contention. This distinguishes them from CPU limits, which cap the maximum amount of CPU a workload can consume. Kubernetes doesn't express limits in terms of shares; it only uses shares to translate CPU requests into relative scheduling priority.
| Type of setting | Purpose | When to use |
|---|---|---|
| CPU shares | Set a workload's proportional CPU priority under contention (derived from its CPU request). | For any workload that needs a predictable level of CPU access under load. |
| CPU limits | Cap the maximum amount of CPU a workload can use. | For workloads that pose a "runaway" risk (they may consume CPU in large volumes). |
Why CPU shares matter for Kubernetes performance
CPU shares matter because they define, in granular terms, how CPU is prioritized among workloads competing for the same node. Since CPU is a critical factor in workload performance, a higher share generally translates to better performance under contention.
You can manage CPU allocation through CPU requests too. But a request is a more generic entity that doesn't directly express fractions of CPU time, which is why it's valuable to understand how Kubernetes translates requests into shares.
Of course, other resource settings, like memory requests and memory limits, can also affect performance. CPU shares are not the only possible cause of slow response times. But since most workloads struggle without enough CPU, shares play a key role in shaping overall performance.
How CPU shares work in Kubernetes
The process for managing CPU shares in Kubernetes works as follows.
1. CPU requests to shares conversion
First, Kubernetes examines the CPU requests assigned to workloads (if requests are defined), then converts them to CPU shares. The conversion is cpu.shares = milliCPU × 1024 / 1000, so one CPU core (1000m) maps to 1024 shares, and 100m maps to 102 shares.
2. Role of Linux cgroups and the CFS scheduler
After determining how many shares a workload should receive, Kubernetes enforces them using the cgroup and Completely Fair Scheduler (CFS) capabilities in the host node's Linux kernel. Cgroups are a Linux feature that manages resource allocation on a per-process-group basis, while CFS is responsible for CPU scheduling. Working together, they ensure a workload receives CPU time proportional to its assigned shares.
Default CPU shares behavior without requests
If there is no CPU request specified for a workload, Kubernetes defaults in most cases to assigning it a default CPU share of 1024, or one CPU core. However, this default CPU share is not a hard guarantee. In cases where CPU resources become constrained and CPU throttling takes place, Kubernetes will prioritize granting CPU shares to workloads that have explicit CPU requests configured over those that receive the default number of CPU shares.
CPU shares and Kubernetes scheduling behavior
Because a workload's shares derive from its CPU request, and free CPU capacity varies from node to node, scheduling plays a key role in placing a workload on a node that can accommodate its request.
Here’s a look at the details of this process.
Relationship between CPU requests and scheduling
When scheduling a new workload, Kubernetes examines the CPU requests of the workload and the CPU availability of nodes. It then schedules the workload on a node with enough unreserved CPU to satisfy the request. Note that the scheduler uses requests, not shares or limits, to make placement decisions.
How shares influence CPU allocation under contention
If contention exists, meaning the workloads on a node collectively want more CPU than is available, CFS divides CPU time proportionally to each workload's shares. A workload with 1024 shares won't necessarily get a full core, but it will receive roughly double the CPU time of one with 512 shares.
CPU bursting and idle resource reuse
When spare CPU capacity is available, workloads can "burst" beyond their request, consuming as much CPU as they want up to their CPU limit (if one is defined). This ensures CPU isn't wasted when some workloads aren't using their full allocation and others can put the spare time to use.
How CPU shares affect QoS classes and Pod performance
Kubernetes Quality of Service (QoS) configurations can affect the management of CPU shares – and, by extension, overall Pod performance – in nuanced ways. Here’s a look at the details.
Guaranteed vs. Burstable vs. BestEffort Pods
Pods can be assigned to three QoS classes, each of which receives CPU shares in different ways:
- Guaranteed Pods have CPU requests equal to limits, which results in the highest and most stable CPU shares because the scheduler treats them as fully committed resources and ensures strong CPU priority under contention.
- Burstable Pods have defined CPU requests that are lower than their limits (or only requests set), so they receive proportional CPU shares based on requests but can exceed them when capacity is available, making their performance more variable.
- BestEffort Pods have no CPU requests or limits, so they receive the lowest CPU shares and are the first to be throttled or starved when the node is under load.
Impact of node contention on CPU distribution
When a node experiences CPU contention (meaning, again, that not enough CPU time is available to meet all workloads’ needs), the Linux CFS scheduler distributes CPU time based on each Pod’s CPU shares, meaning Pods with higher requests (or Guaranteed QoS) get a larger portion of available CPU. As contention increases, BestEffort Pods lose CPU time first, followed by Burstable Pods if demand continues to rise, while Guaranteed Pods remain least affected.
Performance variability across workloads
CPU shares introduce variability because they only influence relative priority under contention, not absolute CPU guarantees. When nodes are lightly loaded, even BestEffort and Burstable Pods may perform similarly to Guaranteed Pods, but under heavy load, differences become pronounced, leading to inconsistent latency and throughput for lower-priority workloads.
CPU shares in Kubernetes with cgroup v1 vs. cgroup v2
Another nuance is that the two cgroup versions in modern Linux kernels handle CPU allocation differently. cgroup v1 is now in maintenance mode in Kubernetes (since v1.31), which means a feature freeze with continued security and major bug fixes rather than outright deprecation. Broader ecosystem support is winding down on its own timeline (systemd disabled cgroup v1 by default in v256 and removed it in v258), though runtimes like runc and containerd have committed to maintaining it until at least May 2029 to cover long-term-support enterprise distributions. cgroup v2 is the modern, default framework.
cgroup v1 implements a cpu.shares parameter, a relative weight. Kubernetes maps CPU requests to these shares, so a Pod with a higher request receives proportionally more CPU time when the node is busy, while still allowing bursting when idle capacity exists. CPU limits in cgroup v1 are enforced separately using CFS quotas (cpu.cfs_quota_us), which cap usage regardless of shares.
cgroup v2 replaces cpu.shares with cpu.weight (range 1 to 10000, default 100), but the underlying concept is the same: relative CPU prioritization during contention, now within a single unified hierarchy. One subtlety worth knowing is how requests translate into weight. Under the original conversion formula, a container requesting 1 CPU converted to a weight of only about 39, well below the cgroup default of 100. As of January 2026 an improved formula maps 1 CPU to a weight of about 102 (close to the default) and 100m to about 17. This change lives at the OCI runtime layer rather than in Kubernetes itself, so you get it only on runtimes that have adopted it (runc 1.3.2 and later, crun 1.23 and later).
You can check which cgroup version a node uses by running grep cgroup /proc/filesystems. If the output mentions cgroup2, cgroup v2 is in use. (The output may also list cgroup by itself alongside cgroup2.)
| Aspect | cgroup v1 (CPU shares in Kubernetes) | cgroup v2 (CPU shares in Kubernetes) |
|---|---|---|
| CPU share mechanism | Uses cpu.shares as a relative weight for CPU time allocation. | Uses cpu.weight as a unified weighting system for CPU distribution. |
| Kubernetes mapping | CPU requests are translated into cpu.shares values per container. | CPU requests are translated into cpu.weight values per cgroup. |
| Scheduling model | Hierarchical and split across multiple controllers (CPU, memory, etc.) | Unified hierarchy with a single consolidated control model. |
| Behavior under contention | CPU time is divided proportionally based on shares within CFS. | CPU time is divided proportionally based on weights with more consistent enforcement. |
| Kubernetes impact | Well-understood but can show edge-case inconsistencies in large clusters. | More predictable CPU fairness behavior across workloads and nodes. |
Monitoring and debugging CPU shares in Kubernetes
To monitor CPU shares, start by correlating Pod-level CPU requests with actual usage, using metrics from Metrics Server, Prometheus, or any observability stack that exposes container CPU time and throttling. Key signals to track include:
- CPU usage vs. CPU requests.
- CPU throttling (container_cpu_cfs_throttled_seconds_total in cgroup v1, or equivalent metrics in cgroup v2).
- Node-level CPU saturation.
If some Pods consistently use less CPU than requested while others are throttled, that can indicate imbalanced share allocation or node-level contention.
You can inspect QoS classes (Guaranteed, Burstable, BestEffort) with kubectl describe pod to understand expected share behavior. To debug at the node level, inspect the underlying cgroup configuration by checking cpu.shares (cgroup v1) or cpu.weight (cgroup v2). You can find this within /sys/fs/cgroup for specific Pod or container slices, which helps confirm whether Kubernetes is translating requests into kernel scheduling weights as expected.
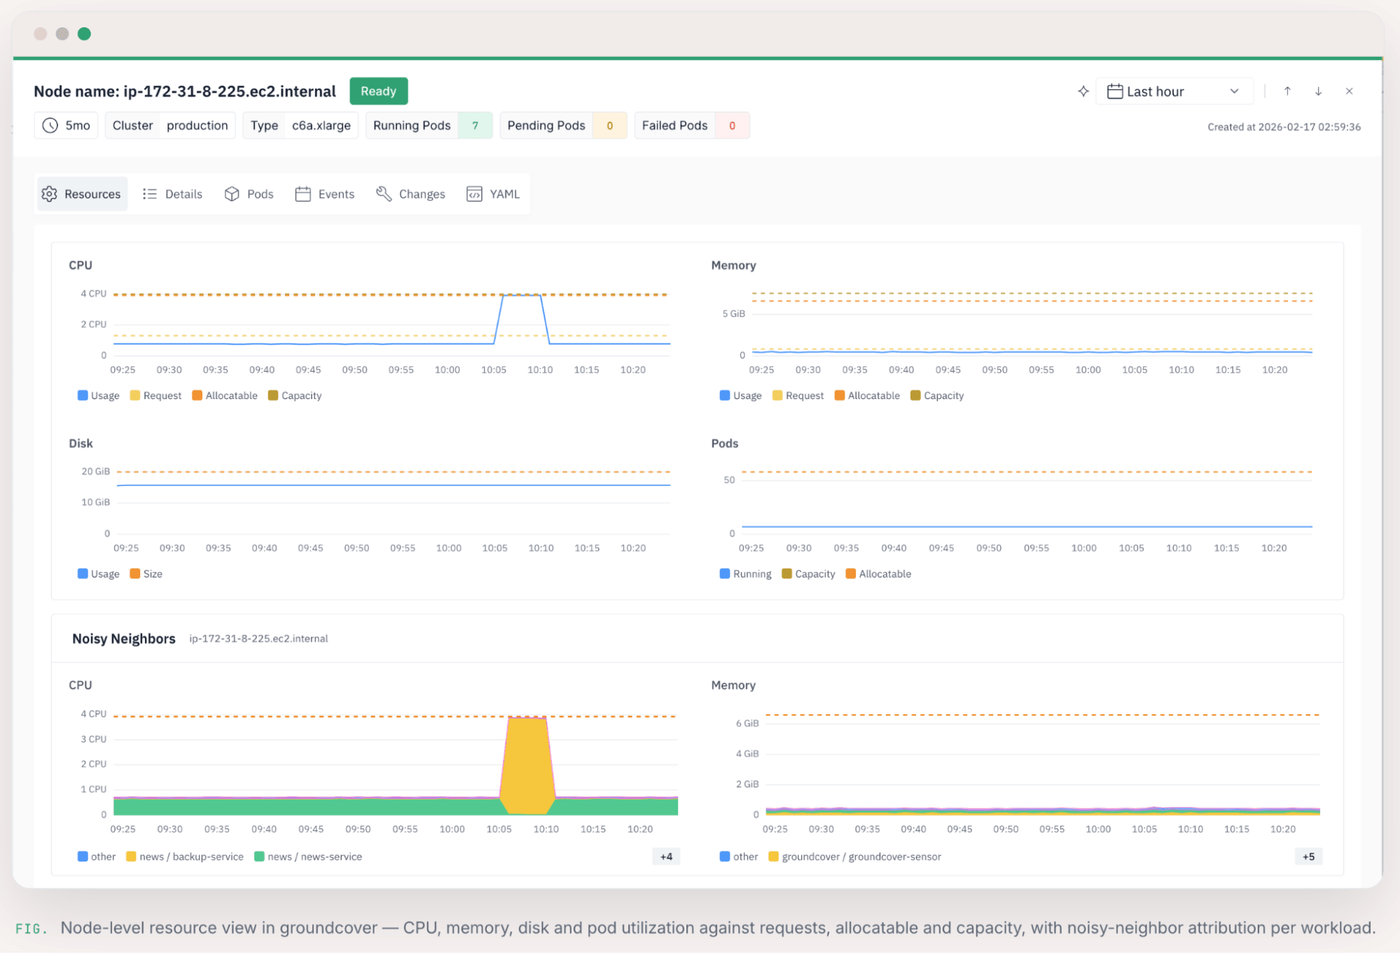
Combine this with kubectl top nodes and kubectl top pods to identify hotspots, then use node-level tools like pidstat, top, or perf to see which processes consume CPU under contention. If unexpected throttling or starvation occurs, validate that requests and limits are set correctly, check for "noisy neighbor" workloads on the same node, and verify whether the node is overcommitted relative to available CPU.
Common challenges and misconfigurations with CPU shares in Kubernetes
If you’re experiencing issues with CPU shares in Kubernetes, one of the following common challenges may be the root cause:
- Misconfigured or missing CPU requests: When CPU requests are not set, Pods default to BestEffort QoS, which gives them minimal CPU shares and makes their performance highly sensitive to node contention and unpredictable under load.
- Over-provisioned CPU requests: Setting CPU requests too high inflates a Pod’s CPU shares, which can starve other workloads on the same node and lead to inefficient cluster utilization and increased scheduling pressure.
- Confusion between CPU shares and CPU limits: As noted above, CPU shares influence relative scheduling priority, while limits enforce hard caps, but misinterpreting them often leads to over-throttling or unexpected performance drops when limits are set too aggressively.
- Noisy neighbor contention on shared nodes: Even with correct CPU requests, colocated workloads (i.e., ones running on the same node) can interfere with each other when nodes are oversubscribed. This may lead to uneven CPU distribution and latency spikes for lower-priority Pods.
Best practices for using CPU shares in Kubernetes
The following best practices can help to optimize the way Kubernetes manages CPU shares:
- Set CPU requests for all workloads: Defining CPU requests ensures every Pod receives appropriate CPU shares and avoids BestEffort scheduling, which helps maintain predictable performance under node contention.
- Align CPU requests with real workload usage: Base requests on observed CPU consumption rather than estimates to prevent over-allocation that wastes resources or under-allocation that leads to throttling and instability.
- Use limits carefully and intentionally: Apply CPU limits only when necessary to prevent runaway workloads. Overly tight limits can cause throttling and reduce performance even when spare CPU time is available.
- Separate workloads by priority and QoS class: Place latency-sensitive workloads in Guaranteed or well-sized Burstable classes while keeping batch or background jobs lower priority to reduce noisy neighbor impact.
- Continuously monitor CPU saturation and throttling: Track metrics like CPU usage vs requests, node load, and throttling events to identify imbalances early and adjust requests or scheduling policies proactively.
| Best practice | Description |
|---|---|
| Configure CPU requests for all Pods | Ensure every workload declares CPU requests so Kubernetes can assign fair CPU shares and avoid lowest-priority scheduling behavior under load. |
| Size requests based on real usage data | Use observed CPU consumption patterns rather than guesses to improve scheduling accuracy and reduce both waste and contention risk. |
| Apply CPU limits selectively | Use limits only when you need to constrain runaway workloads, since overly restrictive caps can introduce unnecessary throttling. |
| Group workloads by priority level | Run latency-sensitive services in higher-priority QoS classes while placing non-critical or batch workloads in lower-priority tiers to reduce interference. |
| Monitor CPU behavior continuously | Track CPU utilization, node saturation, and throttling signals to detect imbalance early and adjust resource settings as needed. |
eBPF-powered CPU visibility in Kubernetes with groundcover
Tracking how CPU time is actually being allocated within Kubernetes can be complex. Fortunately, groundcover makes it easy by automating the dirty work of continuously monitoring CPU usage and detecting issues like CPU throttling or workload performance degradations that result from insufficient CPU availability.
This means that – instead of spending your time running kubectl commands or checking CPU usage via basic interfaces like the top utility – you can enjoy the confidence that you’ll know quickly when CPU share issues arise in your Kubernetes cluster, and that you’ll have the context to troubleshoot them effectively.
And, since groundover uses the hyper-efficient eBPF framework to collect observability data, you don’t have to worry that your observability solution will suck up CPU time, leaving fewer shares for your actual workloads. Instead, groundcover couples deep visibility with high efficiency – a combination that traditional observability solutions lack.
Taking good care of CPU shares
CPU shares might seem like a technical abstraction, but they’re actually a key part of the way Kubernetes assigns one of the most important types of resources – CPU time – to workloads. The more Kubernetes admins understand how CPU shares work, the better positioned they are to ensure that workloads perform as required while making efficient use of CPU resources.
FAQs
During contention, workloads with higher shares receive priority for CPU time, so they tend to perform better than workloads that can't access all the CPU they need. Shares only matter under contention; on a lightly loaded node, lower-priority workloads can still perform well.
In general, it's best to avoid CPU limits, since they prevent workloads from using spare CPU when it's available. That said, limits are a good idea for workloads that risk consuming very large amounts of CPU and depriving others.
It lands in the BestEffort QoS class and is assigned the minimum share weight, giving it the lowest priority under contention. It is not given a full core's worth of shares, and it's the first to be throttled or starved when the node is busy.
groundcover continuously monitors the state of all resources across a cluster, so it can detect node CPU contention and throttling. It also identifies performance degradations (like increases in response time) that may reflect CPU availability issues. Together, this gives admins the context they need to detect and troubleshoot CPU allocation problems.