Memory Allocation Failed: Causes, Fixes & Monitoring in Kubernetes


Key Takeaways
- A “memory allocation failed” error doesn’t necessarily mean you’re out of memory, it usually means memory couldn’t be allocated in the way the application requested due to limits, fragmentation, or constraints.
- It differs from OOMKilled: allocation failures happen earlier at the application level, while OOMKilled is the kernel forcibly terminating a container after limits are exceeded.
- The root cause is often a mix of factors like tight container limits, memory leaks, fragmentation, node pressure, or misconfigured quotas, not a single issue.
- Early warning signs like rising memory usage, allocation retries, and increased page faults can help catch problems before crashes or restarts occur.
- Preventing these errors requires right-sizing resources, allowing headroom, monitoring key metrics, and improving application memory behavior, not just adding more memory.
Memory resource management in distributed systems is becoming increasingly complex as enterprises adopt Kubernetes. Production workloads are running on Kubernetes in more than 80% of organizations, according to the Cloud Native Computing Foundation (2024–2025), but resource - especially memory - failures continue to be a leading cause.
This error is one of the most frequently encountered and misunderstood. It can sound straightforward, but it often stems from deeper issues in Kubernetes memory management, container limits, and application behavior.
This guide breaks down the real meaning behind the error, digs into root causes, walks through how to debug it, and covers what you can put in place to prevent it.
What Is a “Memory Allocation Failed” Error in Kubernetes?
A "memory allocation failed" error sounds self-explanatory - the app needs memory, the system says no. But here's what makes it frustrating: this failure can happen even when the node still has available memory. That's usually the moment engineers start second-guessing their monitoring setup. At a deeper level, memory allocation failures can originate from:
- Application runtime (e.g., JVM, Go runtime, Python memory manager)
- Container runtime enforcing limits
- Kubernetes scheduling constraints
- Linux kernel memory fragmentation or pressure
So "memory allocation failed" doesn't automatically mean you've run out of memory. More often, it means memory couldn't be allocated in the way the application needed it - whether that's because of a hard container limit, fragmented heap space, or not enough allocatable memory on the node. The distinction matters a lot when you're trying to track down the actual cause.
“Memory Allocation Failed” vs. OOMKilled: Key Differences
Although often used interchangeably, these two represent fundamentally different failure modes:
In short, allocation failure happens earlier, while OOMKilled is the final enforcement step.

Common Causes of “Memory Allocation Failed” Errors
To effectively resolve memory allocation issues, it’s important to understand that they rarely have a single cause. Instead, they usually arise from a combination of infrastructure constraints and application behavior:
1. Insufficient Allocatable Memory
Kubernetes nodes reserve a portion of memory for system processes such as the kubelet and OS services. This means the memory available for pods, known as allocatable memory, is always less than total capacity. As a result, a pod may fail to allocate memory even when monitoring tools show available memory at the node level.
2. Strict Memory Limits
Containers operate within defined resource limits, and once those limits are reached, further allocation requests fail immediately.
In this configuration, there is no buffer for memory spikes, making allocation failures highly likely under fluctuating workloads.
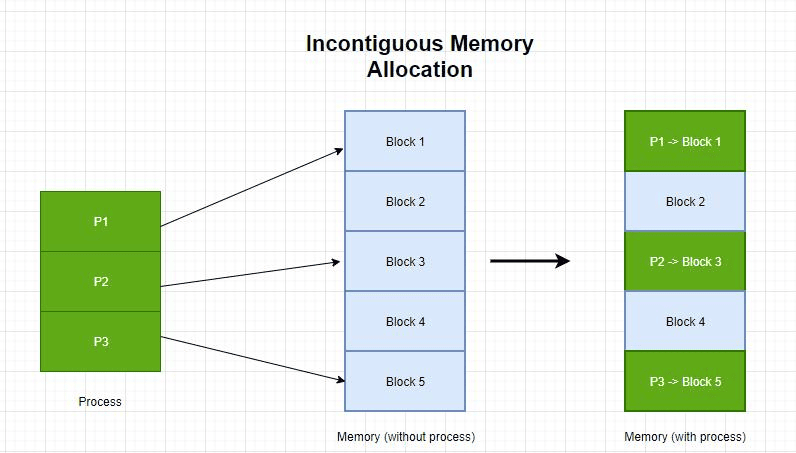
3. Memory Fragmentation
Memory fragmentation happens when free memory exists but is split into small, non-contiguous blocks. Large allocation requests (e.g., heap expansion or large contiguous allocations) may fail due to fragmentation or allocator constraints.
4. Memory Leaks
Memory leaks are a slow burn. Unreleased objects pile up over time, quietly consuming more and more memory until there's not enough left to satisfy new allocation requests - often well before the container hits its hard limit.
5. Overcommitment and Node Pressure
Kubernetes schedules based on requests, not actual usage, which can lead to overcommitment when real memory consumption exceeds requested values. During traffic spikes, this can result in:
- Memory pressure
- Allocation failures
- Pod evictions
6. Misconfigured Resource Quotas
ResourceQuotas cap the total memory a namespace can consume, covering requests, and optionally limits. When those caps are set too low or haven't kept up with actual workload growth, the API server starts rejecting new pods at admission time, even if the rest of the cluster has plenty of free memory. It ends up looking like a resource problem when it's really just a misconfigured quota.
If the quota is exceeded, new allocations fail, even if cluster capacity exists.

How Kubernetes Handles Memory Requests, Limits, and OOM Events
To really understand why these errors happen, you need to know how Kubernetes actually manages memory under the hood - specifically how requests, limits, and kernel-level enforcement work together:
Memory Requests
Memory requests define the minimum guaranteed memory required by a container. The Kubernetes scheduler uses this value to determine which node has enough allocatable memory to run the pod. Once scheduled, this amount is reserved for the container.
Memory Limits
Memory limits define the maximum memory a container is allowed to use. These limits are enforced by the Linux kernel using cgroups. If a container attempts to exceed this limit, memory allocation requests may fail, and sustained overuse can eventually trigger an OOM event.
OOM Behavior
When memory usage exceeds limits:
- The container may first experience allocation failures
- If usage continues → the kernel triggers the OOM killer
- Kubernetes marks the pod as OOMKilled
Memory Allocation Flow
Understanding the sequence of how memory is allocated in Kubernetes helps explain why “memory allocation failed” errors often occur before visible crashes or restarts.
- Scheduler places the pod based on memory requests
- Container starts and runs within defined memory limits
- Application requests additional memory at runtime
- If the request exceeds the container limit → allocation fails immediately
- If overall system memory is exhausted → the kernel triggers an OOM kill
This layered enforcement model means allocation failures can surface early at the application level, even before Kubernetes intervenes with pod termination.
How to Detect Early Warning Signs of Memory Allocation Failures
Memory allocation failures rarely occur without warning. By monitoring the right memory metrics, teams can detect issues early and prevent outages.
Key Warning Signs
Memory allocation failures are rarely instantaneous. They are usually preceded by observable signals at both the application and infrastructure levels. Identifying these early can help prevent crashes and downtime:
- Gradual Increase in Memory Utilization: Indicates growing workload or potential memory leaks
- Frequent Allocation Retries in Logs: Suggests the application is struggling to allocate memory
- Rising Page Faults: Signals increased memory pressure or inefficient memory access
- Increased Pod Restarts: Often a symptom of memory exhaustion or instability
Important Metrics to Monitor
Tracking the right memory metrics provides visibility into usage patterns and helps detect allocation issues before they escalate.
Tools like Prometheus and Grafana are commonly used to visualize these metrics.
Step-by-Step Troubleshooting for “Memory Allocation Failed” Errors
Troubleshooting memory issues in Kubernetes requires a structured approach that combines Kubernetes diagnostics with application-level insights.
1. Check Pod Status, Events, and OOM Signals
The first step is to inspect the pod’s current state and recent events. Kubernetes often provides early clues about memory pressure or allocation failures.
Look for:
- Warning events
- Restart counts
- OOMKilled signals
2. Monitor Container and Node Memory Usage
Next, evaluate real-time resource consumption to understand whether the issue is local (container) or systemic (node).
This helps identify whether the failure is due to memory limits or node pressure.
3. Inspect Application Logs and Stack Traces
Application logs often provide the most direct evidence of allocation failures.
Examples:
These messages indicate that the application itself cannot allocate memory within the given constraints.
4. Evaluate Resource Quotas and Limit Ranges
Finally, review namespace-level restrictions that might be blocking allocations.
These configurations are often overlooked but can significantly impact resource allocation behavior.

Solutions to Prevent “Memory Allocation Failed” Errors
Preventing memory allocation failures requires a combination of better configuration, smarter scaling, and application optimization.
Adjust Memory Requests and Limits Strategically
Instead of setting equal requests and limits, provide a buffer for spikes:
This ensures stability during peak usage.
Optimize Application Memory Usage and Fix Leaks
Improving application efficiency is one of the most impactful steps. Techniques include:
- Heap profiling
- Garbage collection tuning
- Using efficient data structures
Manage Node Capacity and Reduce Memory Pressure
Cluster-level improvements can significantly reduce allocation failures:
- Increase node size or count
- Avoid overpacking pods
- Reserve adequate system memory
Implement Autoscaling and Right-Sizing Strategies
Autoscaling allows Kubernetes to dynamically adjust to workload demands.
- Horizontal Pod Autoscaler (HPA) for scaling pods
- Vertical Pod Autoscaler (VPA) for adjusting resource limits
These ensure that applications always have sufficient memory resources.
Best Practices to Avoid Recurring “Memory Allocation Failed” Issues
Preventing recurring “memory allocation failed” errors requires a proactive approach that combines proper resource configuration, continuous monitoring, and application optimization. By following a few key best practices, teams can significantly reduce memory-related instability in Kubernetes environments:
Adopting these practices ensures long-term stability and efficient memory utilization.
Real-Time Detection and Root Cause Analysis of Memory Allocation Failures with groundcover
While Kubernetes provides visibility into memory usage through metrics and events, it often falls short in explaining why a memory allocation fails. Traditional observability stacks, built on metrics, logs, and traces, are effective at identifying symptoms like rising memory usage or OOMKills, but they rarely expose this level of detail without complex correlation or instrumentation.
Memory allocation failures frequently originate below the Kubernetes layer, inside the Linux kernel or application runtime. This includes issues such as memory fragmentation, reclaim pressure, inefficient allocation patterns, or strict cgroup enforcement. Without visibility into these layers, teams are left correlating signals across multiple tools, which slows down root cause analysis.
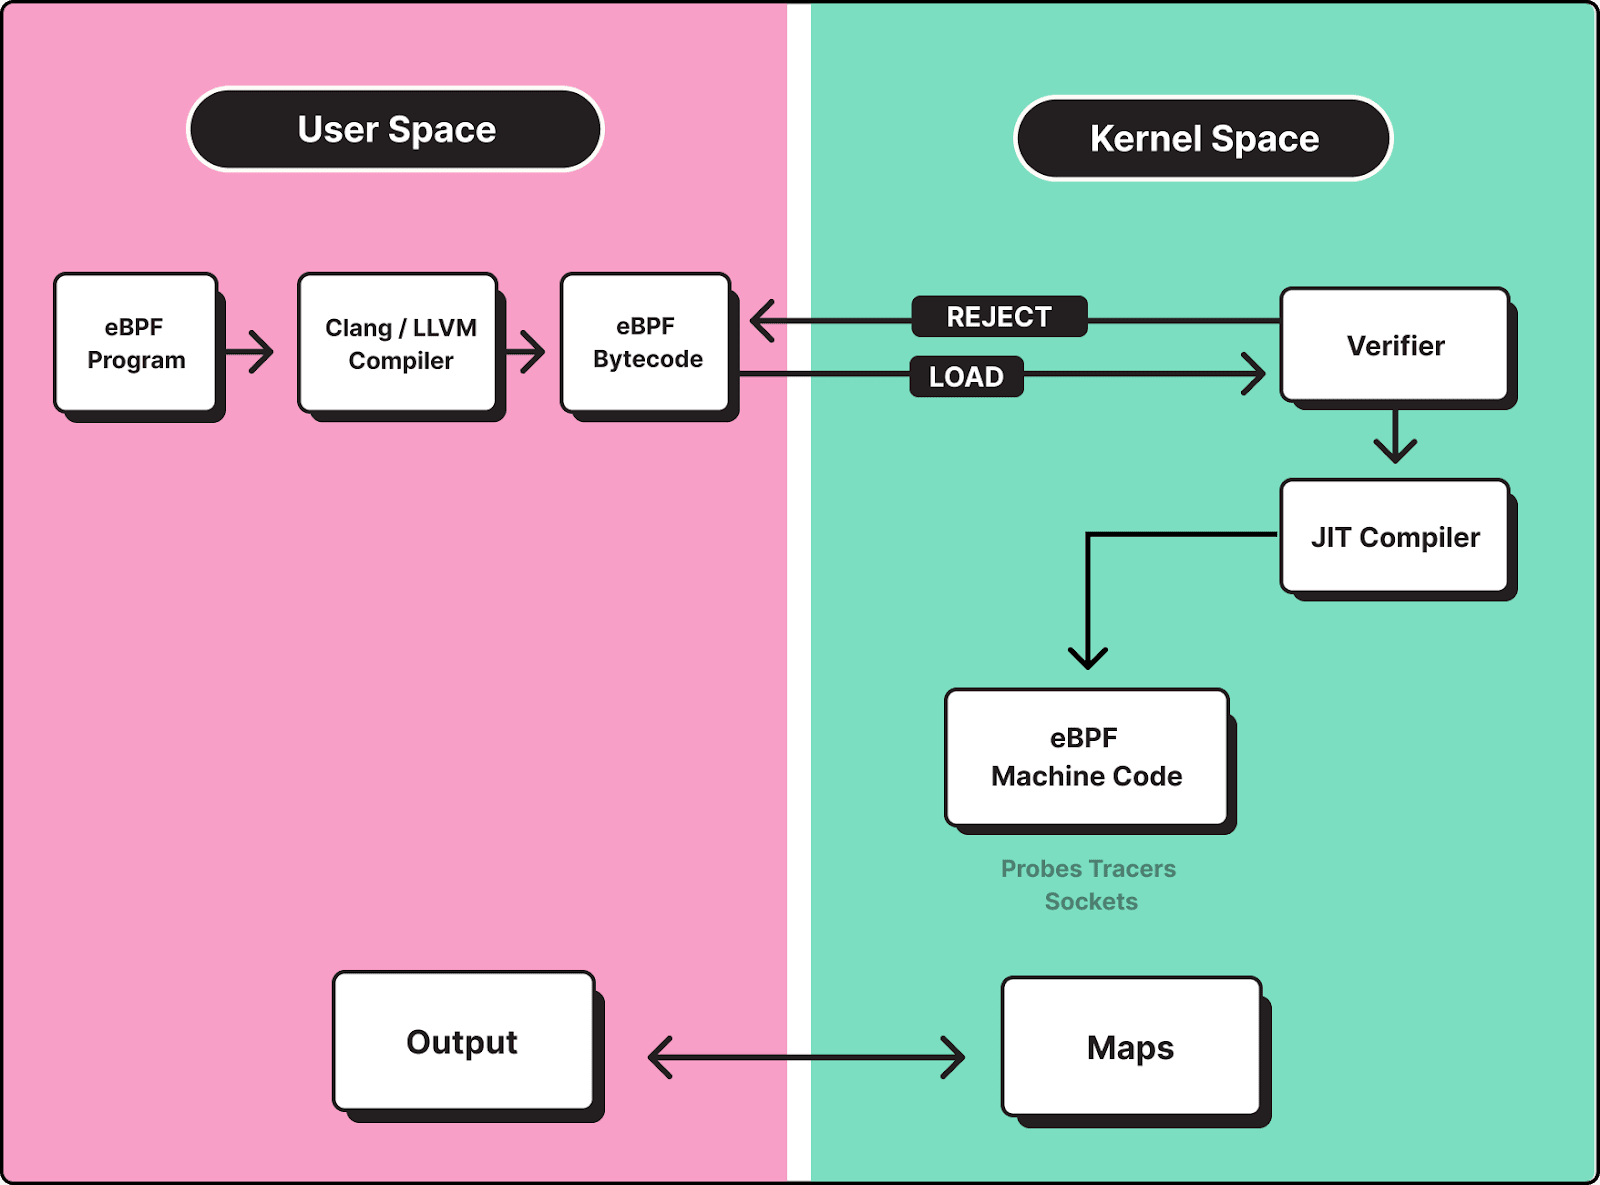
groundcover addresses this gap by using eBPF to capture telemetry directly from the Linux kernel, enabling real-time visibility into how memory is allocated, requested, and reclaimed across containers, without requiring code instrumentation or sidecars.
Deep Memory Visibility at Allocation Time
Instead of relying solely on aggregate metrics, groundcover provides insight into memory behavior at the point of allocation. This allows teams to observe:
- Allocation latency and failure patterns
- Memory reclaim activity and pressure signals
- Differences between requested memory and actual allocation outcomes
- Runtime-specific behaviors (e.g., JVM heap expansion, Go GC cycles)
This level of visibility helps distinguish between:
- True memory exhaustion
- Allocation failure due to limits
- Fragmentation or reclaim-related delays
Correlating Kernel Signals with Application Behavior
One of the key challenges in debugging memory issues is connecting low-level system signals with application-level failures. groundcover unifies metrics, logs, and traces into a single correlated view:
- Kernel-level telemetry (via eBPF)
- Container and node-level metrics
- Application logs and traces
This makes it possible to trace a failure end-to-end. For example: A service logs runtime: out of memory, while node-level metrics show available memory. groundcover reveals that the container hit its cgroup limit during a burst of allocation requests, triggering allocation failures before an OOMKill event. By correlating these signals, teams can quickly determine whether the issue is:
- Misconfigured memory limits
- Sudden workload spikes
- Inefficient memory usage or leaks
- Node-level memory pressure affecting multiple pods
Detecting Early Signals Before Failures Occur
Memory allocation failures are rarely instantaneous; they are typically preceded by subtle system-level signals. groundcover enables proactive detection by identifying:
- Spikes in allocation latency
- Increased memory reclaim activity
- Gradual degradation in allocation success rates
- Abnormal allocation patterns across services
This allows teams to act before failures escalate into application crashes or widespread instability.
Example: Debugging a Real Allocation Failure Scenario
Consider a Java-based service experiencing intermittent OutOfMemoryError despite moderate memory usage at the node level. Traditional monitoring might show:
- Stable container memory usage
- No immediate OOMKill events
However, groundcover reveals:
- Frequent large heap expansion attempts
- Increased allocation latency during peak traffic
- Memory reclaim spikes at the kernel level
This indicates that the issue is not total memory exhaustion, but allocation failure due to limit constraints and memory pressure, preventing the JVM from allocating the required memory within its limits. With this insight, teams can:
- Adjust memory limits to allow headroom
- Tune heap sizing and garbage collection
- Redistribute workloads to reduce node pressure
Conclusion
“Memory allocation failed” errors are often misunderstood because they don’t simply indicate a lack of memory. Instead, they highlight deeper challenges in resource allocation, system constraints, and application design.
By understanding how Kubernetes manages memory, monitoring key metrics, and applying best practices, teams can significantly reduce the risk of allocation failures. When combined with modern observability platforms like groundcover, diagnosing and resolving these issues becomes faster and more efficient.


.svg)