AI Agent Evaluation Metrics: How to Measure AI Agent Performance




Key Takeaways
- Healthy infrastructure doesn't mean an AI agent is working correctly. Agents can make costly mistakes, such as refunding the wrong order, even when systems show no errors.
- AI agent evaluation needs to measure more than final answers. Tracking task success, tool usage, execution steps, and safety helps reveal problems that traditional monitoring misses.
- Reliability, speed, and cost all matter. Measuring consistency across repeated tasks, response times, and cost per successful task helps teams understand real-world performance.
- Evaluation metrics alone can't explain why an agent failed. Connecting failed evaluations to production traces helps teams identify the underlying cause and fix issues faster.
It is 9:40 on a Tuesday morning, and a support agent at an online retailer has just refunded the wrong order. Again. The dashboard looks healthy: uptime is 99.9%, median latency is under two seconds, and the error log is empty. Meanwhile, three customers have received refunds for items they never returned, and only finance noticed.
Nothing crashed. The agent called the refund tool with a valid schema, received a 200 response, and told the customer everything was resolved. Infrastructure monitoring could not see that the order ID was wrong, because the failure lived in the agent's reasoning, not in the servers.
That gap is getting costly. LangChain's State of Agent Engineering survey found that 57% of respondents now run agents in production, and 32% named quality as their top barrier, ahead of cost and latency. Catching quality failures like the refund bug is exactly what AI agent evaluation metrics are for. This guide covers the metrics worth tracking, how to choose among them, where they fall short, and how to trace a bad score back to its cause.
Why AI Agent Evaluation Metrics Differ From Standard LLM Metrics
Standard LLM metrics grade one response to one prompt. Agents do something different: they plan, call tools, read results, and decide what to do next across many steps.
A research study titled Measuring Agents in Production, based on 306 practitioners and 20 case studies, found that 74% of surveyed production agents depend primarily on human evaluation, and the authors tie this to how hard real-world agent tasks are to verify automatically, with feedback often arriving late. Three differences explain why agents are harder to evaluate:
- The unit of work is a run, not a response. A fluent final answer can hide a wrong tool call three steps earlier.
- Side effects matter. Agents change databases, send emails, and issue refunds, so correctness depends on end state, not wording.
- Variance is built in. The same input can take a different path on every run.
Because of this, AI agent evaluation metrics have to cover four layers: outcomes, trajectories, operations, and safety.
4 Key Metrics That Define AI Agent Success
Outcome metrics answer the first question every stakeholder asks: did the agent do its job? They are the foundation of any approach to evaluating AI agents, and the table below summarizes them.
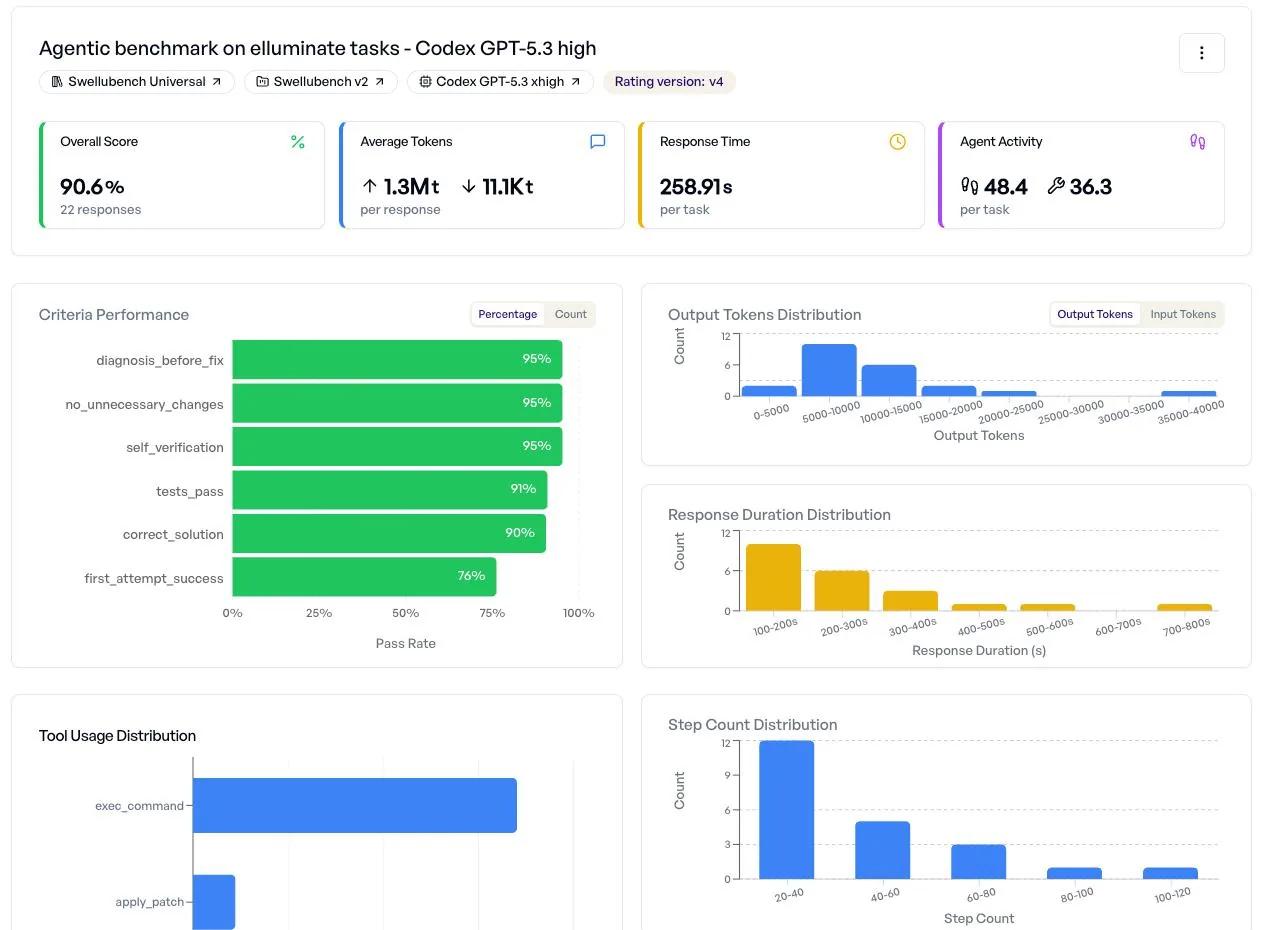
Source | AI Agent Evaluation Dashboard
Goal Success Rate: Did the Agent Reach the Final Objective?
Goal success rate is the share of runs where the agent achieved what the user actually wanted. Define success from the user's perspective, such as "refund issued for the correct order," rather than "agent returned a message." A binary pass or fail per run, aggregated over a representative test set, keeps this metric honest and easy to trend.
Task Completion Accuracy: Does the Output Match the Intended End State?
Where goal success is binary, task completion accuracy is graded. It compares the final output and resulting system state against a reference, field by field. If an agent books a flight with the right date but the wrong passenger, goal success fails, yet completion accuracy shows you which part broke. Checking database state, rather than the chat transcript, gives the most reliable signal.
Consistency: How Stable Is Success Across Repeated Identical Runs?
An agent that succeeds once is not necessarily reliable. The tau-bench benchmark introduced pass^k, the probability that an agent solves the same task in all k trials. Even strong function-calling agents that scored around 61% on single trials fell below 25% at pass^8 in the retail domain. For customer-facing work, pass^k tells you far more than a single average.
Hallucination and Faithfulness Rate: Is Each Step Grounded in Context?
Agents hallucinate in places chatbots never do: invented order IDs, made-up tool outputs, or claims unsupported by retrieved documents. Measure faithfulness per step by checking whether each claim and each tool argument traces back to the conversation, retrieved context, or a prior tool result. An LLM judge can score this at scale, with human review on a sample to keep the judge calibrated.
Tool Use and Trajectory Metrics Every AI Agent Evaluation Should Cover
A correct final output can still come from a sloppy path. Trajectory metrics examine how the agent got there, which matters because wasteful or risky paths become incidents later. These metrics depend on structured records of every step, which is where production traces come in.
Tool-Call Precision: Correct Calls vs. Total Calls Made
Tool-call precision is the number of correct tool calls divided by all tool calls made. Low precision signals an agent that guesses, retries blindly, or reaches for tools it does not need.
Argument Accuracy: Right Tool, Right Parameters, Right Slots
Choosing the right tool is only half the job. Argument accuracy checks that each parameter is filled correctly. The refund bug from the introduction was an argument failure: right tool, wrong order_id. Score arguments slot by slot so you can see which fields fail most often.
Trajectory Accuracy: Does the Execution Sequence Match the Expected Order?
Some workflows have mandatory ordering. An agent must verify identity before issuing a refund, for instance. Trajectory accuracy compares the observed sequence of tool calls to a reference path, using exact match for strict flows or in-order match for flexible ones.
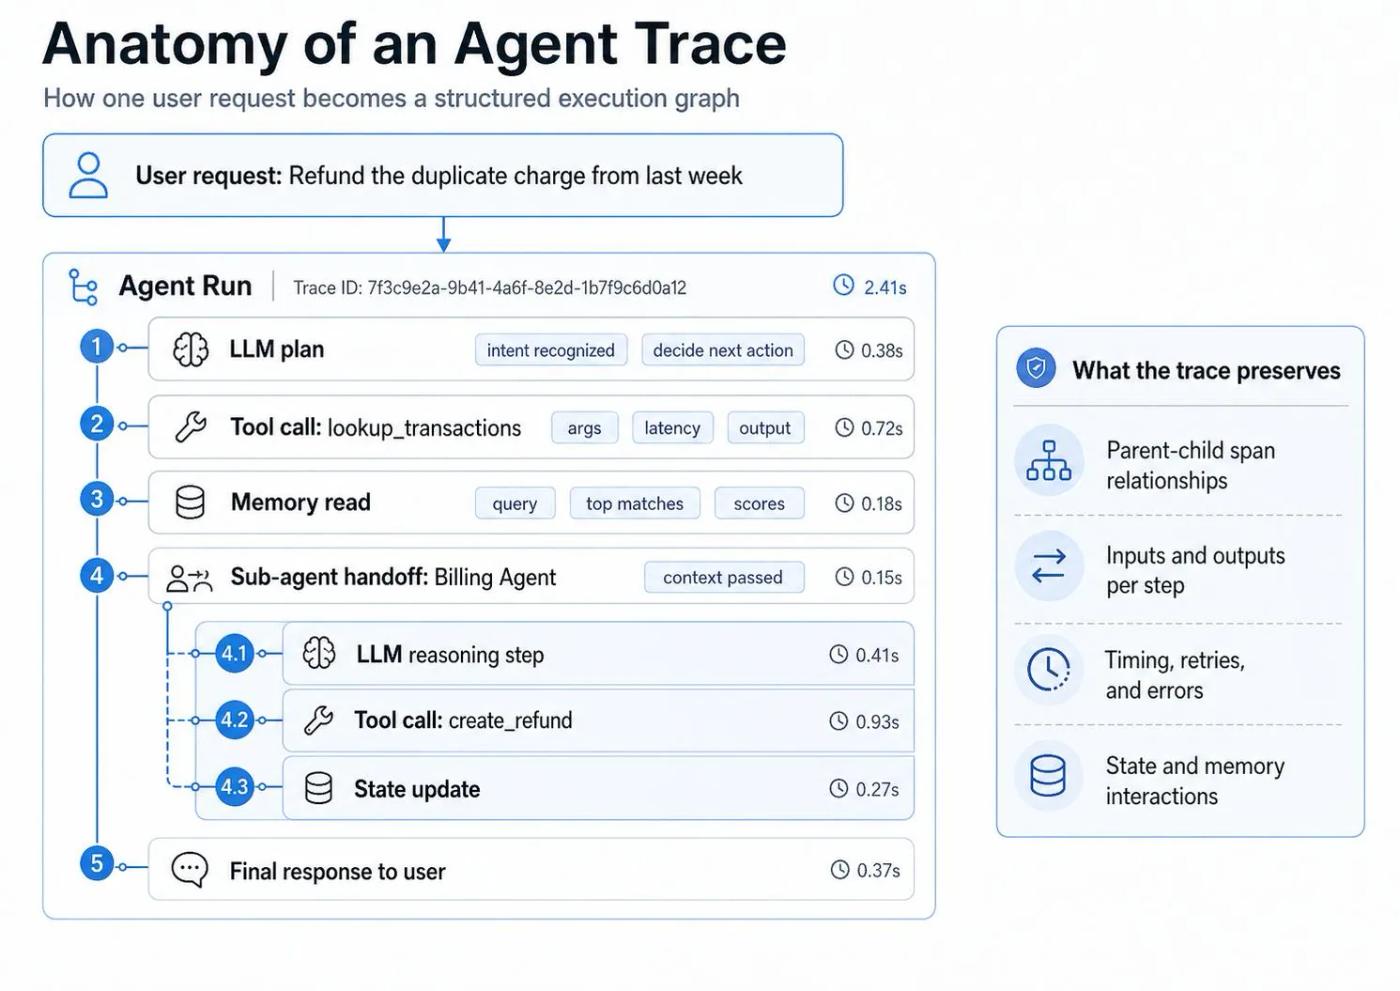
Source | AI Agent Execution Trace
Step Efficiency: How Many Steps Did It Take vs. the Minimum Required?
Step efficiency is the minimum steps required divided by the steps taken. A score of 1.0 means the agent took the shortest path. Lower scores reveal loops and redundant lookups that inflate latency and cost.
The snippet below computes these metrics from a recorded run. It is a simplified reference implementation: it matches calls one-to-one so retries are not double-counted, scores arguments slot by slot, and assumes you have a reference trajectory for each task.
Performance and Cost Metrics for AI Agents in Production
Accuracy means little if the agent is too slow or too expensive to run. Operational metrics keep agent performance sustainable at scale and tie quality to budget.
Latency at p50, p95, and p99: Catching Tail Delays That Harm Trust
Averages hide pain. Suppose an agent shows a p50 of 1.8 seconds, a p95 of 6.4 seconds, and a p99 of 14.2 seconds. Most users are happy, but one in twenty waits over six seconds and may abandon the session. Track percentiles per workflow.
Token Usage: How Input and Output Costs Compound Across Multi-Turn Sessions
Multi-turn agents resend history on every call, so input tokens grow faster than the conversation does. If each of ten turns adds 500 new tokens, the agent adds 5,000 tokens of new content but processes about 27,500 input tokens in total, since turn n resends everything before it. Output tokens usually cost more per unit, so watch both sides.
Cost Per Task: The Full Computational Expense of One Successful Completion
Cost per task divides total spend by successful completions, not attempts. Imagine 1,000 runs costing $63, with 700 successes. Cost per attempt is $0.063, but cost per successful task is $0.09. Failed runs and retries are part of the real price, so this metric links quality directly to budget.
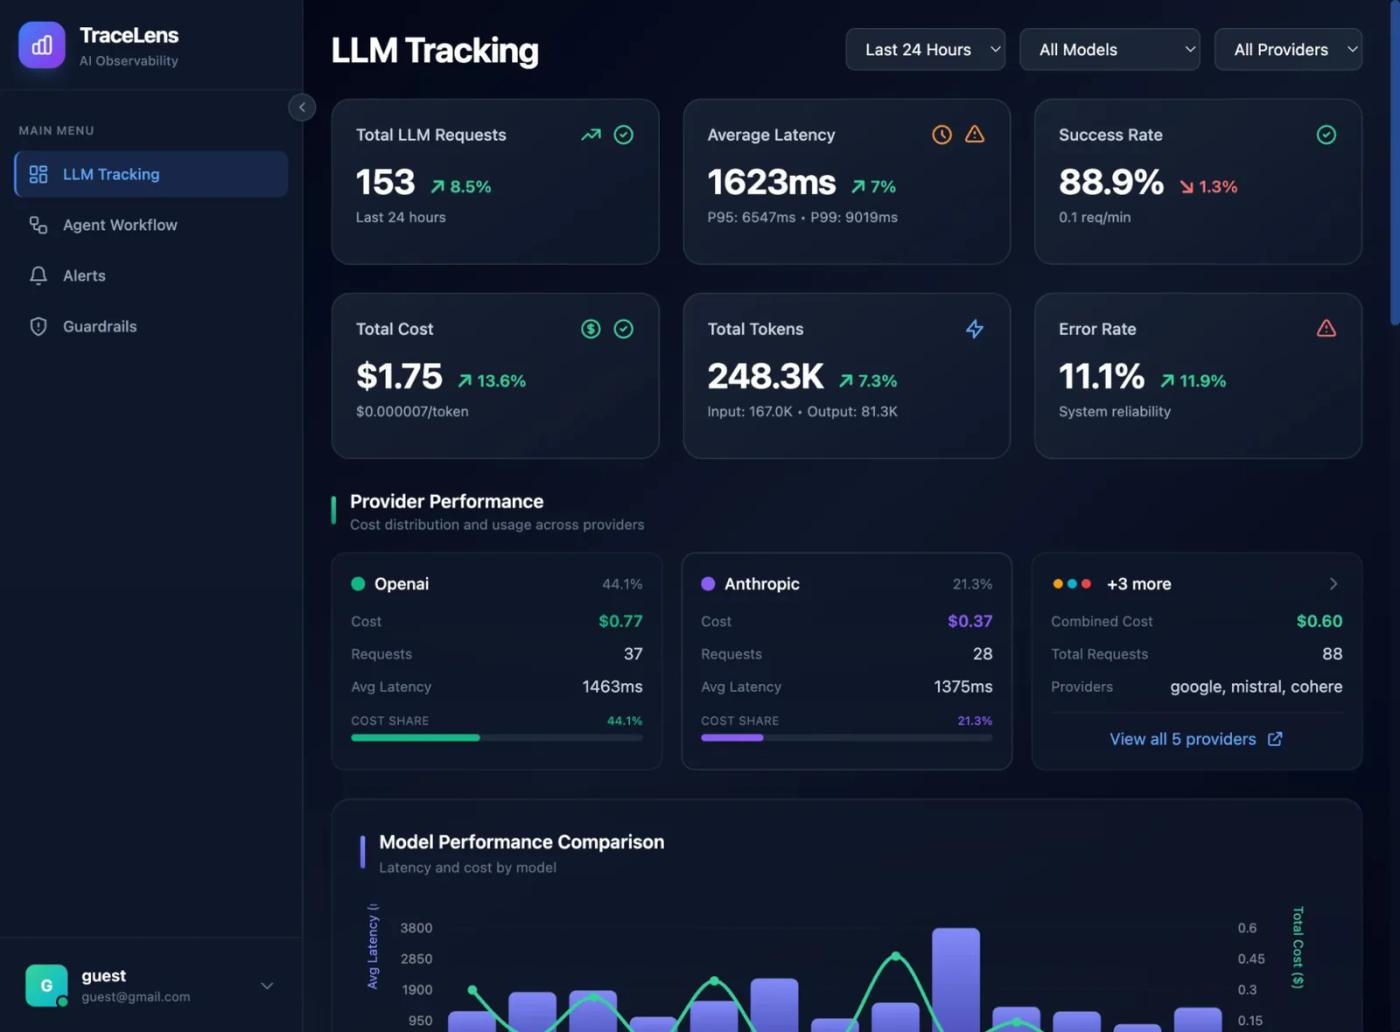
Source | LLM Performance Monitoring
Safety and Governance Metrics AI Agent Evaluation Cannot Skip
An agent with real permissions needs guardrails you can measure. The table below shows the core safety metrics.
Policy Adherence Rate: Does the Agent Stay Within Permitted Boundaries?
Policy adherence rate is the share of runs where every action respected business rules. Encode each rule as an automated check against the trace, then report violations per rule so you know which policies the agent bends most often.
Prompt Injection Resistance: How the Agent Handles Adversarial Inputs
Prompt injection holds the top spot in the OWASP Top 10 for LLM Applications because models struggle to separate instructions from data. Build a red-team set of direct attacks and indirect ones hidden in documents or tool outputs, then track the attack success rate, the percentage of attempts that change the agent’s behavior. Keep part of the set held out, refresh it regularly, and rerun it after every prompt, tool, or model change.
Unauthorized Action Rate: PII Leaks, Restricted Access, and Unapproved Tool Use
This metric counts runs where the agent exposed personal data, touched a restricted resource, or invoked a tool outside its allowlist. The target is zero, so treat any occurrence as an incident rather than a data point.
How to Select the Right AI Agent Evaluation Metrics for Your Use Case
No team needs every metric on day one. Start from the risk profile of the agent, then add measures as it matures:
- Name the failure that would hurt most. Wrong refunds call for argument accuracy and policy adherence. Slow answers call for latency percentiles.
- Pick one outcome metric. Goal success rate is usually the right anchor.
- Add two or three diagnostic metrics. Tool-call precision and step efficiency explain why the anchor moves.
- Add safety checks proportional to permissions. Agents that write data need stricter checks than read-only ones.
- Set thresholds and owners. A metric without an alert threshold and a named owner rarely changes anything.
Beyond the Score: What AI Agent Evaluation Metrics Can Miss
Scores compress behavior into numbers, and compression always loses some detail along the way. Knowing the blind spots keeps you from trusting a green dashboard too much.
The Habits That Separate Good AI Agent Metric Tracking From Great
Teams that get lasting value from evaluation measures treat them as a living system, not a one-time launch checklist that gets filed away after release:
- Evaluate offline and online. Run regression suites before release, then score live traffic continuously.
- Turn failures into test cases. Every production incident should become a permanent regression case.
- Sample for human review. Even a small weekly sample catches problems that automated scores miss.
- Close the loop. A continuous improvement loop connects production traces to new evaluation data, fixes, and re-measurement.
From Metric to Root Cause: Investigating AI Agent Evaluation Failures With groundcover
A metric tells you something is wrong, but not where. Scoring happens in your evaluation pipeline, whether that is state checks, an LLM judge, or human review. Debugging a low score needs a different kind of data: the actual request, its latency, its token usage, and everything that happened around it. That is where telemetry matters.
groundcover captures LLM API calls and application behavior using eBPF, so you can move from a failing score to the exact request without SDKs or code changes. Here is how it helps:
- Operational metrics, directly. groundcover AI Observability records prompts, responses, latency, throughput, and errors for LLM calls. That covers latency, throughput, and error rates without extra code.
- Cost inputs. Token metrics are broken down by workload and follow OpenTelemetry GenAI conventions. Combine them with success labels to get cost per successful task.
- Root-cause context. Traces show the logs, Kubernetes events, and CPU and memory usage around each LLM call, and ingested OpenTelemetry traces display as full distributed traces. When your eval flags a wrong tool call or a failed run, open the matching trace and see whether the cause was a slow dependency, a malformed upstream response, or a prompt change.
For agent reasoning chains and tool executions, add an OpenTelemetry GenAI SDK, which groundcover ingests alongside the eBPF data. Semantic checks, such as whether an order_id was correct or a claim was grounded, still come from your scoring layer. The two work together: evaluation tells you which runs failed, and telemetry shows you why.
Because groundcover runs in a bring-your-own-cloud model, captured payloads stay in your environment, which helps when traces contain PII. By default, groundcover does not obfuscate LLM payloads, so turn on obfuscation for prompts or responses that contain sensitive data. Sign-up is self-service, and you can start free at app.groundcover.com. Point it at an agent workload and see the traces for yourself.
Conclusion
Healthy infrastructure does not guarantee a healthy agent. Effective AI agent evaluation metrics span outcomes, tool use and trajectories, cost and latency, and safety, and they work best when chosen for your specific risks rather than copied from a list. Watch their blind spots, keep humans in the loop, and tie every score back to production traces. Do that, and the next wrong refund becomes a regression test instead of a surprise.
FAQs
A reliable AI agent evaluation dataset combines realistic user requests, verified expected outcomes, and challenging edge cases to measure how agents behave under production-like conditions.
- Start with real workflows: Extract representative tasks from production interactions, anonymize sensitive information, and define the expected system state for each scenario.
- Include failure scenarios: Test ambiguous instructions, missing context, unavailable tools, conflicting information, and requests requiring multiple dependent actions.
- Prevent evaluation drift: Version datasets alongside prompts and models, maintain a fixed regression benchmark, and periodically introduce new cases from production failures.
Learn more about AI agent observability.
AI agents should undergo automated evaluation after every significant change and continuous production monitoring to detect performance degradation, behavioral drift, and emerging failure patterns.
- Evaluate before deployment: Run regression tests whenever prompts, models, tool definitions, retrieval configurations, or business rules change.
- Monitor production continuously: Track performance across workflows, customer segments, model versions, and tool dependencies rather than relying exclusively on aggregate scores.
- Establish review cycles: Schedule regular human reviews of failed and borderline cases, prioritizing workflows with financial, security, or operational consequences.
Explore LLM observability.
Teams can detect AI agent regressions by comparing candidate versions against a stable evaluation baseline while examining changes in execution behavior, resource consumption, and failure distribution.
- Use paired evaluations: Run identical test scenarios against the current and candidate versions, comparing outcomes, tool-call behavior, execution paths, and operational costs.
- Analyze performance by segment: Break down results by task complexity, tool type, input length, and workflow to identify regressions hidden by overall improvements.
- Apply controlled rollouts: Deploy changes to a limited traffic segment, monitor production traces, and establish rollback criteria for critical failures or sustained performance degradation.
Learn more about distributed tracing and span structure.
Scalable AI agent evaluation pipelines separate lightweight production monitoring from expensive semantic assessments while controlling telemetry volume, storage requirements, and evaluation frequency.
- Use risk-based evaluation: Apply inexpensive deterministic checks broadly while reserving LLM-as-judge scoring and human review for complex, uncertain, or high-impact interactions.
- Prioritize useful telemetry: Preserve detailed traces for failed and high-risk executions while applying carefully designed sampling and retention policies to routine workloads.
- Measure evaluation overhead: Track evaluator token consumption, storage growth, processing latency, and infrastructure costs alongside the quality improvements each evaluation provides.
Read our guide to observability cost reduction.
groundcover combines eBPF-based application visibility with OpenTelemetry traces to help engineers investigate whether failed AI agent evaluations are associated with infrastructure bottlenecks, dependency failures, or application-level behavior.
- Correlate evaluation failures: Associate failed evaluation runs with trace identifiers to inspect relevant LLM requests, application activity, and downstream dependencies.
- Investigate without extensive instrumentation: Use eBPF-based telemetry to capture supported application and infrastructure activity, reducing the need for manual instrumentation across every service.
- Extend visibility where needed: Add OpenTelemetry GenAI instrumentation for agent reasoning steps and tool executions that cannot be reconstructed from infrastructure telemetry alone.
Find out how to combine eBPF and OpenTelemetry.