AI Agent Observability: Key Concepts, Challenges & Best Practices


An AI agent run can look successful while it is doing the wrong work. It may call the right tool with wrong arguments, enter a loop, or follow a slow path that only appears under real traffic. In those cases, a single request can trigger many model and tool calls, leading to higher latency and costs.
When this happens, APM traces capture errors and latency, but stops at your infrastructure boundary. Prompt-only logs of model inputs and outputs miss routing choices and context changes. In this article, you will learn what AI agent observability is and which signals and metrics to track. You will also see how to use AI agent observability with both single agents and multi-agent systems, the unique observability challenges of AI agents, and best practices for implementing AI agent observability at scale.
What Is AI Agent Observability?
AI agent observability means being able to see what an agent did on a request, why it behaved the way it did, and how well it performed, using its telemetry data. Instead of focusing only on CPU, latency, and error rates, you also track AI-specific signals such as token usage, model responses, tool calls, decision paths, and output quality, all mapped to the usual metrics, logs, and traces. This turns the agentic ecosystem of models, tools, and memory into something you can reason about from the outside rather than a black-box LLM call.
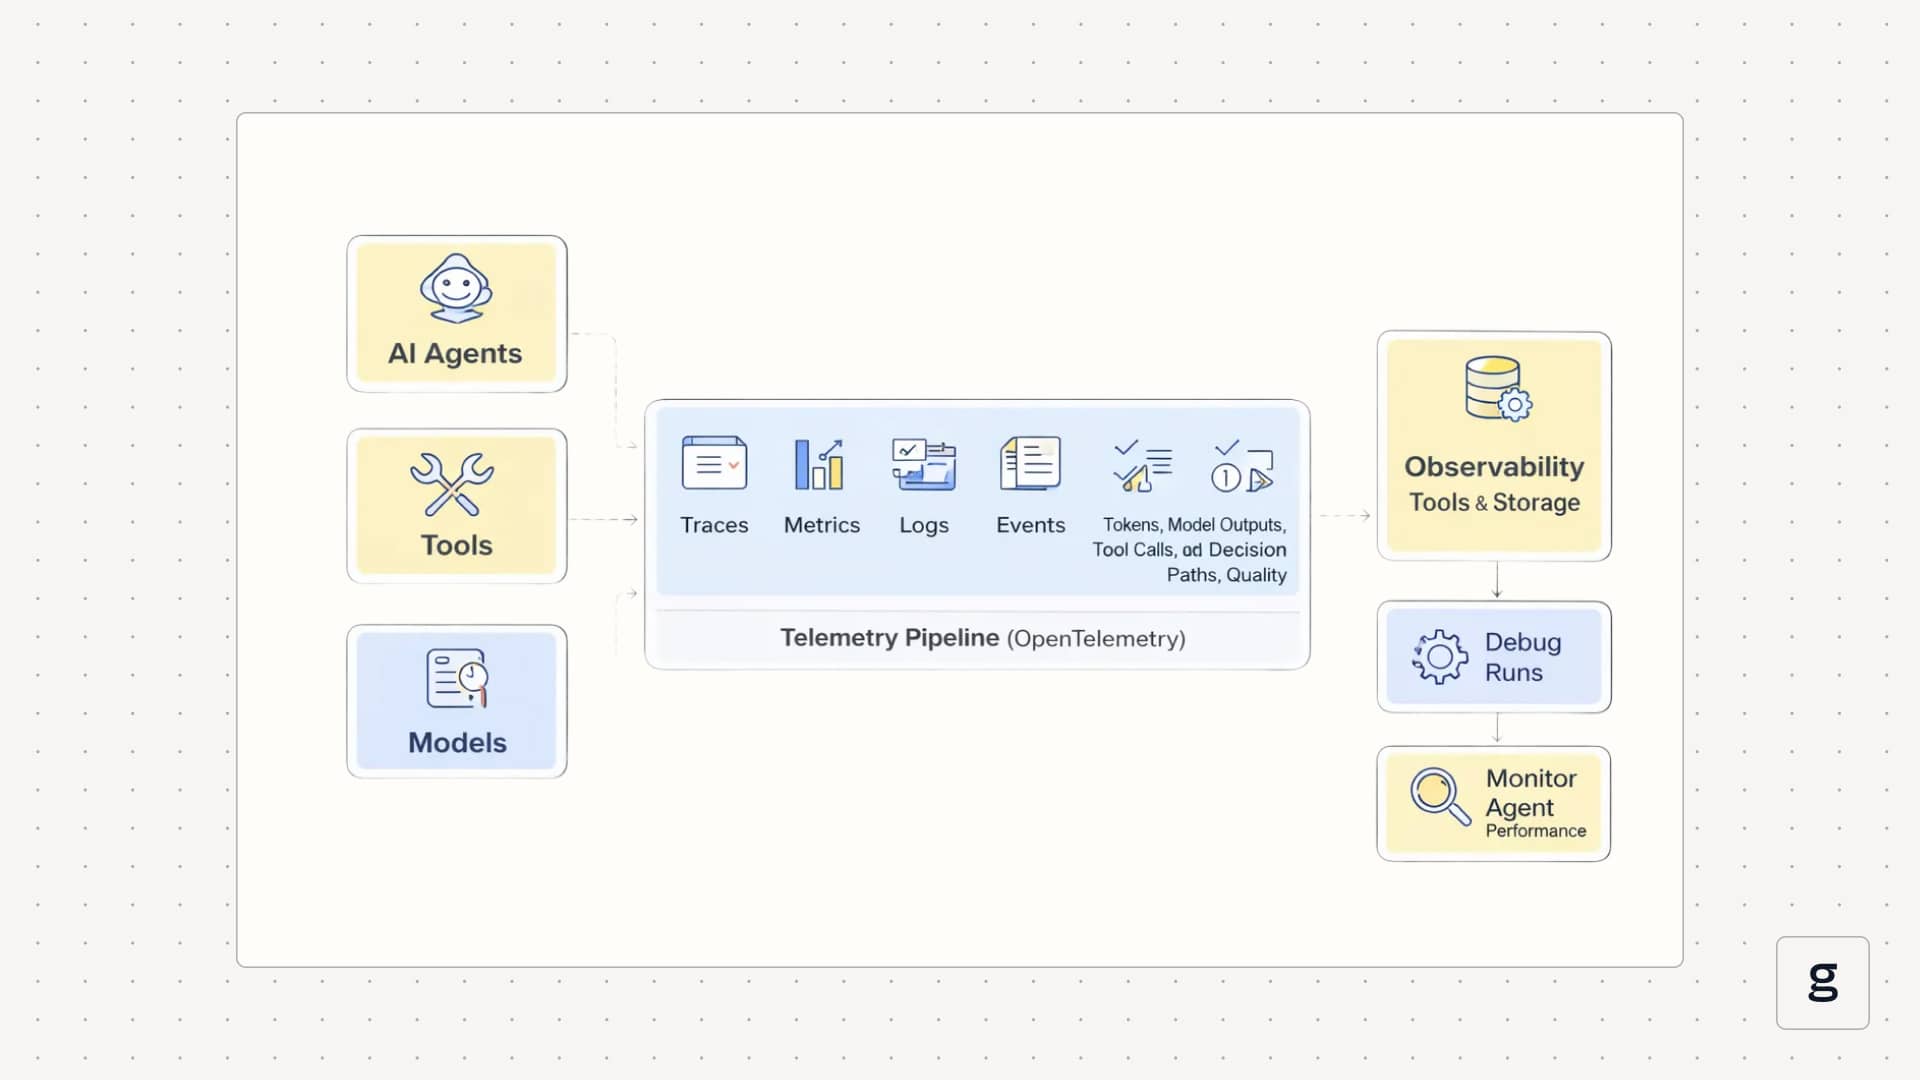
In a system with good AI agent observability, each user request appears as a connected trace. You can open one run and see the user input, the agent’s planning step, every LLM call, every tool call, intermediate results, and the final answer, along with timing, token counts, and costs at each step. That same trace data can then feed dashboards, alerts, and evaluations, so you can review a single confusing run or look across many runs to spot patterns in behavior, reliability, and spend.
Components of AI Agent Observability
AI agent observability has building blocks that help review a single run step by step, then measure behavior and cost across many runs.
- Distributed traces: Distributed traces are end-to-end records of a single agent run. They link each step into an ordered timeline, so you can follow the run across routing, model calls, and downstream work without guessing where the time went.
- Structured logs: Structured logs capture step-level details in a consistent format, not free text. For agents, this includes tool call inputs and outputs, request metadata for model calls, and any decision records your system produces, such as selected routes or scores, so the details stay tied to a specific run and step.
- Metrics for latency, errors, and usage: Metrics summarize behavior across many runs. Alongside latency and error metrics, agent observability tracks AI-specific usage, such as token counts and model timing signals, to help explain slowdowns and cost increases.
- Evaluations and feedback signals: Evaluations are structured measurements of output quality, safety, and task success. Their value increases when each score can be traced back to the exact run and step that produced the output you are reviewing.
- Governance and policy outcomes: Governance signals record what rules were checked and what happened. This includes safety filters, access controls, and policy decisions that explain why an action was allowed, blocked, or altered during a run.
- Semantic conventions and naming standards: Semantic conventions define shared names for spans, events, attributes, and metrics, enabling telemetry from different frameworks and components to be queried consistently. In agent systems, this is what keeps traces and dashboards readable when you mix multiple models, tools, and runtimes.
With these components, you can explain what happened in a run, measure performance and cost, and connect quality and policy outcomes back to the steps that produced them.
Why AI Agent Observability Is Critical in Production Systems
In production, you need to know what your agents did on each request and what that behavior cost you. AI agent observability is what turns that into something you can actually see and control.
Run-Level Evidence for Debugging
When something goes wrong, you usually start from a single bad result: a wrong answer, a broken workflow, or a confused user. Because agents are non-deterministic, replaying the same input may not follow the same path. Run-level traces give you a concrete record of what actually happened on that specific request, so you can see which steps ran, which tools were called, and where the behavior diverged from what you expected.
Pinpoint Which Layer Actually Broke
Not every LLM problem is a model problem. Retrieval can return the wrong context, a tool can time out, a schema can change, or the agent graph can route a request down the wrong branch. When routing, retrieval, model calls, and tool calls show up as separate steps, you can tell whether the fix belongs in a prompt, a data source, a tool API, or the agent workflow.
Surface Failures That Look Like Success
Agents often return fluent responses even when they skip a required tool, use stale data, or apply a rule incorrectly. These runs look fine on the surface and only show up later as business issues. Traces, structured logs, and evaluations make these silent failures visible by showing which steps were skipped, which tools were never called, or which checks were ignored on runs that succeeded.
Tie Cost and Latency Spikes to a Cause
A spike in cost or response time is hard to act on if all you see is a higher average. Step-level visibility lets you see which paths, models, or tools drive token usage, retries, and slow spans. That makes it possible to tune prompts, adjust routing, or change tool usage with a clear goal, rather than guessing or blindly downgrading models.
Catch Regressions From Untracked Changes
Many changes that affect agents never show up as a formal deploy: someone tweaks a prompt, adds a new tool, changes a data source, or switches to a new model version. These untracked changes can degrade quality without raising error rates. When evaluations and feedback are linked to traces, you can spot drops in success rates, new failure patterns, or behavior drift soon after those changes happen.
Support Audits and Compliance Reviews
If an agent reads sensitive data or triggers actions in other systems, you need a clear record of what it accessed, what it attempted, and what was allowed or blocked. Observability data becomes your audit trail. It supports post-incident reviews and gives you concrete evidence for security, risk, or compliance teams when they need to understand how the system behaved.
Follow Failures Across Agent Boundaries
Multi-agent setups increase the number of possible paths through your system. Work can move between planners, specialists, and helpers, and a small mistake early in the chain can ripple into wasted calls or incorrect actions later. Unified tracing and consistent telemetry across agents let you follow a single request end to end, see where the first mistake occurred, and understand how it propagated.
AI agent observability is not optional in production. It is what lets you debug real issues, manage cost, reduce risk, and keep both single-agent and multi-agent systems under control.
How AI Agent Observability Works in Modern Architectures
Modern AI agent observability does not live in a separate silo. It runs through the same telemetry pipeline you already use for services. Agents, tools, and models emit structured telemetry, and observability tools collect and store it so you can debug runs and monitor agent performance over time.
OpenTelemetry and Standards for AI Agent Observability
Most new architectures use OpenTelemetry as the transport and schema for agent observability. Instead of inventing custom formats, agent frameworks emit OpenTelemetry spans and metrics with GenAI-focused fields, such as provider, model name, operation (for example, `invoke_agent`), token counts, and error information.
This gives you a consistent trace shape for agent observability across different agent frameworks. An `invoke_agent` span can contain attributes for the agent ID, input size, output size, and evaluation results. Child spans represent tool usage, retrieval steps, or nested agent calls. Metrics built from the same telemetry cover latency, error rate, token usage, and throughput per model or agent.
You usually connect agents to OpenTelemetry in two ways. Some frameworks ship with built-in OpenTelemetry support, so you set an endpoint and get spans for each agent invocation and model call. Others rely on explicit instrumentation libraries that you import into your application to wrap LLM calls, agent invocations, and tool functions.
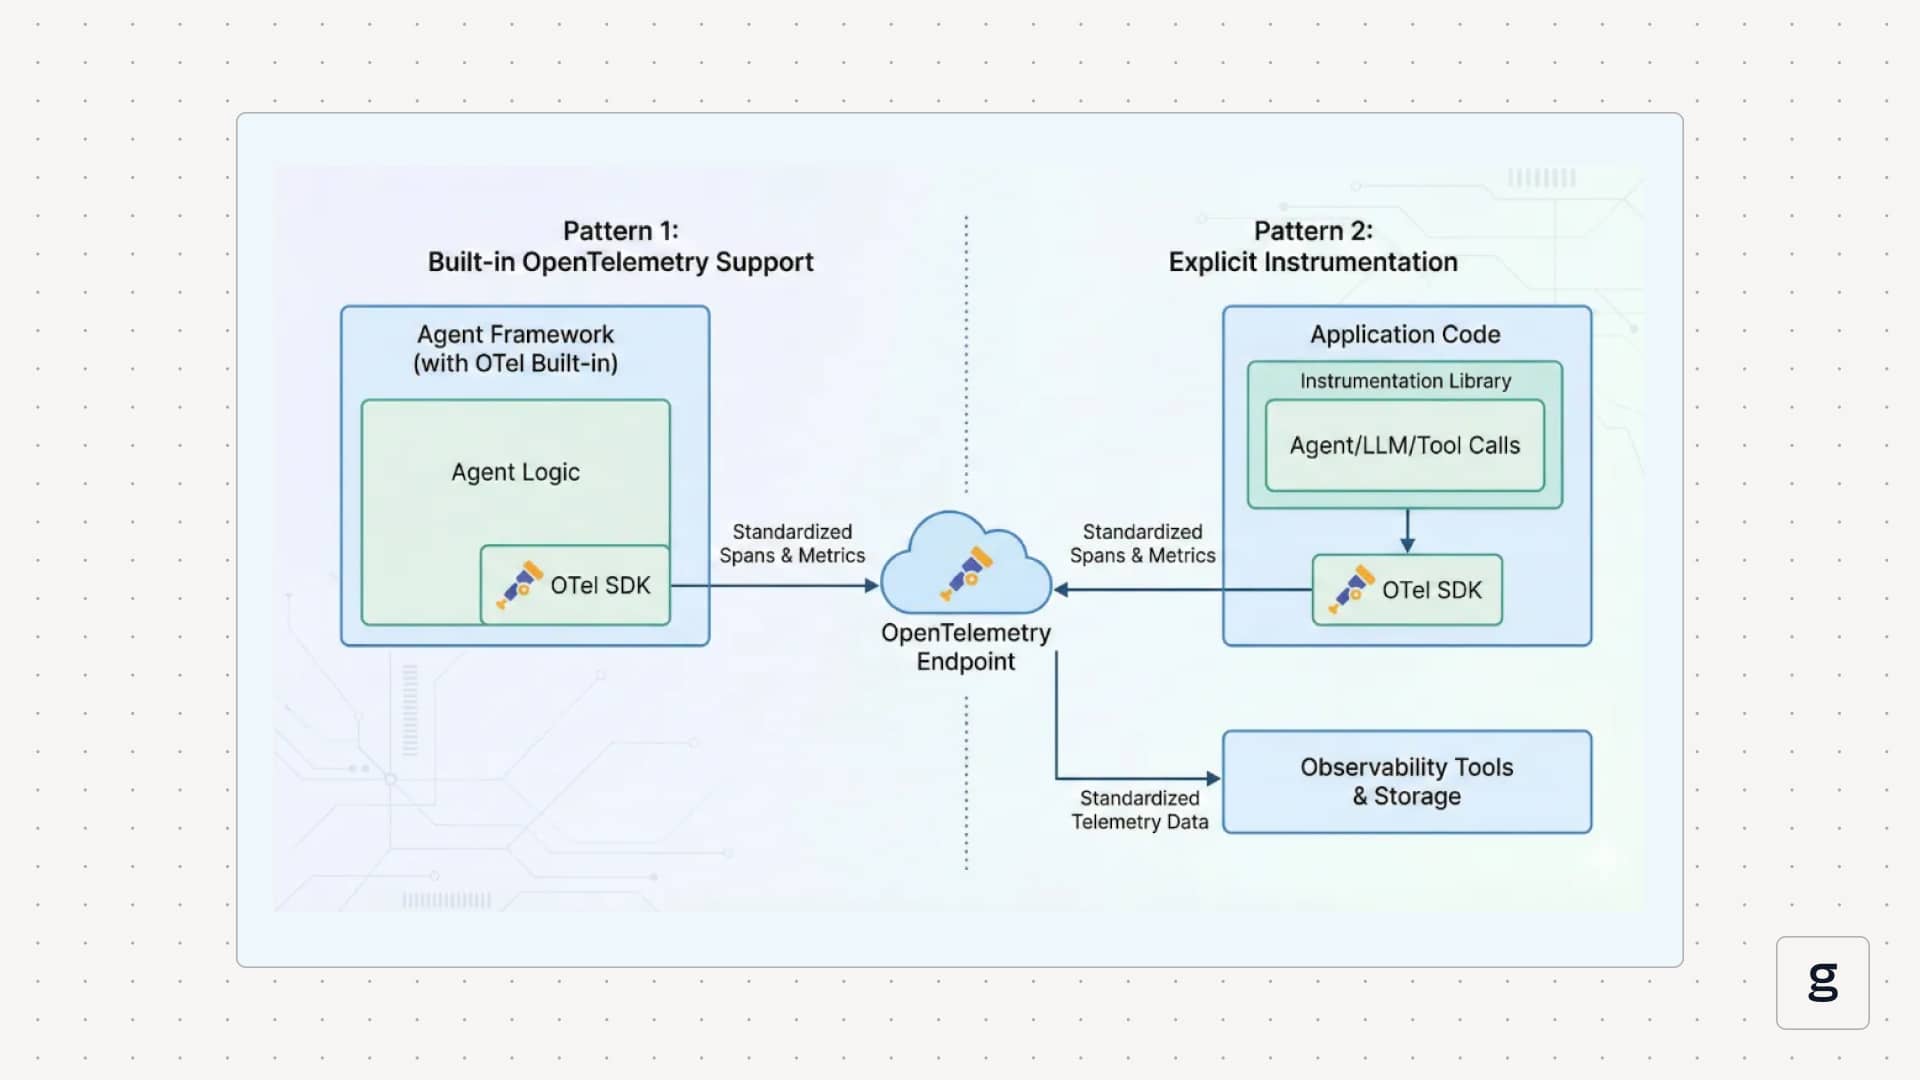
In both cases, the goal is the same: emit standardized telemetry that any OpenTelemetry-compatible observability tools can ingest and query.
AI Agent Observability in Multi-Agent and Tool-Driven Systems
Many production setups are multi-agent by design. A planner agent delegates work to specialist agents, which call tools and services. Agent observability must show how a single user request moves through that entire chain, not just what one agent did.
The core technique is multi-agent tracing. Each agent invocation appears as a span. Trace context is passed along whenever an agent calls another agent or a tool. When you open a trace, you see the root agent span at the top, then child spans for routing, planning, specialist agents, and tool usage. That view shows which agent took responsibility at each step and how control flowed back to the caller.
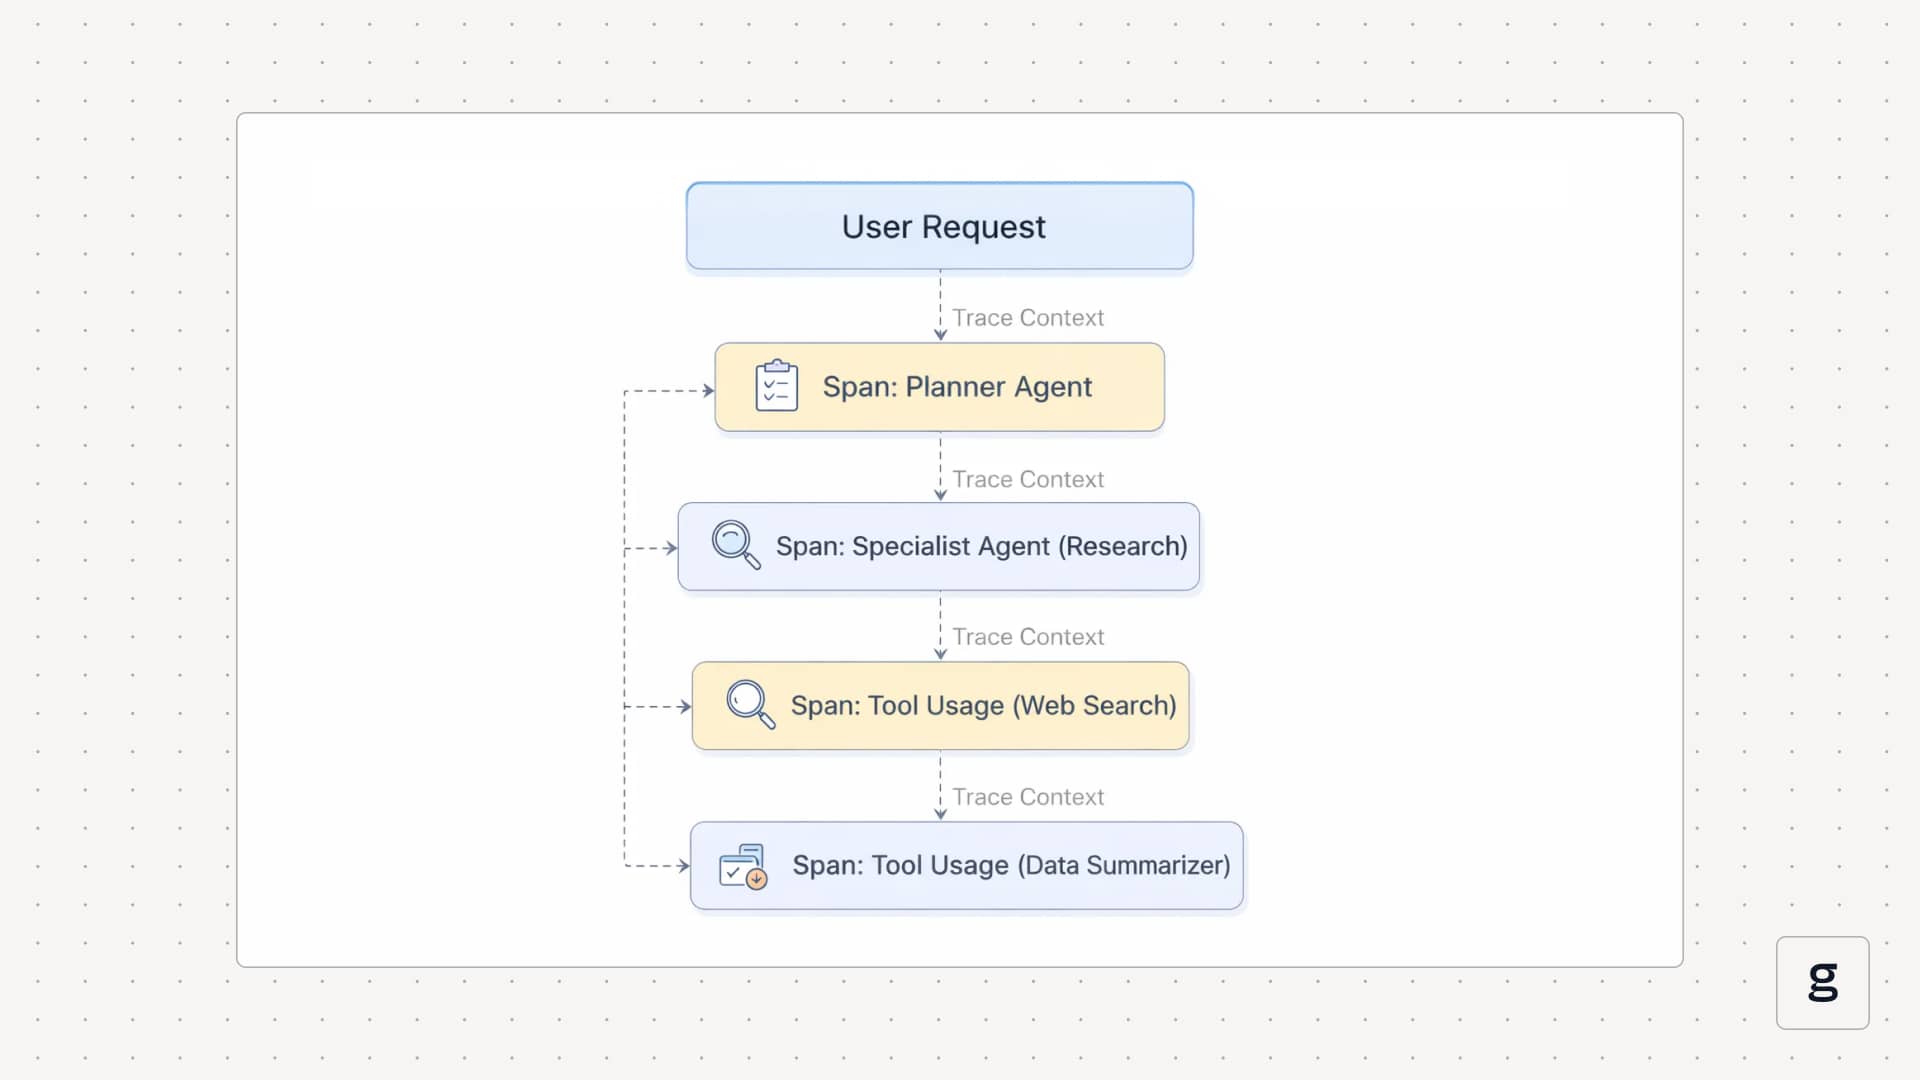
Tool-driven systems follow the same pattern. Each tool call becomes a span with fields for the tool name, latency, status, and selected arguments or response metadata. That makes tool usage part of the same agent observability story, instead of a separate log stream. When you look at one trace, you can see which tools were called in what order, how long they took, and how their outputs fed back into the agent’s decisions.
AI Agent Observability for Debugging, Cost Control, and Reliability
Once telemetry is flowing, the same agent observability data powers three main operational loops: debugging, cost control, and reliability.
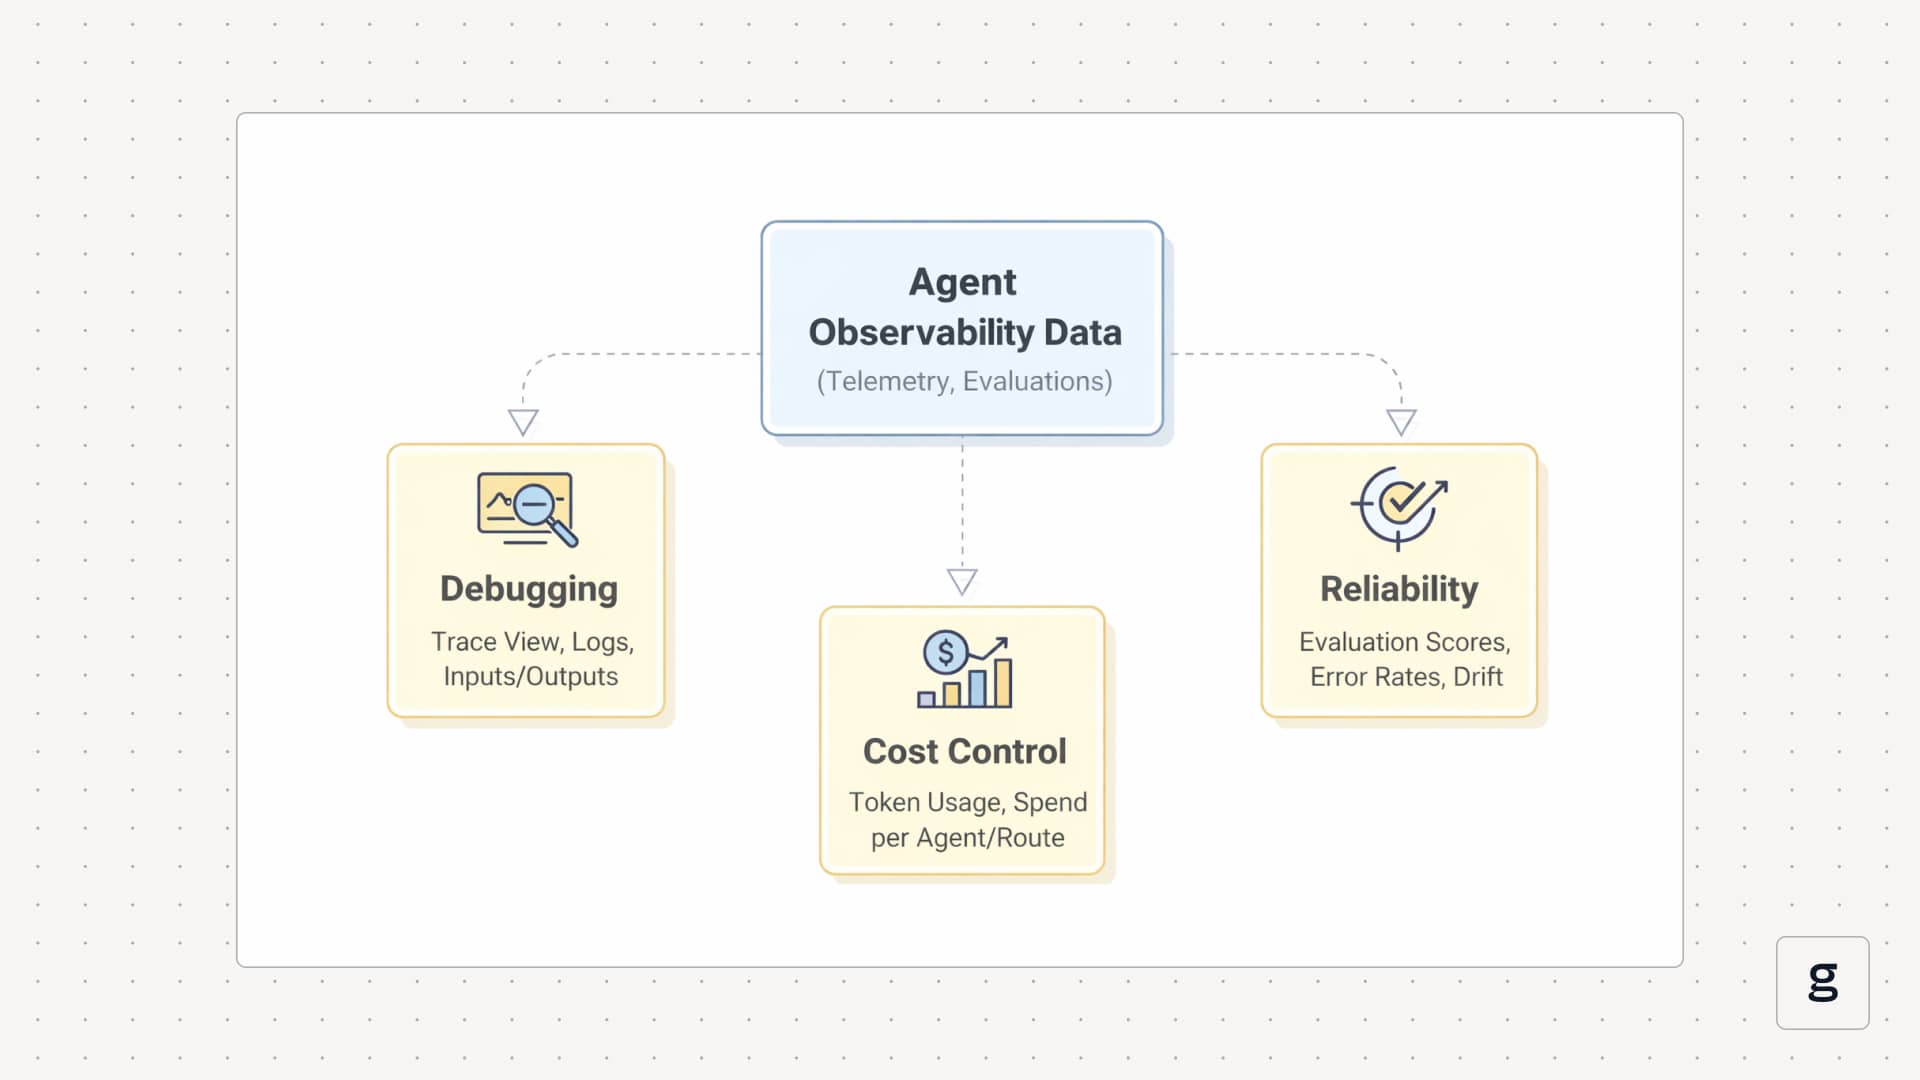
For cost control, you aggregate the same spans into metrics. You can see token usage per agent, per model, and per route; slow spans for particular tools; and the effect of retries or loops on overall spend. That lets you answer questions like which flows are most expensive and what changed between last week and this week using data, then adjust prompts, routes, or tool usage to improve agent performance and reduce costs.
For reliability, you layer evaluations and policy checks on top. Each run can carry signals such as task success, answer correctness, tool accuracy, and guardrail outcomes. Over time, you track these as time series to detect behavior drift and reliability issues in your agent observability tools. When a new prompt, model, or tool version hurts reliability, that change shows up as a shift in evaluation scores and error patterns on real traffic, not just in offline tests.
Core Signals and Metrics Tracked in AI Agent Observability
When you monitor AI agents, you track specific groups of signals: usage, performance, behavior, quality, and governance. These are the main ones.
- Token and Model Usage: You measure input and output tokens for every model call, together with the model and provider. This shows where spend comes from, which agents or routes are costly, and how usage changes after you update prompts, models, or routing.
- Latency and Error Rates: You track end-to-end latency per agent run and per step, including model calls, tool calls, and retrieval. You also record error counts and simple error types per step. This tells you where time is spent and whether reliability issues sit in the model, a tool, or the agent logic.
- Agent Path and Step Metrics: You log how many steps the agent took, which nodes or sub-agents ran, how many retries or loops occurred, and which route or policy branch was chosen. These metrics explain why one run finishes in three steps while another needs twenty and help you catch patterns like unnecessary loops or over-planning.
- Tool Usage and Performance: You track how often each tool is called, how long it takes to run, how often it fails, and how often the agent calls it with bad or incomplete arguments. This shows how much performance and reliability depend on tool usage and highlights tools that cause errors or introduce significant latency.
- Evaluation and Output Quality: You attach scores to runs that measure task success, correctness, grounding to retrieved data, and safety or policy compliance. Over time, these metrics show whether agent performance is improving or degrading and which models, agents, or routes tend to produce weak or risky outputs.
- Governance and Data Access Signals: You record which policies and guardrails ran, whether they blocked or changed actions, and which data sources the agent used. These signals are essential when you need to audit behavior, explain why a request was blocked, or show how often a particular safety rule triggers.
Together, these signals give you a holistic view of how your AI agents are performing.
Observability Challenges Unique to AI Agents
When you monitor AI agents in production, some problems show up that are less common in traditional services. Here are the key observability challenges to plan for.
Understanding these challenges helps you design observability that fits AI agents rather than relying on patterns built only for traditional services.
Best Practices for Implementing AI Agent Observability at Scale
At scale, AI agent observability has to be part of how you design and ship agents, not just a dashboard you add at the end. To build something that holds up under real traffic across many agents and frameworks, you need to follow these practices:
Make Each Agent Run a Single Trace
Treat every user request as a single trace, with spans for planning, model calls, tool calls, and downstream services. That gives you a complete record you can open when a run behaves strangely instead of scattered logs. Use consistent span names and attributes (agent name, operation, model, tool, route) so traces stay readable and comparable across agents.
Use Shared Telemetry Conventions
Pick a common schema for agent telemetry and stick to it across stacks. OpenTelemetry GenAI semantic conventions already define attributes for agent operations, models, conversation IDs, data sources, and errors, so you do not have to invent your own. Emitting spans and metrics in that format makes it easier to plug into existing observability tools and maintain consistent telemetry when you mix different agent frameworks.
Add AI-Specific Metrics and Evaluations
Standard infra metrics are not enough. You also need token and cost metrics per model and per agent, tool usage and failure patterns, and evaluation scores for task success, correctness, grounding, and safety. Treat evaluation as part of observability, with scores stored next to traces and used in dashboards and alerts, not as a separate offline step.
Wire Evaluations Into CI/CD and Production
Do not wait for production to find regressions. Run automated eval suites on key scenarios in CI/CD and block changes that drop quality or safety below a threshold. Then reuse the same evaluation logic on sampled production traffic so you can see when performance drifts after a prompt, model, tool, or data change and jump straight from a bad score to the exact trace.
Build Dashboards and Alerts Around Agent Outcomes
Dashboards should answer whether agents are doing their jobs, not just whether services are up. Track task completion rates, evaluation scores, tool-call accuracy, drift indicators, and cost per request, broken down by agent, route, and model. Set alerts on these signals, for example, completion rate for this workflow dropped, tool-call accuracy fell after a schema change, or cost per request doubled this week, and link alerts to example traces for fast debugging.
Treat Governance and Safety as Telemetry
Policy checks and guardrails should show up in traces like any other step. Log which policies ran, which ones blocked or modified actions, and which data sources the agent accessed. At the same time, protect users and data by truncating or masking prompts and outputs in telemetry and limiting access to detailed traces to the roles that actually need them.
Design for Multi-Agent and Tool-Heavy Flows
Assume work will cross agent and tool boundaries. Propagate trace context across all agent invocations and tool calls so a single request stays within a single trace from the planner to the specialist to external APIs. Include attributes for agent name, tool name, arguments (where safe), latency, and status on each span so you can see where a cascade started when a multi-agent workflow fails.
Grow Coverage From a Focused Starting Point
Do not try to log everything on day one. Start with automatic instrumentation and a small set of important agents or workflows, then add custom spans, attributes, and evals where you actually need more detail to debug or optimize. This keeps telemetry volumes manageable and ensures the dashboards you build are ones you and your team will actually use.
Unified Tracing-First AI Agent Observability with groundcover
So far, you have seen what AI agent observability needs. groundcover turns that into a tracing-first setup without needing you to build a separate stack just for agents.
Trace Every LLM and Agent Call Without Changing Code
groundcover runs an eBPF sensor in your Kubernetes clusters and turns LLM traffic into traces automatically. It detects calls to providers like OpenAI or Anthropic from your services and records prompts, responses, latency, token usage, and errors as spans. You do not have to add new SDKs or wrap every call in tracing code.
For agent workloads, that same sensor lets you see the steps behind a response, not just a single API call. You can open a trace and follow the agent’s planning step, model calls, tool calls, and downstream services as one run, which matches the trace-first best practice from the previous section.
Use Shared GenAI Telemetry Across Your Stack
When groundcover captures LLM and agent calls, it encodes them as spans and metrics that follow GenAI-oriented OpenTelemetry conventions. Each span is tagged with model name, provider, operation, and status, plus timing and token usage.
Because the telemetry uses a shared schema, you can query LLM and agent spans next to normal service traces and metrics instead of juggling a separate AI-only observability tool. That makes it easier to build dashboards that combine agent performance, token usage, and service-level latency in one place.
Correlate Agent Behavior With Kubernetes and Services
groundcover was built as a full-stack observability platform, so LLM observability sits on top of traces and metrics it already collects from your applications and Kubernetes. An agent request shows up as a trace that starts at your ingress or API gateway, flows through the service where the agent runs, out to the LLM provider, and into any internal tools or databases.
Every span is enriched with Kubernetes metadata such as cluster, namespace, workload, and pod. When you debug an agent issue, you can see whether the problem is the LLM call, a slow tool, a pod under pressure, or a network hop, without switching tools.
Keep AI Telemetry in Your Own Cloud and Under Control
Agent observability often involves sensitive prompts and responses. groundcover is deployed in your own cloud, so telemetry and payloads stay inside your environment rather than in a shared SaaS backend.
You can also control how much content is stored. By default, groundcover can capture full request and response bodies for debugging, but you can configure masking and truncation rules to remove secrets, PII, or specific fields while keeping timing, token counts, and error details. That lets you use detailed traces when needed without exposing more data than necessary.
Let Agents Query Telemetry Through the groundcover MCP Server
groundcover also exposes its data through a Model Context Protocol (MCP) server. That means your own agents can query logs, metrics, and traces directly from groundcover as part of their workflow.
You can give a support agent or on-call assistant controlled access to recent errors, slow traces, or resource usage, all through natural-language queries. The agent uses the same observability data you see in the UI, which closes the loop between AI agent observability and AI-assisted operations.
Conclusion
With AI agent observability, you can explain what your agents did, why they behaved that way, and how each run affected latency, cost, and output quality. By treating traces, metrics, logs, evaluations, and governance data as a single system, you move from vague complaints about the agent failing to specific runs, steps, and fixes.
groundcover gives you a tracing-first way to do this on top of your existing Kubernetes and service telemetry. By tracing LLM and agent calls, standardizing GenAI signals, and keeping observability data in your cloud, you can debug issues early and keep performance, cost, and reliability on track as workloads grow.


.svg)