Elasticsearch Query Optimization: Key Techniques for Faster Search



The goal of Elasticsearch is to enable fast queries across large volumes of data. But whether Elasticsearch queries are actually fast depends, in large part, on how effectively admins optimize Elasticsearch for queries. Lack of optimization can cause queries to take a long time, potentially leading both to a poor user experience and to inefficient use of Elasticsearch resources.
Hence the importance of Elasticsearch query optimization – which is the focus of this article. Below, we explain what query optimization in Elasticsearch means, why it’s important, and best practices for making Elasticsearch queries as fast and efficient as possible.
What is Elasticsearch query optimization?

Elasticsearch query optimization is the practice of configuring Elasticsearch in ways that help to execute queries quickly and with as little resource usage as possible.
As we explain later in this article, there are many specific ways to optimize Elasticsearch queries. Some involve high-level architectural decisions, like shard sizing, while others center on the way queries are structured or filtered. When deployed in the right way, all of these practices enable Elasticsearch to process queries more quickly, and/or with less CPU and memory usage.
Elasticsearch users can also play a role in query optimization by writing queries in efficient ways (such as avoiding the use of wildcards except where they are strictly necessary). However, most of the query optimizations that can be implemented in Elasticsearch are backend changes that admins must deploy – so, while educating users may help somewhat to improve query performance, the most impactful optimizations are those that admins make to Elasticsearch itself.
Why Elasticsearch query optimization matters for performance & cost
Elasticsearch query optimization is important for two key reasons:
- Performance: From a performance perspective, optimization helps Elasticsearch deliver query results more quickly. By extension, it leads to a better user experience because users can get the information they’re looking for in less time.
- Cost: Optimization can also help to reduce the amount of CPU and memory that Elasticsearch consumes when processing queries. Since CPU and memory resources cost money, lower resource usage results in lower hosting costs for Elasticsearch clusters.
| Benefit | Why it matters |
|---|---|
| Faster search performance | Query optimization reduces unnecessary processing and helps Elasticsearch return results with lower latency. This improves application responsiveness and provides users with faster access to relevant information. |
| Lower infrastructure or hosting costs | Efficient queries require fewer CPU cycles and less memory during execution. Reducing resource consumption can decrease the infrastructure capacity needed to run Elasticsearch clusters and help lower operating expenses. |
How Elasticsearch query execution works
To understand how to optimize Elasticsearch queries, you must first understand the essentials of how Elasticsearch query execution works.
The process involves these basic steps:
- Request received: First, a client sends a request to Elasticsearch. If it’s a multi-node cluster, a specific node receives the request and becomes the coordinating node (which means it’s responsible for delegating the request to other nodes if necessary, then passing the response back to the client).
- Broadcast: The coordinating node determines which index the request targets. It then broadcasts or “scatters” the request to every shard associated with the index.
- Document search: The shards (each of which operates as an Apache Lucene index) search their data to find documents that match the query.
- Relevance calculation: Shards determine relevance scores for matching documents (unless the query is run in filter context mode, in which case this step is skipped).
- Merge: After shards have found and ranked relevant documents, the coordinating node collects the results and sorts them into a list.
- Target document retrieval: After examining relevant configuration parameters (like from and size), the coordinating node determines which specific documents to return in the response to the client.
- Response delivery: Finally, the coordinating node sends the relevant documents back to the client.
The architecture and configuration of Elasticsearch can affect the speed of each of these steps in the query process – hence why optimization can boost overall query velocity and Elasticsearch performance.
Common causes of slow Elasticsearch queries
Before diving into ways to optimize Elasticsearch queries, let’s discuss common reasons that can make queries slow:
- Poor index and field mapping: Incorrect field types, unnecessary text analysis, or missing keyword fields can prevent efficient lookups and force Elasticsearch to scan more data than necessary.
- Oversized or poorly distributed shards: Shards that are too large, too numerous, or unevenly balanced across nodes can increase search overhead, create hotspots, and slow query execution.
- Resource constraints and cluster contention: Insufficient memory, high CPU utilization, disk I/O bottlenecks or concurrent indexing workloads can reduce the resources available for search operations, leading to slower query response times.
- Inefficient query design: Queries that rely on wildcard searches, regular expressions, scripts, or deeply nested clauses require Elasticsearch to perform additional processing, increasing query latency and CPU usage (as noted above, optimizing query design is a task that falls mainly to users, whereas the other issues on this list are ones that Elasticsearch admins must address).
Core techniques for Elasticsearch query optimization
Since there are multiple factors that can slow Elasticsearch queries, optimizing queries typically involves multiple practices. Here’s a look at key techniques for query optimization.
Using filter context vs. query context effectively
Using filter context instead of query context whenever relevance scoring is unnecessary can significantly improve Elasticsearch query performance. Filter context evaluates whether documents match specific criteria without calculating a relevance score, making it faster and allowing Elasticsearch to cache results for repeated queries.
Query context should be reserved for full-text searches and other use cases where document relevance determines result ranking. Separating filtering conditions from scoring queries reduces computational overhead, improves cache utilization, and helps deliver faster, more efficient searches.
Optimizing field mapping and index design
Optimizing field mapping and index design ensures Elasticsearch stores and searches data as efficiently as possible. Selecting the appropriate field types, using keyword fields for exact matches, limiting unnecessary text analysis, and disabling indexing for fields that are never searched all reduce storage and query overhead.
A well-designed index structure with appropriately sized shards and carefully chosen mappings minimizes resource consumption, speeds query execution, and improves overall Elasticsearch performance as data volumes grow.
Efficient pagination and sorting strategies
Efficient pagination and sorting strategies help Elasticsearch return results with less processing and lower memory usage. For deep pagination, using search_after or point-in-time (PIT) searches is more efficient than relying on large from and size values (since the latter require Elasticsearch to skip and retain more results in memory). Sorting on indexed fields with doc_values enabled, limiting the number of returned documents, and avoiding unnecessary sorting whenever possible further reduce query latency and drive Elasticsearch performance optimization, especially for large datasets and high-traffic applications.
Leveraging query and request caching
Query and request caching can significantly reduce query latency by allowing Elasticsearch to reuse the results of repeated searches instead of recomputing them. Filter-based queries benefit from the query cache because their results can be stored and reused across requests, while the request cache accelerates identical search requests that target unchanged data.
To take full advantage of query and request caching, structure queries to maximize cache eligibility and minimize unnecessary index refreshes to help improve cache hit rates.
Avoiding expensive queries like wildcards and scripts
As we’ve mentioned, Elasticsearch users can contribute to query optimization by writing well-structured queries. In particular, they should avoid “expensive” queries, such as ones that use leading wildcards or complex regular expressions. These query types often require Elasticsearch to scan large portions of an index or execute additional computations that cannot be optimized as efficiently as standard term or range queries.
A better approach is to use indexed fields, prefix queries, n-grams, or precomputed values whenever possible so that Elasticsearch can execute searches more efficiently while still maintaining accurate results.
Infrastructure and cluster-level optimization for Elasticsearch queries
The Elasticsearch query optimization techniques we just discussed mostly involve configuration optimizations that admins can set within Elasticsearch, as well as practices users should follow when writing queries.
There are also steps admins can take at the architectural and infrastructure levels to optimize Elasticsearch queries, such as the following.
Shard sizing and index strategy
Choosing an appropriate shard size and index strategy helps Elasticsearch execute queries more efficiently by reducing the overhead of coordinating searches across multiple shards. Too many small shards increase metadata management and query coordination costs, while overly large shards can slow search execution and recovery operations. Designing indices based on data volume, retention requirements, and access patterns allows queries to run faster while improving cluster scalability and resource utilization.
Memory allocation and resource management
Proper memory allocation and resource management ensure Elasticsearch has sufficient CPU, heap memory, and file system cache to process queries efficiently. Allocating an appropriate JVM heap size, leaving enough memory for the operating system cache, and avoiding resource contention from other workloads help reduce garbage collection pauses and disk I/O.
Also important is monitoring resource utilization and scaling cluster capacity as demand grows to improve query responsiveness and overall cluster stability.
Refresh intervals and indexing trade-offs
Adjusting refresh intervals allows administrators to balance indexing performance with search responsiveness. Frequent refreshes make newly indexed documents searchable sooner but consume additional resources that can slow query execution during heavy indexing workloads. Increasing the refresh interval for write-intensive indices reduces refresh overhead, improves indexing throughput, and frees resources for search operations when immediate data visibility is not required.
Balancing query performance across nodes
Balancing query performance across nodes prevents individual nodes from becoming overloaded while others remain underutilized. Specifically, even distribution of shards, replicas, and search traffic helps ensure that queries are processed in parallel across the cluster without creating hotspots. Continuous monitoring and rebalancing as workloads change is also important for ensuring efficient resource utilization, reducing query latency, and maintaining consistent search performance as the cluster scales.
Monitoring and debugging Elasticsearch query performance
As the saying goes, you can’t optimize what you can’t see – which is why monitoring and debugging Elasticsearch are key practices that admins should employ alongside optimization techniques. Monitoring and debugging are the only way to ensure that optimization strategies yield tangible results – and that queries remain fast and efficient as Elasticsearch clusters change.
More specifically, admins should ensure that they perform steps like the following to gain critical visibility into the status and performance of Elasticsearch queries:
- Monitor slow query logs: Enable and review Elasticsearch slow query logs to identify searches that consistently exceed latency thresholds. These logs help pinpoint inefficient queries, problematic indices, and recurring performance issues.
- Use the Profile API: Analyze query execution with the Elasticsearch Profile API to understand how much time each query phase and clause consumes. This makes it easier to identify bottlenecks such as expensive filters, scoring operations, or script execution.
- Review search performance metrics: Track metrics such as query latency, throughput, cache hit rates, CPU utilization, heap usage, and disk I/O to detect performance degradation before it impacts users.
- Inspect cluster and node health: Regularly check cluster health, shard allocation, node utilization, and thread pool statistics to identify resource bottlenecks, overloaded nodes, or unbalanced shard distribution that can slow queries.
- Analyze index and shard performance: Review shard sizes, segment counts and index statistics to determine whether oversized shards, excessive shard counts or fragmented indices are contributing to slow search performance.
- Evaluate cache effectiveness: Monitor query cache, request cache and field data cache utilization to ensure frequently executed queries benefit from caching and to identify opportunities to improve cache hit rates.
- Identify resource contention: Compare query performance against indexing activity, garbage collection events, and background cluster operations to determine whether competing workloads are affecting search responsiveness.
| Monitoring practice | How it helps with query optimization |
|---|---|
| Review slow query logs | Use Elasticsearch slow logs (which record queries that take a long time to execute) to locate searches that regularly exceed performance targets. This helps uncover inefficient query structures, problematic indices, and recurring latency issues that need attention. |
| Examine query execution with the Profile API | Use profiling tools to break down query processing time across individual clauses and execution stages. This reveals performance bottlenecks caused by expensive filters, scoring logic, scripts, or other resource-intensive operations. |
| Monitor search performance metrics | Track key indicators such as query response time, search volume, cache efficiency, CPU usage, JVM heap consumption and disk activity to identify performance issues before they affect users. |
| Check cluster and node health | Review cluster status, shard placement, node workload and thread pool activity to identify overloaded nodes, resource limitations and uneven shard distribution that may reduce query performance. |
| Assess index and shard efficiency | Analyze shard size, segment growth and index statistics to detect issues such as oversized shards, too many shards or fragmented indices that increase search overhead. |
| Measure cache utilization | Monitor query cache, request cache and field data cache behavior to determine whether frequently executed searches are benefiting from caching and where cache improvements may be possible. |
| Detect competing resource demands | Compare search performance with indexing workloads, garbage collection activity and background cluster tasks to determine whether other operations are consuming resources needed for fast query execution. |
Step-by-step Elasticsearch query optimization workflow
What if, despite adopting the optimization techniques discussed above, your Elasticsearch queries are still slow or inefficient? In that case, consider working through the following steps, which can help to streamline queries further.
1. Identify slow queries using profiling and logs
The first step in optimizing Elasticsearch queries is identifying which searches are consuming the most time and resources. Slow query logs, the Profile API, and search latency metrics help pinpoint inefficient queries, frequently executed searches, and recurring performance issues. Establishing a baseline for query performance allows administrators to prioritize optimization efforts based on the greatest impact.
2. Analyze query execution and bottlenecks
After identifying slow queries, analyze how Elasticsearch executes them to determine the underlying cause of poor performance. Profiling data can reveal expensive scoring operations, inefficient filters, costly aggregations, excessive shard fan-out, or resource contention at the Elasticsearch node level.
Understanding where time is spent during query execution makes it possible to target optimizations that address the actual bottleneck instead of relying on trial and error.
3. Apply query and infrastructure optimizations
Once bottlenecks have been identified, implement improvements to both query design and cluster configuration. Replacing expensive query types with more efficient alternatives, optimizing field mappings, improving shard sizing, increasing cache utilization, and balancing workloads across nodes can all reduce query latency.
Beyond this, addressing infrastructure limitations such as insufficient memory, CPU, or storage performance further improves search responsiveness and overall cluster efficiency.
4. Validate performance improvements and iterate
After making changes, compare query latency, resource utilization, and throughput against the original baseline to verify that the optimizations produced measurable improvements. Performance testing under realistic workloads helps confirm that changes are effective and do not introduce unintended side effects.
Because data volumes, workloads, and application behavior evolve over time, query optimization should be an ongoing process of monitoring, testing, and refinement.
Real-world examples of optimized queries
To drive home the guidance laid out above about Elasticsearch query optimization, let’s take a look at an example of optimized queries in real-world context.
For this example, imagine that a retail application uses Elasticsearch to power product search. Users search for products by keyword while filtering by category, availability, and price range.
Before vs. after query comparison
The original query looks like this:
This query is functional (meaning it will execute successfully), but it’s suboptimal due to issues like the following:
- Unnecessary scoring: The query uses must clauses for filters that don’t require relevance ranking. Elasticsearch calculates relevance scores even though category, availability, and price were only used as constraints.
- Expensive wildcard search: The leading wildcard query (*apple*) forces Elasticsearch to scan many terms because it could not efficiently use the inverted index.
- Inefficient deep pagination: Using a high from value requires Elasticsearch to collect and discard thousands of results before returning the requested page.
- Poor sorting strategy: Sorting by _score adds computation when the business requirement is to display relevant products sorted by popularity or price.
The query could be optimized by reformulating it to look like this:
After the query rewriting, the inefficiencies described above have all been mitigated. The optimized query is likely to provide lower latency, better resource efficiency, and more consistent performance as the business’s product catalog grows.
Elasticsearch query optimization best practices for production systems
Beyond the specific optimization techniques discussed above, the following general best practices help teams implement and maintain fast, efficient Elasticsearch queries:
- Design queries for efficient execution: Use filter context for exact matches and non-scoring conditions, avoid expensive wildcard and script queries when possible, and structure queries to minimize unnecessary processing.
- Optimize index mappings and shard strategies: Define appropriate field types, use keyword fields for exact searches, and maintain properly sized shards to improve search performance, reduce overhead, and support cluster scalability.
- Monitor query performance continuously: Track slow query logs, latency metrics, cache usage and cluster health indicators to identify performance issues before they impact production workloads.
- Test and refine queries regularly: Benchmark query changes against realistic workloads, validate performance improvements and continuously adjust query design, indexing strategies and infrastructure settings as data volumes and application requirements evolve.
| Practice | Description |
|---|---|
| Build efficient search queries | Structure queries to reduce unnecessary processing by separating scoring requirements from filtering operations, limiting costly query types and using approaches that take advantage of Elasticsearch indexing capabilities. |
| Maintain optimized index structures | Use appropriate field mappings, shard configurations and index designs that match workload requirements to improve search speed and prevent avoidable resource overhead. |
| Continuously track search performance | Monitor query latency, slow searches, cluster metrics and cache behavior to uncover bottlenecks and identify areas where further tuning is needed. |
| Regularly test and improve configurations | Measure the impact of query changes, indexing adjustments, and infrastructure updates through performance testing, then refine the environment as data patterns and application needs change. |
Real-time observability for Elasticsearch query optimization with groundcover
As we said, you can’t optimize what you can’t see – hence why observability solutions like groundcover play a vital role in Elasticsearch query optimization.
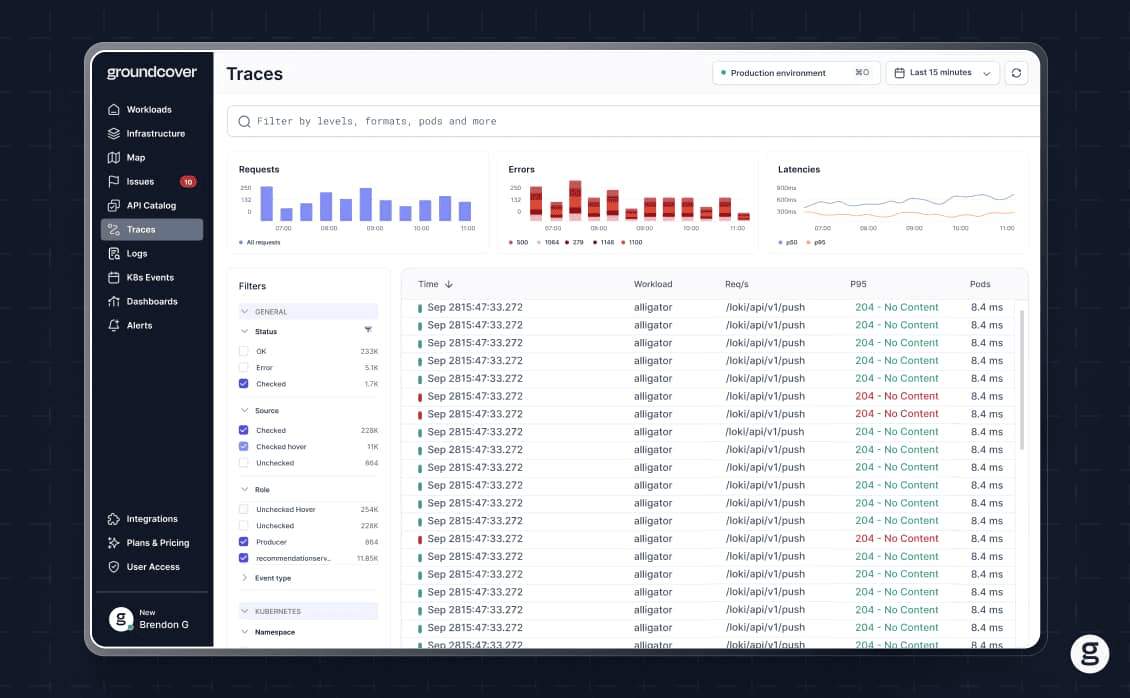
With groundcover, you can continuously and systematically monitor and analyze every aspect of every Elasticsearch query. You can also track the health and performance of your Elasticsearch nodes, shards, and other components. By correlating this data and making it easy to interpret via intuitive charts, groundcover helps admins home in on the root causes of poor Elasticsearch query performance.
The icing on the cake is that groundcover can collect the monitoring data necessary to optimize Elasticsearch queries via eBPF, a hyper-efficient framework that consumes vastly fewer resources than conventional observability approaches. This means you don’t need to waste resources just to see whether your Elasticsearch queries are wasting resources.
Instead, groundcover gives admins the best of both worlds: Deep visibility combined with high performance.
In a perfect world, every Elasticsearch query would be processed quickly and efficiently regardless of how it’s structured or how Elasticsearch is configured. In the real world, though, Elasticsearch can’t magically optimize every query for you. Instead, it’s up to admins – with some help from users – to implement the optimizations necessary to keep queries as fast, efficient, and scalable as possible.
FAQs
To identify which Elasticsearch queries are slowing down your system, configure Elasticsearch to log queries that take a long time to execute. You can do this by configuring the index.search.slowlog.threshold.query<level> option in the Elasticsearch Index Settings API to define a maximum threshold for query execution before queries are logged.
Query context determines how well a document matches a search by calculating relevance scores, while filter context only checks whether a document meets specific criteria without scoring it. Filter context is typically faster and can be cached, making it ideal for exact matches, ranges, and other non-scoring conditions.
Using eBPF to collect data quickly and efficiently, groundcover continuously monitors the status and performance of Elasticsearch queries, as well as associated infrastructure. By correlating this data, groundcover helps admins pinpoint the root cause of poor query performance. It also allows them to validate that changes aimed at optimization actually result in better performance, even as Elasticsearch clusters evolve.