Elasticsearch Query Timeout: Causes, Fixes & Optimization Tips



By default, Elasticsearch will take as much time as it needs to respond to a query. But this isn’t necessarily a good thing. If it takes a long time for Elasticsearch to process a query – or if the query remains active indefinitely – the result can be slower responses to other requests and the inefficient use of resources.
Fortunately, there’s a way to prevent this type of problem: Elasticsearch query timeouts. By configuring a timeout, Elasticsearch admins can tell Elasticsearch not to wait indefinitely for a query to complete.
Keep reading for details as we explain how query timeouts work in Elasticsearch, what causes queries to approach or exceed the timeout threshold, and how to manage timeouts as part of an Elasticsearch performance optimization strategy.
What is Elasticsearch query timeout?
In Elasticsearch, a query timeout is a feature that limits the amount of time the Elasticsearch cluster can spend processing a query.
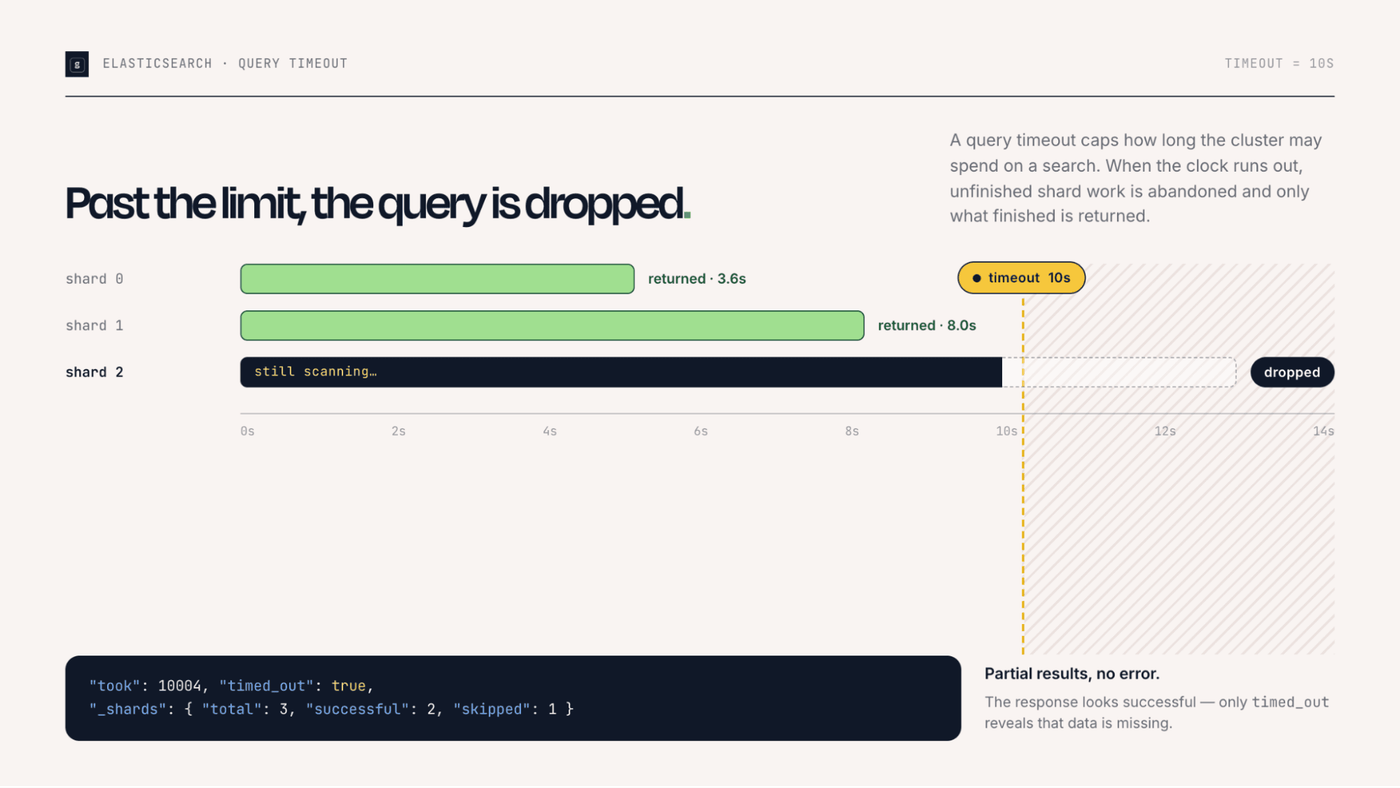
Again, by default, Elasticsearch will wait indefinitely for query processing to complete. But admins can optimally set a timeout window. For instance, imagine you want to tell Elasticsearch to stop processing any query that does not complete within 5 seconds. You’d do this by configuring a query timeout of 5 seconds.
How Elasticsearch query timeout works
Once the timeout threshold is reached for a particular query, Elasticsearch will stop processing that query. It will return any query results that it was able to collect up to the timeout point, but it won’t process the query any further, even if it’s incomplete.
You can set queries on a per-request basis (meaning you can apply a specific timeout to each request sent to Elasticsearch), or on a cluster-wide basis (meaning you set a default timeout that applies to all requests received by the cluster).
Common causes of Elasticsearch query timeout issues
Setting a query timeout limit can help prevent scenarios where Elasticsearch wastes resources on queries that it will never be able to complete, as we’ve noted above. However, better than abandoning excessively time-consuming queries is to prevent query timeout issues in the first place.
Such issues typically result from problems like the following:
- Slow or inefficient queries: Complex queries, excessive wildcard searches, expensive regular expressions, deep pagination and poorly structured aggregations can take longer than the configured timeout, especially when searching large datasets.
- Large or high-cardinality datasets: Queries that scan massive indexes or aggregate on high-cardinality fields require more CPU and memory to complete, increasing response times and making timeouts more likely.
- Resource constraints and cluster overload: High CPU utilization, memory pressure, disk I/O bottlenecks, insufficient heap space or overloaded data nodes can slow query execution and prevent Elasticsearch from responding before the timeout threshold.
- Poor index design or shard configuration: Oversharding, undersharding, unoptimized mappings, missing index sorting, and the absence of appropriate filters or caching can force Elasticsearch to perform more work for each query, increasing latency and the risk of timeouts.
Core techniques for preventing Elasticsearch query timeout
To mitigate the risk of query timeout problems like those described above, consider these strategies.
Optimizing query structure and reducing complexity
Well-structured queries execute more efficiently because Elasticsearch can identify matching documents with less processing. Simplifying nested queries, reducing unnecessary clauses and minimizing expensive aggregations lowers CPU and memory consumption, which helps queries complete before timeout thresholds are reached. Likewise, selecting the right query type for the use case, such as using term queries for exact matches instead of full-text searches, can also significantly improve performance.
For these reasons, teams should regularly review slow query logs and search profiles to identify inefficient query patterns. Breaking large searches into smaller requests, limiting the number of aggregations and ensuring queries take advantage of indexed fields all reduce execution time while improving overall Elasticsearch custer responsiveness.
Limiting response size and avoiding deep pagination
In general, requesting fewer documents reduces the amount of work required to retrieve, sort and transmit results. Limiting the response size with the size parameter and returning only the fields applications actually need decreases memory usage and network overhead, allowing queries to complete more quickly.
Deep pagination is particularly expensive from a resource utilization standpoint because Elasticsearch must sort and keep track of increasingly large result sets before returning the requested page. Instead of relying on large from offsets, use search_after, point-in-time (PIT) searches or the Scroll API for large result sets. These approaches scale more efficiently and help prevent long-running queries from timing out.
Using filters instead of expensive query contexts
Whenever document scoring is unnecessary, filter context is generally more efficient than query context. Filters simply determine whether a document matches specified criteria without calculating relevance scores, reducing CPU utilization and speeding up query execution.
Filters also benefit from Elasticsearch's caching mechanisms, allowing repeated searches with the same filter conditions to execute much faster. Moving exact-match conditions, date ranges and structured field constraints into filter clauses improves performance while reducing the likelihood of query timeouts.
Avoiding heavy operations like wildcards and scripts
Certain query types require Elasticsearch to perform significantly more processing than standard indexed searches. Leading wildcard queries, complex regular expressions, runtime scripts and unrestricted script-based scoring can force Elasticsearch to scan large portions of an index, resulting in slow execution times and higher resource consumption.
Whenever possible, replace wildcard searches with prefix queries, use properly analyzed fields for text searches, and precompute values during indexing instead of calculating them at query time. Reducing reliance on scripts and other expensive operations helps maintain consistent query performance even under heavy workloads.
Leveraging caching and efficient query patterns
Elasticsearch includes several caching mechanisms that can dramatically reduce query latency for frequently executed searches. Query cache, request cache and filesystem cache all help minimize repeated work by reusing previously computed results whenever possible.
Applications can further improve performance by using consistent query patterns that maximize cache reuse, avoiding unnecessary variations in requests and designing indexes to support common search workloads. Combined with efficient filtering and optimized mappings, effective caching reduces cluster load and helps ensure queries consistently complete within configured timeout limits.
Infrastructure and resource tuning for Elasticsearch query timeout
We just covered high-level strategies for minimizing the risk of slow queries in Elasticsearch. But to go a level deeper, let’s discuss infrastructure- and resource-related tactics that help optimize query performance:
- Shard sizing and index design for faster queries: Properly sized shards reduce the amount of data each query must search while avoiding the overhead associated with too many small shards. Well-designed indexes, appropriate mappings and balanced shard distribution help Elasticsearch execute searches more efficiently and reduce the likelihood of query timeouts.
- Memory allocation and JVM heap optimization: Allocating sufficient memory allows Elasticsearch to cache frequently accessed data, maintain healthy garbage collection performance and avoid excessive memory pressure. Proper JVM heap sizing, combined with adequate operating system memory for the filesystem cache, helps keep query latency low and prevents timeouts caused by resource contention.
- Balancing CPU and disk I/O across nodes: Evenly distributing workloads across cluster nodes prevents individual systems from becoming CPU-bound or overwhelmed by storage operations. Monitoring resource utilization, scaling nodes when necessary and using fast storage help ensure queries execute consistently without delays that can trigger timeouts.
- Managing refresh intervals and indexing overhead: Frequent index refreshes consume CPU, memory and disk resources, which can lead to slower search operations. Increasing the refresh interval during periods of heavy indexing reduces this overhead, allowing more resources to be dedicated to query execution and improving overall search performance.
Configuring Elasticsearch query timeout settings correctly
In addition to taking steps to reduce the risk of slow queries that timeout, it’s important to configure query timeout parameters in ways that align with overall goals and priorities. Specifically, consider:
- Setting generous cluster-level timeout defaults: As a rule of thumb, setting a relatively long cluster-wide default timeout period (like 20 or 30 seconds) is a good idea. It provides a backstop against excessively long queries without being too restrictive to stop queries that legitimately need a lot of time to complete.
- Setting request-level timeouts that reflect individual use cases: At the same time, individual query timeout search requests should align with request type or use case. For example, queries that involve searching a large database to collect information about multiple customers could have longer timeout windows than queries that fetch data for just one customer.
- Aligning query timeouts with shard count: Generally speaking, queries will be faster when you have fewer shards, so it makes sense to use more restrictive timeouts under these conditions.
Monitoring and diagnosing Elasticsearch query timeout issues
You can set query timeouts, but the only way to guarantee that they’re delivering the performance results you seek – and to resolve issues where queries take longer than they should – is to monitor and diagnose query timeout problems.
Key metrics to monitor include:
- Query latency: Measures how long searches take to complete, making it easy to identify slow or timing-out queries.
- Search throughput: Tracks the number of search requests processed over time to reveal workload spikes and capacity limitations.
- CPU utilization: Shows whether processors are becoming saturated and slowing query execution.
- JVM heap usage: Indicates whether memory pressure is affecting search performance or causing excessive garbage collection.
- Garbage collection activity: Reveals when frequent or lengthy garbage collection pauses are delaying query processing.
- Disk I/O: Measures storage performance to identify read or write bottlenecks that increase query latency.
- Thread pool utilization: Shows whether search thread pools are becoming overloaded and causing requests to queue.
- Shard performance: Identifies slow or overloaded shards that are delaying overall query execution.
In addition, slow query logs provide valuable insight into searches that consistently exceed expected execution times, and the Search Profiler and Profile API can help pinpoint inefficient query structures, expensive aggregations and other bottlenecks.
To diagnose slow queries, you need to correlate query performance with the health of the underlying Elasticsearch cluster. Admins should examine node resource utilization, shard allocation, indexing activity and network performance alongside application-level request patterns to determine whether timeouts stem from inefficient queries, infrastructure limitations or temporary workload spikes. Centralized observability platforms that combine Elasticsearch metrics, logs and traces can further accelerate root cause analysis by providing a unified view of search performance and cluster health.
Step-by-step process for resolving Elasticsearch query timeouts
To work through issues with query timeouts in Elasticsearch, follow these core steps.
1. Identify slow queries using logs and profiling tools
The first step in resolving query timeout issues is determining which searches are consistently performing poorly. As we mentioned, Elasticsearch slow query logs record requests that exceed configured execution thresholds, while the Profile API and Search Profiler provide detailed insight into how queries are executed. These tools help identify expensive query clauses, inefficient aggregations, unnecessary scoring operations and other factors contributing to long response times.
By analyzing real query behavior instead of relying on assumptions, admins can focus their optimization efforts on the searches that have the greatest impact on application performance. This targeted approach reduces troubleshooting time and prevents unnecessary configuration changes.
2. Analyze query execution and resource bottlenecks
After identifying slow queries, the next step is determining whether the problem lies in the query itself or the underlying infrastructure. Reviewing CPU utilization, JVM heap usage, garbage collection, disk I/O, thread pool activity and shard performance helps reveal whether resource constraints are delaying query execution.
It’s also important to evaluate indexing activity, shard distribution and cluster health alongside query metrics. Correlating these data points makes it easier to distinguish between inefficient searches, overloaded nodes and temporary workload spikes that can all contribute to query timeouts.
3. Optimize queries, indexing, and infrastructure
Once the root cause has been identified, teams can implement targeted optimizations to improve search performance. Common improvements include simplifying query structures, replacing expensive query types with more efficient alternatives, reducing response sizes, optimizing index mappings and adjusting shard sizes to better match the workload.
Infrastructure improvements may also be necessary when resource limitations are the primary cause of timeouts. Adding cluster capacity, balancing workloads across nodes, increasing available memory or upgrading storage can reduce contention and ensure queries complete within configured timeout thresholds.
4. Validate fixes and continuously monitor performance
After implementing changes, admins should verify that query performance has actually improved, and that timeouts have been eliminated. Specifically, compare latency, throughput and resource utilization before and after optimization to confirm whether the changes addressed the underlying problem without introducing new performance issues.
Continuous monitoring helps ensure improvements remain effective as data volumes and workloads evolve. Regularly reviewing slow query logs, cluster metrics and search performance trends enables teams to detect emerging bottlenecks early and make proactive adjustments before query timeouts begin affecting users again.
Elasticsearch query timeout best practices for production environments
To help optimize overall query performance and prevent timeouts, consider the following best practices:
- Design efficient queries from the start: Use optimized query structures, appropriate filters and efficient index mappings to minimize execution time and reduce the risk of timeouts under production workloads.
- Right-size shards and cluster resources: Configure shard sizes, memory, CPU and storage to match data volume and query demand so the cluster can consistently handle peak traffic without performance degradation.
- Continuously monitor search performance: Track query latency, slow query logs, JVM heap usage, thread pool utilization and other cluster metrics to detect bottlenecks before they result in widespread timeout issues.
- Test and optimize as workloads evolve: Regularly benchmark queries, review index designs and validate performance after application or infrastructure changes to ensure search operations continue meeting production performance requirements.
Elasticsearch timeouts vs. other performance issues
Query timeouts are only one of the common core performance problems that arise in Elasticsearch, and it’s important not to conflate them with other issues (such as the following) that are similar but distinct.
Timeout vs. slow query
Slow queries can time out if they exceed the defined timeout threshold, but not all slow queries lead to timeouts – and indeed, some queries naturally take longer to process due to their complexity or the volume of data involved. The timeout threshold for those queries should be long enough to allow them to complete fully.
Timeout vs. node failure
Queries that time out don’t complete successfully. This is one potential cause of a query failure.
Another cause is node failures, which happen when an Elasticsearch node disconnects or crashes. Node failures won’t necessarily cause query failures, as long as shards stored on the failed node are replicated across other nodes. That said, it’s important to investigate node failure events because if too many nodes fail, the cluster will begin slowing down, and eventually stop responding, due to lack of resources.
Timeout vs. rejected execution
Rejected executions occur in Elasticsearch when a cluster ignores a task due to being fully maxed out on current tasks. Rejected executions can cause queries to fail because Elasticsearch rejects them and doesn’t attempt to process them at all – but this is different from having a query time out.
Real-time visibility into Elasticsearch query timeout issues with groundcover
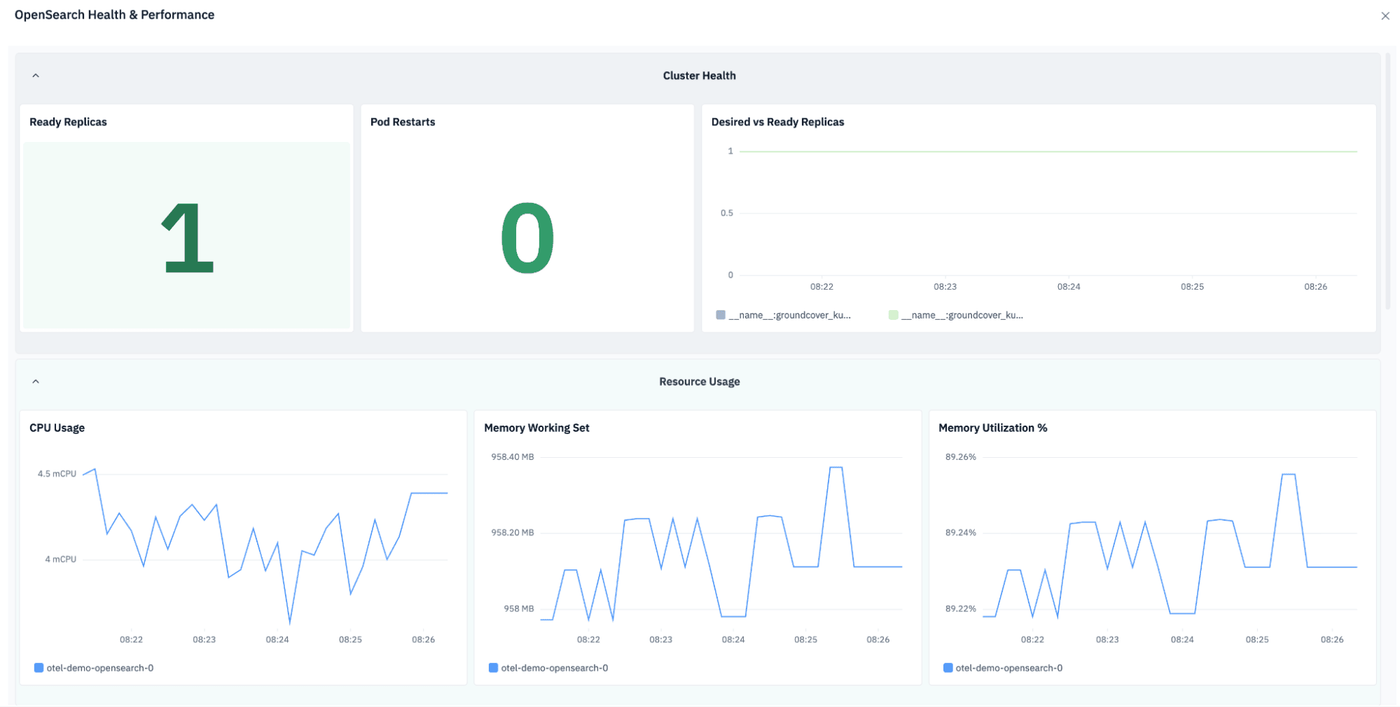
When it comes to detecting and troubleshooting query timeout problems, groundcover has you covered. groundcover continuously monitors all components within Elasticsearch to provide deep context and visibility into query performance, node health and resource utilization. With this data, admins can identify instances of query timeouts and determine their root cause quickly. What’s more, by providing early warning about issues like nodes that lack enough resources, groundcover helps prevent queries from timing out in the first place.
The icing on the cake is that groundcover can collect data using the hyper-efficient eBPF framework. This approach keeps resource overhead minimal – so you don’t need to use resources inefficiently just to check whether Elasticsearch query timeouts are causing inefficient resource consumption by your cluster.
Time’s up for query timeouts
Like fire extinguishers or toilet plungers, Elasticsearch query timeouts are something that you should typically have on hand, but hope you never use. That’s because timeouts serve as a safeguard against queries that take excessively long – but when you properly configure and monitor Elasticsearch, you shouldn’t have to worry about queries taking a long time in the first place.
FAQs
A query timeout stops waiting for a response after the configured time limit, while query cancellation actively terminates query execution to free cluster resources.
Correlate slow query logs, query latency, resource utilization, thread pool activity and cluster health metrics to determine whether timeouts are caused by inefficient queries, resource contention or workload spikes.
groundcover combines Elasticsearch metrics, logs and distributed traces into a unified observability platform. By correlating and contextualizing all relevant data points, admins can quickly identify slow queries, pinpoint infrastructure bottlenecks and accelerate root cause analysis.